
 Matty Beniers
| Position | Center | Current Team | Seattle Kraken |
| Shoots | Left | Current Contract | 7 years ($7.1M CapHit) |
| Height | 6'2" | Expires | 2030-31 |
| Weight (lbs) | 181 | Expiry Age (Jun 30) | 28 |
| Age (DOB) | 23 (Nov 5, 2002) | Expiry Status | UFA |
| Drafted | 2021, Round 1, Overall 2 (SEA) |
| Date | Team | Transaction | |
|---|---|---|---|
| Aug 20, 2024 | Seattle Kraken | Signed 7 years @ $7.143M AAV starting in 2024-25 | |
| Apr 10, 2022 | Seattle Kraken | Signed to an entry level contract. |
Player Card(s)
URL: https://thestanleycap.com/cdn/player_cards/20252026/matty-beniers-8482665.png

URL: https://thestanleycap.com/cdn/player_cards/20242025/matty-beniers-8482665.png

URL: https://thestanleycap.com/cdn/player_cards/20232024/matty-beniers-8482665.png
About Player Cards
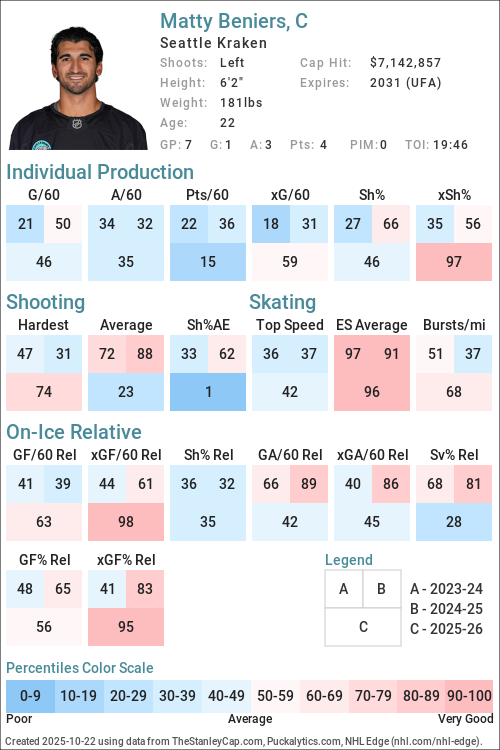
Player cards present an infographic of a players performance using a series of Player Archetypes developed for Puckalytics.com and TheStanleyCap.com. The boxes in the rink image show the archetype ratings for the season specified in the card while the graphs to the right show the five-year trends for those archetypes.
Except for Faceoffs, the values shown are the players z-score (standard deviation from the mean) for the specific metric used to calculate the archetype values. When calculating z-scores forwards were compared to forwards and defensemen were compared to defensemen. Positive values indicate the player is above average and shaded in blue, while negative values indicate the player is below average and shaded in pink. The five year trend charts show a range of -4.0 to 4.0.
The value shown for Faceoffs is the faceoff winning percentage rather than their z-score with winning percentages below 50 in pink shades and above 50 in blue shades.
All archetypes are 5v5 except 5v4 TOI, 4v5 TOI, Skating (even strength) and Faceoffs (all situations). Archetypes use regular season data only.
Archetypes Summary
- Sniper - Measures the to score above the expected goal rate.
- Rebound - Measures the percent of a players shot attempts that come from rebounds (forwards only).
- 5v4 TOI - Powerplay ice time, calculated as the percentage of his teams 5v4 ice time that the player was on the ice for.
- Shooter - Measures whether a players points come from shots (goals or assists on rebounds from his shots).
- Producer - Measures a players ability to produce goals and assists, adjusted for quality of teammates.
- Playmaker - Measures whether a players points come from passes.
- Drive - Measures a players ability to drive puck possession and generate shot attempts for his team.
- Rush - Measures the percent of a players shot attempts that come from rush plays
- Possession - An indicator of a players ability to improve his teams puck possession game.
- Faceoffs - Faceoff Winning Percentage (min. 75 faceoffs taken).
- 5v5 TOI - The percentage of his teams 5v5 TOI that the player was on the ice for.
- Suppress - Measures a players ability to suppress opponent puck possession and shot attempts against.
- Skating - An indicator of a players skating ability, or speed bursts above 20mph per mile skated.
- Defend - An indicator of a players ability to suppress shot quality against.
- 4v5 TOI - Penalty Kill ice time, calculated as the percentage of his teams 4v5 ice time that the player was on the ice for.
Data Sources
- Salary data is from TheStanleyCap.com
- Skating data is from NHL Edge
- Other statistics are from Puckalytics.com and derived from data from NHL.com
Terms of Use
You are free to use include player cards in written articles, share on social media, or on other public websites under the following conditions:
- You credit TheStanleyCap.com as the source and provide a link back to TheStanleyCap.com or this player page.
- You do not mass copy/duplicate/publish dozens or hundreds of player cards. A few, or a handful for a written article is fine. Be reasonable. Fair use rules apply.
- If you are a high-traffic website you must download and host the image(s) on your site rather than overload TheStanleyCap servers with traffic.
Note: Player cards will update daily throughout the season so if you want to include snapshot then you must download the image.
If you have any questions, send an e-mail to the e-mail address at the top of this page.
Read Introducing Player Archetypes on HockeyAnalysis.com for more details on archetype calculations.
Core Archetypes
| Season | Team(s) | GP | TOI | Producer | Playmaker | Shooter | Sniper | Rebound | Rush | Skating | Defend |
|---|---|---|---|---|---|---|---|---|---|---|---|
| 2021-22 | SEA | 10 | 1.45 | 4.47 | -1.10 | 1.38 | -2.34 | -2.04 | 0.02 | 0.06 | |
| 2022-23 | SEA | 80 | 0.52 | 0.33 | 0.17 | 1.17 | -0.14 | 0.58 | -0.43 | 0.59 | |
| 2023-24 | SEA | 77 | -0.75 | -0.32 | -0.79 | -0.36 | -0.92 | 2.03 | -0.15 | 0.39 | |
| 2024-25 | SEA | 82 | -0.57 | -0.75 | -0.09 | 0.38 | -0.76 | 0.31 | -0.50 | 0.88 | |
| 2025-26 | SEA | 82 | 0.10 | 0.20 | -0.22 | 0.43 | 0.02 | 0.73 | -0.33 | -0.35 |
Situational and Secondary Archetypes
| Season | Team(s) | GP | TOI | 5v5 TOI | 5v4 TOI | 4v5 TOI | Possession | Drive | Suppress | Faceoffs |
|---|---|---|---|---|---|---|---|---|---|---|
| 2021-22 | SEA | 10 | 0.28 | 0.94 | -1.94 | -1.60 | -1.00 | -1.31 | 42.4 | |
| 2022-23 | SEA | 80 | 0.67 | 0.30 | -1.45 | -0.65 | -0.19 | -0.80 | 42.2 | |
| 2023-24 | SEA | 77 | 0.98 | 0.42 | -1.64 | -0.27 | -0.28 | -0.08 | 47.4 | |
| 2024-25 | SEA | 82 | 1.22 | 0.43 | -1.15 | 0.74 | 0.25 | 0.92 | 47.7 | |
| 2025-26 | SEA | 82 | 1.24 | 0.82 | -1.04 | 0.59 | 0.21 | 0.64 | 47.8 |
5v5 Individual Stats
| Season | Team(s) | GP | TOI | G/60 | A/60 | Pts/60 | xG/60 | GAE/60 | Sh% | xSh% | Sh%AE | %SA Rush | %SA Reb. |
|---|---|---|---|---|---|---|---|---|---|---|---|---|---|
| 2021-22 | SEA | 10 | 132:03 | 0.45 | 1.82 | 2.27 | 0.28 | 0.18 | 12.50 | 7.57 | 4.93 | 0.00 | 0.00 |
| 2022-23 | SEA | 80 | 1064:53 | 0.96 | 1.24 | 2.20 | 0.74 | 0.22 | 15.89 | 12.19 | 3.70 | 4.94 | 6.79 |
| 2023-24 | SEA | 77 | 1089:25 | 0.44 | 0.77 | 1.21 | 0.51 | -0.07 | 7.92 | 9.21 | -1.28 | 8.15 | 5.19 |
| 2024-25 | SEA | 82 | 1183:44 | 0.66 | 0.71 | 1.37 | 0.59 | 0.07 | 12.15 | 10.86 | 1.29 | 2.91 | 5.23 |
| 2025-26 | SEA | 82 | 1209:30 | 0.64 | 1.04 | 1.69 | 0.59 | 0.05 | 13.68 | 12.60 | 1.08 | 3.77 | 8.18 |
5v5 On Ice Stats
| Season | Team(s) | GP | TOI | SAF/60 | GF/60 | xGF/60 | SAA/60 | GA/60 | xGA/60 | GF% | xGF% | xGF Rel | xGA Rel | xGF% Rel |
|---|---|---|---|---|---|---|---|---|---|---|---|---|---|---|
| 2021-22 | SEA | 10 | 132:03 | 38.17 | 2.73 | 2.08 | 39.53 | 3.18 | 2.64 | 46.15 | 44.14 | -0.49 | 0.49 | -10.46 |
| 2022-23 | SEA | 80 | 1064:53 | 42.31 | 3.49 | 2.64 | 39.38 | 2.20 | 2.29 | 61.39 | 53.51 | 0.02 | -0.16 | 1.80 |
| 2023-24 | SEA | 77 | 1089:25 | 39.76 | 1.98 | 2.40 | 41.47 | 1.98 | 2.25 | 50.00 | 51.59 | 0.10 | 0.02 | 0.84 |
| 2024-25 | SEA | 82 | 1183:44 | 41.16 | 2.33 | 2.24 | 41.01 | 2.33 | 2.33 | 50.00 | 49.04 | 0.02 | -0.26 | 2.91 |
| 2025-26 | SEA | 82 | 1209:30 | 37.45 | 2.53 | 2.24 | 42.46 | 2.33 | 2.52 | 52.04 | 47.09 | 0.03 | -0.16 | 1.95 |
NHL Edge Stats
| Skating | Shooting | Zone Time | |||||||||||
|---|---|---|---|---|---|---|---|---|---|---|---|---|---|
| Season | GP | Top Speed | Bursts>20/mi | Avg. Speed | Top Speed | Avg. Speed | %Long Range | %Mid Range | %High Danger | ES DZ% | ES NZ% | ES OZ% | |
| This table is for Basic and Premium subscribers only. To view please login to and/or subscribe to one of our subscription plans. | |||||||||||||
Legend
| Percentile 0-25 | Percentile 25-50 | Percentile 50-75 | Percentile 75-100 |
5v5 Lines
| Season | Teammate | Teammate | Team | TOI | GF/60 | GA/60 | GF% | xGF/60 | xGA/60 | xGF% | xGF Rel | xGA Rel | xGF% Rel |
|---|
Glossary
| Type | Statistic | Definition |
|---|---|---|
| Individual | G/60 | Goals Against per 60 minutes. |
| Individual | A/60 | Assists per 60 minutes. |
| Individual | Pts/60 | Points per 60 minutes. |
| Individual | xG/60 | Expected Goals per 60 minutes. |
| Individual | GAE/60 | Goals Above Expected (G/60 - xG/60). |
| Individual | Sh% | Shooting Percentage. |
| Individual | xSh% | Expected Shooting Percentage. |
| Individual | Sh%AE | Shooting percentage above expected (Sh% - xSh%). |
| Individual | %SA Rush | Percentage of shot attempts determined to be on the rush. |
| Individual | %SA Reb. | Percentage of shot attempts determined to be from rebounds. |
| On Ice | SAF/60 | Shot Attempts For per 60 minutes. |
| On Ice | GF/60 | Goals For per 60 minutes. |
| On Ice | xGF/60 | Expected Goals For per 60 minutes. |
| On Ice | SAA/60 | Shot Attempts Against per 60 minutes (lower is better). |
| On Ice | GA/60 | Goals Against per 60 minutes (lower is better). |
| On Ice | xGA/60 | Expected Goals Against per 60 minutes (lower is better). |
| On Ice | GF% | Goals For Percentage = Goals For / (Goals For + Goals Against) |
| On Ice | xGF% | Expected Goals For Percentage = Expected Goals For / (Expected Goals For + Expected Goals Against) |
| On Ice | xGF Rel | xGF/60 when On Ice - xGF/60 when not On Ice. |
| On Ice | xGA Rel | xGA/60 when On Ice - xGA/60 when not On Ice (lower is better). |
| On Ice | xGF% Rel | xGF% when On Ice - xGF% when not On Ice. |
News and Opinions
-
Kraken Resolve To Take Best Shot in 2026-’27 at Seattle Hockey Insider (Fri Jun 26, 2026)
-
PHOTO: Matty Beniers a été aperçu à Montréal aujourd'hui at HABSolument Fan (Wed Jun 24, 2026)
-
Matty Beniers spotted in Montreal as Kraken forward draws Canadiens trade rumours at Habs Fanatics (Wed Jun 24, 2026)
-
PHOTO | Matthew Beniers aperçu à Montréal at Dans Les Coulisses (Wed Jun 24, 2026)
-
Kraken Might Benefit From Injection Of ‘Goofy’ at Seattle Hockey Insider (Sat Jun 20, 2026)
-
4 Trade Targets to Boost Flyers’ Center Position This Offseason at The Hockey Writers (Sun Jun 7, 2026)
-
NHL Rumor Roundup: Updates On Mason McTavish, Matty Beniers And Brady Tkachuk at The Hockey News (Fri May 29, 2026)
-
NHL Rumor Mill – May 26, 2026 at Spectors Hockey (Tue May 26, 2026)
-
Flyers Trade Talk: An Under The Radar Target This Summer at Philly Hockey Now (Sun May 24, 2026)
-
Kraken RECAP: LA gets last laugh, Seattle can’t keep up in 5-3 LOSS at Davy Jones Locker Room (Tue Apr 14, 2026)
-
We “C” What Seattle Kraken Matty Beniers Just Did at Seattle Hockey Insider (Wed Mar 25, 2026)
-
Three Takeaways – Kraken fall apart in second, lose 4-2 to Predators at Sound of Hockey (Wed Mar 11, 2026)
-
Again vs. Predators, Seattle Kraken TAKE Lead, Can’t KEEP Lead at Davy Jones Locker Room (Wed Mar 11, 2026)
-
Kraken Notebook – Olympic reactions, Grubauer returns, looming roster crunch at Sound of Hockey (Mon Feb 23, 2026)
-
Three Takeaways – Shane Wright scores two, Kraken roll to 5-2 win over Maple Leafs at Sound of Hockey (Fri Jan 30, 2026)
-
Kraken Week Ahead: Schedule & Storylines – Increased Swagger, Montour Update, Beniers and More at The Hockey Writers (Mon Jan 12, 2026)
-
Kraken Week Ahead: Schedule & Storylines – Heating Up, Beniers, Fleury and More at The Hockey Writers (Mon Jan 5, 2026)
-
Kraken RECAP: Matty Beniers gets the game winner in a 4-3 Shootout VICTORY! at Davy Jones Locker Room (Sat Jan 3, 2026)
-
Beniers the Shootout Hero as Kraken Take Down Canucks 4-3 at The Hockey Writers (Sat Jan 3, 2026)
-
3 Takeaways From the Kraken’s 4-1 Win Over the Predators at The Hockey Writers (Fri Jan 2, 2026)
-
Top-5 : Tour du chapeau (et une passe) pour Auston Matthews at Dans Les Coulisses (Fri Jan 2, 2026)
-
No Hangover Here: Beniers’ Early Strikes Power Kraken 4-1 Ambush Of Predators at Davy Jones Locker Room (Fri Jan 2, 2026)
-
Kraken’s Matty Beniers Records 100th NHL Assist at The Hockey Writers (Wed Dec 24, 2025)
-
Three Takeaways – Montour’s OT winner caps another Kraken comeback, 3-2 against Penguins at Sound of Hockey (Sun Nov 23, 2025)
-
Kraken Gameday Preview: Rookies Look to Make an Impact Against Blackhawks at The Hockey Writers (Thu Nov 20, 2025)
-
Top 10 Brick Invitational Performances By Current NHLers at The Hockey Writers (Mon Nov 10, 2025)
-
Kraken Turn Up (Shot) Volume To Silence Blackhawks, 3-1 at Davy Jones Locker Room (Tue Nov 4, 2025)
-
Kraken Gameday Preview: Kicking Off the First Road Trip of 2025-26 at The Hockey Writers (Tue Oct 14, 2025)
-
Seattle Kraken Bios: Matty Beniers at Davy Jones Locker Room (Sun Oct 12, 2025)
-
3 Takeaways From the Kraken’s 2-1 OT Winner Over the Golden Knights at The Hockey Writers (Sun Oct 12, 2025)
-
7 Observations: Golden Knights Smothered, Fall to Kraken in OT at Vegas Hockey Now (Sun Oct 12, 2025)
-
More Late Seattle Magic! Jared McCann Scores In Last 4 Seconds Of OT To Beat Vegas at Davy Jones Locker Room (Sun Oct 12, 2025)
-
Projecting the NHL's leap-forward players for 2025-26, led by Matty Beniers at ESPN (Wed Oct 1, 2025)
-
Kraken Beniers Looks To Take Big Step at Seattle Hockey Insider (Wed Sep 3, 2025)
-
Seattle Kraken’s 2024-25 Report Cards: Matty Beniers at The Hockey Writers (Thu Aug 7, 2025)
-
Where the Kraken stand in the expansion race to relevance at Kraken Chronicle (Thu Apr 17, 2025)
Current Contract
Matty Beniers signed a $50,000,000 7-year contract with the Seattle Kraken and General Manager Ron Francis on August 20, 2024 with an AAV of $7,142,857. This contract will start in 2024-25 and end after the 2030-31 season. In the first season of the contract the cap hit was equivalent to 8.12% of the salary cap.
Standard Contract (RFA) ( ) (0 ratings)
Matty Beniers signed a $2,692,500 3-year contract with the Seattle Kraken and General Manager Ron Francis on April 10, 2022 with an AAV of $897,500. This contract will start in 2021-22 and end after the 2023-24 season. In the first season of the contract the cap hit was equivalent to 1.10% of the salary cap.
Entry Level Contract ( ) (0 ratings)
| Season | Age* | Clause | Cap Hit | AAV | Perf. Bonus | Sign. Bonus | Salary | Compensation | Minors Salary | Status | |
|---|---|---|---|---|---|---|---|---|---|---|---|
| 2021-22 | 18 | $897,500 | $1,850,000 | $82,500 | $92,500 | $750,000 | $842,500 | $80,000 | ELC | ||
| 2022-23 | 19 | $897,500 | $1,850,000 | $925,000 | $92,500 | $832,500 | $925,000 | $80,000 | ELC | ||
| 2023-24 | 20 | $897,500 | $1,850,000 | $1,850,000 | $92,500 | $832,500 | $925,000 | $80,000 | ELC | ||
| Total | $2,857,500 | $277,500 | $2,415,000 | $2,692,500 | $240,000 |
Career Statistics
| Regular Season | Playoffs | |||||||||||||||||||
|---|---|---|---|---|---|---|---|---|---|---|---|---|---|---|---|---|---|---|---|---|
| Season | League | Team | GP | G | A | Pts | +/- | PIM | Shots | Sh% | TOI/G | GP | G | A | Pts | +/- | PIM | Shots | Sh% | TOI/G |
| 2011-12 | Brick Invitational | Boston Jr. Bruins | 6 | 1 | 5 | 6 | 2 | |||||||||||||
| 2014-15 | QC Int PW | South Shore Kings PW | 3 | 1 | 0 | 1 | 2 | |||||||||||||
| 2017-18 | USHS-Prep | Milton Academy | 23 | 11 | 16 | 27 | ||||||||||||||
| 2017-18 | MHSL U16 | Cape Cod Whalers 16U AAA | 8 | 7 | 5 | 12 | ||||||||||||||
| 2017-18 | USA-S15 | Team Royal | 2 | 1 | 0 | 1 | ||||||||||||||
| 2018-19 | NTDP | U.S. National U17 Team | 42 | 10 | 13 | 23 | -6 | 16 | ||||||||||||
| 2018-19 | USHL | USNTDP Juniors | 33 | 11 | 20 | 31 | +18 | 12 | ||||||||||||
| 2018-19 | NTDP | U.S. National U18 Team | 20 | 8 | 12 | 20 | +24 | 8 | ||||||||||||
| 2018-19 | WJC-18 | USA U18 | 7 | 2 | 0 | 2 | +3 | 4 | ||||||||||||
| 2018-19 | WHC-17 | USA U17 | 5 | 2 | 1 | 3 | 6 | |||||||||||||
| 2019-20 | NTDP | U.S. National U18 Team | 44 | 18 | 23 | 41 | 24 | |||||||||||||
| 2019-20 | USHL | USNTDP Juniors | 16 | 7 | 9 | 16 | +5 | 10 | ||||||||||||
| 2020-21 | NCAA | Univ. of Michigan | 24 | 10 | 14 | 24 | +21 | |||||||||||||
| 2020-21 | WJC-20 | USA U20 | 7 | 1 | 2 | 3 | +3 | 2 | ||||||||||||
| 2020-21 | WC | USA | 6 | 1 | 1 | 2 | +1 | 2 | ||||||||||||
| 2021-22 | NCAA | Univ. of Michigan | 37 | 20 | 23 | 43 | +29 | 16 | ||||||||||||
| 2021-22 | NHL | Seattle Kraken | 10 | 3 | 6 | 9 | -1 | 18 | 16.7 | 16:56 | ||||||||||
| 2021-22 | OG | USA | 4 | 1 | 1 | 2 | +2 | 4 | ||||||||||||
| 2022-23 | NHL | Seattle Kraken | 80 | 24 | 33 | 57 | +14 | 2 | 148 | 16.2 | 17:06 | 14 | 3 | 4 | 7 | +6 | 4 | 22 | 13.6 | 17:48 |
| 2023-24 | NHL | Seattle Kraken | 77 | 15 | 22 | 37 | -11 | 20 | 133 | 11.3 | 17:58 | |||||||||
| 2024-25 | NHL | Seattle Kraken | 82 | 20 | 23 | 43 | 14 | 147 | 13.6 | 18:41 | ||||||||||
| 2024-25 | WC | USA | 10 | 3 | 3 | 6 | +10 | 4 | ||||||||||||
| 2024-25 | International | Team USA | 1 | 0 | 1 | 1 | ||||||||||||||
| 2025-26 | NHL | Seattle Kraken | 82 | 20 | 30 | 50 | -8 | 23 | 149 | 13.4 | 19:17 | |||||||||
| NHL Career | 331 | 82 | 114 | 196 | -6 | 59 | 595 | 13.8 | 18:14 | 14 | 3 | 4 | 7 | +6 | 4 | 22 | 13.6 | 17:48 | ||