
 Vladislav Gavrikov
| Position | Left Defense | Current Team | New York Rangers |
| Shoots | Left | Current Contract | 7 years ($7.0M CapHit) |
| Height | 6'3" | Expires | 2031-32 |
| Weight (lbs) | 210 | Expiry Age (Jun 30) | 36 |
| Age (DOB) | 30 (Nov 21, 1995) | Expiry Status | UFA |
| Drafted | 2015, Round 6, Overall 159 (CBJ) |
| Date | Team | Transaction | |
|---|---|---|---|
| Jul 1, 2025 | New York Rangers | Signed 7 years @ $7.000M AAV starting in 2025-26 | |
| Jun 7, 2023 | Los Angeles Kings | Signed 2 years @ $5.875M AAV starting in 2023-24 | |
| Nov 5, 2020 | Columbus Blue Jackets | Signed 3 years @ $2.800M AAV starting in 2020-21 | |
| Apr 13, 2019 | Columbus Blue Jackets | Signed to an entry level contract. |
Player Card(s)
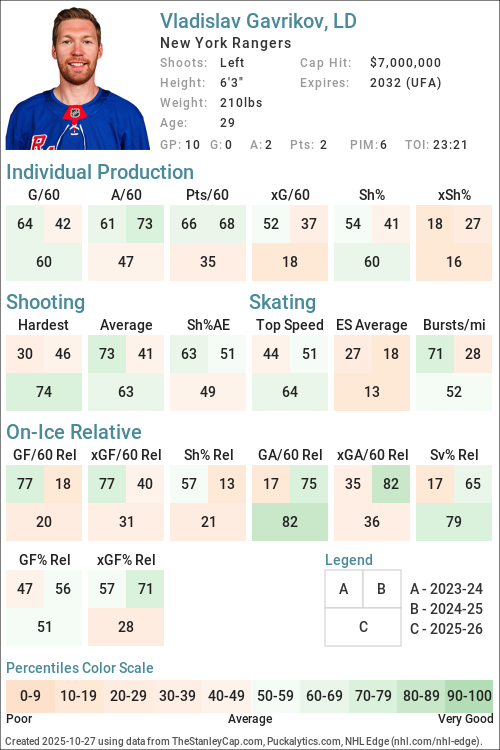
URL: https://thestanleycap.com/cdn/player_cards/20252026/vladislav-gavrikov-8478882.png
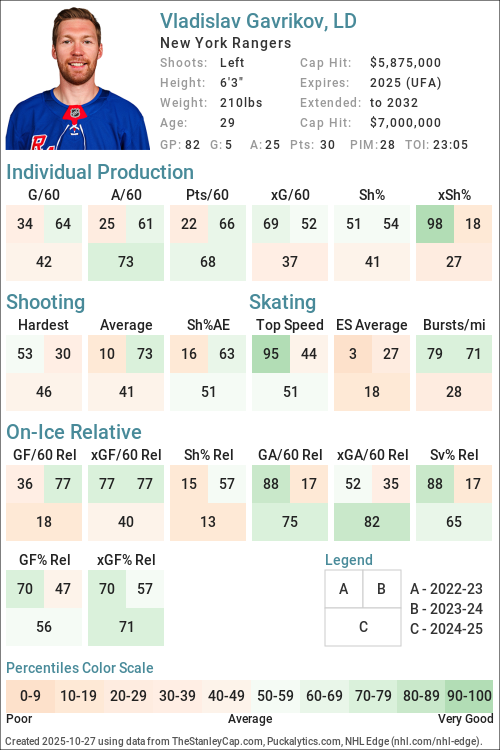
URL: https://thestanleycap.com/cdn/player_cards/20242025/vladislav-gavrikov-8478882.png
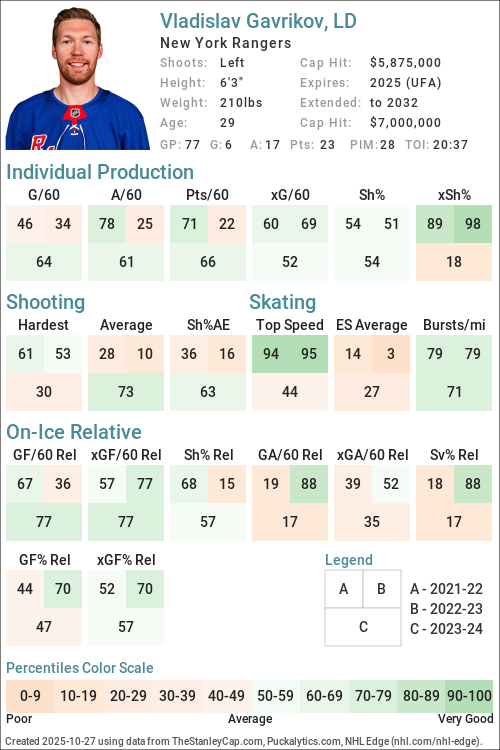
URL: https://thestanleycap.com/cdn/player_cards/20232024/vladislav-gavrikov-8478882.png
About Player Cards
Player cards present an infographic of a players performance using a series of Player Archetypes developed for Puckalytics.com and TheStanleyCap.com. The boxes in the rink image show the archetype ratings for the season specified in the card while the graphs to the right show the five-year trends for those archetypes.
Except for Faceoffs, the values shown are the players z-score (standard deviation from the mean) for the specific metric used to calculate the archetype values. When calculating z-scores forwards were compared to forwards and defensemen were compared to defensemen. Positive values indicate the player is above average and shaded in blue, while negative values indicate the player is below average and shaded in pink. The five year trend charts show a range of -4.0 to 4.0.
The value shown for Faceoffs is the faceoff winning percentage rather than their z-score with winning percentages below 50 in pink shades and above 50 in blue shades.
All archetypes are 5v5 except 5v4 TOI, 4v5 TOI, Skating (even strength) and Faceoffs (all situations). Archetypes use regular season data only.
Archetypes Summary
- Sniper - Measures the to score above the expected goal rate.
- Rebound - Measures the percent of a players shot attempts that come from rebounds (forwards only).
- 5v4 TOI - Powerplay ice time, calculated as the percentage of his teams 5v4 ice time that the player was on the ice for.
- Shooter - Measures whether a players points come from shots (goals or assists on rebounds from his shots).
- Producer - Measures a players ability to produce goals and assists, adjusted for quality of teammates.
- Playmaker - Measures whether a players points come from passes.
- Drive - Measures a players ability to drive puck possession and generate shot attempts for his team.
- Rush - Measures the percent of a players shot attempts that come from rush plays
- Possession - An indicator of a players ability to improve his teams puck possession game.
- Faceoffs - Faceoff Winning Percentage (min. 75 faceoffs taken).
- 5v5 TOI - The percentage of his teams 5v5 TOI that the player was on the ice for.
- Suppress - Measures a players ability to suppress opponent puck possession and shot attempts against.
- Skating - An indicator of a players skating ability, or speed bursts above 20mph per mile skated.
- Defend - An indicator of a players ability to suppress shot quality against.
- 4v5 TOI - Penalty Kill ice time, calculated as the percentage of his teams 4v5 ice time that the player was on the ice for.
Data Sources
- Salary data is from TheStanleyCap.com
- Skating data is from NHL Edge
- Other statistics are from Puckalytics.com and derived from data from NHL.com
Terms of Use
You are free to use include player cards in written articles, share on social media, or on other public websites under the following conditions:
- You credit TheStanleyCap.com as the source and provide a link back to TheStanleyCap.com or this player page.
- You do not mass copy/duplicate/publish dozens or hundreds of player cards. A few, or a handful for a written article is fine. Be reasonable. Fair use rules apply.
- If you are a high-traffic website you must download and host the image(s) on your site rather than overload TheStanleyCap servers with traffic.
Note: Player cards will update daily throughout the season so if you want to include snapshot then you must download the image.
If you have any questions, send an e-mail to the e-mail address at the top of this page.
Read Introducing Player Archetypes on HockeyAnalysis.com for more details on archetype calculations.
Core Archetypes
| Season | Team(s) | GP | TOI | Producer | Playmaker | Shooter | Sniper | Rebound | Rush | Skating | Defend |
|---|---|---|---|---|---|---|---|---|---|---|---|
| 2019-20 | CBJ | 69 | 0.12 | -0.03 | 0.10 | 0.67 | - | 0.04 | - | -0.92 | |
| 2020-21 | CBJ | 55 | 0.34 | 0.80 | -0.53 | 0.04 | - | 0.47 | - | -0.46 | |
| 2021-22 | CBJ | 80 | 0.39 | 0.80 | -0.40 | -0.31 | - | -0.24 | 0.79 | -0.82 | |
| 2022-23 | CBJ, LAK | 72 | -0.66 | -0.82 | -0.29 | -0.73 | - | 0.84 | 0.60 | 1.18 | |
| 2023-24 | LAK | 77 | -0.03 | -0.09 | -0.10 | 0.17 | - | -1.10 | 0.34 | -0.86 | |
| 2024-25 | LAK | 82 | 0.28 | 0.74 | -0.50 | 0.07 | - | 0.35 | -0.64 | 0.46 | |
| 2025-26 | NYR | 82 | 0.52 | -0.28 | 1.59 | 1.61 | - | -0.70 | -0.55 | -0.02 |
Situational and Secondary Archetypes
| Season | Team(s) | GP | TOI | 5v5 TOI | 5v4 TOI | 4v5 TOI | Possession | Drive | Suppress | Faceoffs |
|---|---|---|---|---|---|---|---|---|---|---|
| 2019-20 | CBJ | 69 | 0.11 | -1.72 | -0.09 | 0.03 | -0.12 | 0.16 | - | |
| 2020-21 | CBJ | 55 | -0.09 | -1.61 | 0.59 | -1.00 | -0.69 | -0.64 | - | |
| 2021-22 | CBJ | 80 | 0.96 | -1.45 | 1.71 | 0.04 | -0.12 | 0.24 | - | |
| 2022-23 | CBJ, LAK | 72 | 0.71 | -1.03 | 1.54 | 0.62 | 0.95 | -0.10 | - | |
| 2023-24 | LAK | 77 | 0.62 | -1.27 | 0.64 | 0.38 | 1.16 | -0.56 | - | |
| 2024-25 | LAK | 82 | 1.19 | -1.41 | 1.75 | 0.56 | -0.03 | 0.86 | - | |
| 2025-26 | NYR | 82 | 1.46 | -0.46 | 0.80 | 0.69 | 0.49 | 0.55 | - |
5v5 Individual Stats
| Season | Team(s) | GP | TOI | G/60 | A/60 | Pts/60 | xG/60 | GAE/60 | Sh% | xSh% | Sh%AE | %SA Rush | %SA Reb. |
|---|---|---|---|---|---|---|---|---|---|---|---|---|---|
| 2019-20 | CBJ | 69 | 1122:22 | 0.27 | 0.59 | 0.86 | 0.21 | 0.06 | 6.94 | 5.46 | 1.48 | 1.02 | 8.16 |
| 2020-21 | CBJ | 55 | 907:14 | 0.13 | 0.66 | 0.79 | 0.13 | -0.00 | 4.35 | 4.39 | -0.05 | 1.54 | 1.54 |
| 2021-22 | CBJ | 80 | 1455:18 | 0.16 | 0.87 | 1.03 | 0.20 | -0.04 | 4.26 | 5.23 | -0.98 | 0.79 | 3.94 |
| 2022-23 | CBJ | 52 | 893:43 | 0.07 | 0.34 | 0.40 | 0.21 | -0.14 | 2.08 | 6.58 | -4.50 | 2.78 | 5.56 |
| 2022-23 | LAK | 20 | 359:21 | 0.33 | 0.83 | 1.17 | 0.21 | 0.12 | 8.33 | 5.32 | 3.01 | 0.00 | 6.25 |
| 2022-23 | CBJ, LAK | 72 | 1253:04 | 0.14 | 0.48 | 0.62 | 0.21 | -0.07 | 4.17 | 6.16 | -1.99 | 1.92 | 5.77 |
| 2023-24 | LAK | 77 | 1315:42 | 0.23 | 0.73 | 0.96 | 0.19 | 0.04 | 4.59 | 3.79 | 0.80 | 0.00 | 7.30 |
| 2024-25 | LAK | 82 | 1525:37 | 0.16 | 0.79 | 0.94 | 0.15 | 0.00 | 4.04 | 3.94 | 0.10 | 0.67 | 2.00 |
| 2025-26 | NYR | 82 | 1573:14 | 0.38 | 0.57 | 0.95 | 0.19 | 0.19 | 10.20 | 5.04 | 5.16 | 0.00 | 3.16 |
5v5 On Ice Stats
| Season | Team(s) | GP | TOI | SAF/60 | GF/60 | xGF/60 | SAA/60 | GA/60 | xGA/60 | GF% | xGF% | xGF Rel | xGA Rel | xGF% Rel |
|---|---|---|---|---|---|---|---|---|---|---|---|---|---|---|
| 2019-20 | CBJ | 69 | 1122:22 | 41.38 | 2.30 | 2.39 | 40.04 | 2.35 | 2.13 | 49.43 | 52.78 | 0.07 | -0.10 | 1.89 |
| 2020-21 | CBJ | 55 | 907:14 | 36.37 | 1.79 | 2.12 | 44.24 | 3.04 | 2.44 | 36.99 | 46.41 | 0.03 | 0.05 | -0.18 |
| 2021-22 | CBJ | 80 | 1455:18 | 40.24 | 2.76 | 2.44 | 46.30 | 3.46 | 3.11 | 44.37 | 44.01 | 0.06 | 0.11 | -0.20 |
| 2022-23 | CBJ | 52 | 893:43 | 40.35 | 2.01 | 2.36 | 46.73 | 3.02 | 2.98 | 40.00 | 44.22 | -0.06 | 0.07 | -1.14 |
| 2022-23 | LAK | 20 | 359:21 | 49.26 | 2.34 | 3.13 | 35.90 | 1.00 | 2.15 | 70.00 | 59.29 | 0.42 | -0.05 | 4.16 |
| 2022-23 | CBJ, LAK | 72 | 1253:04 | 42.90 | 2.11 | 2.58 | 43.62 | 2.44 | 2.74 | 46.32 | 48.50 | 0.08 | 0.02 | 0.64 |
| 2023-24 | LAK | 77 | 1315:42 | 48.29 | 2.83 | 2.65 | 39.08 | 2.46 | 2.27 | 53.45 | 53.88 | 0.11 | 0.14 | -0.54 |
| 2024-25 | LAK | 82 | 1525:37 | 43.54 | 2.44 | 2.42 | 35.36 | 1.65 | 1.94 | 59.62 | 55.50 | -0.08 | -0.23 | 1.98 |
| 2025-26 | NYR | 82 | 1573:14 | 38.71 | 1.98 | 2.39 | 39.70 | 2.33 | 2.42 | 46.02 | 49.72 | 0.08 | -0.11 | 1.95 |
NHL Edge Stats
| Skating | Shooting | Zone Time | |||||||||||
|---|---|---|---|---|---|---|---|---|---|---|---|---|---|
| Season | GP | Top Speed | Bursts>20/mi | Avg. Speed | Top Speed | Avg. Speed | %Long Range | %Mid Range | %High Danger | ES DZ% | ES NZ% | ES OZ% | |
| This table is for Basic and Premium subscribers only. To view please login to and/or subscribe to one of our subscription plans. | |||||||||||||
Legend
| Percentile 0-25 | Percentile 25-50 | Percentile 50-75 | Percentile 75-100 |
5v5 Defense Pairs
| Season | Teammate | Team | TOI | GF/60 | GA/60 | GF% | xGF/60 | xGA/60 | xGF% | xGF Rel | xGA Rel | xGF% Rel |
|---|
Glossary
| Type | Statistic | Definition |
|---|---|---|
| Individual | G/60 | Goals Against per 60 minutes. |
| Individual | A/60 | Assists per 60 minutes. |
| Individual | Pts/60 | Points per 60 minutes. |
| Individual | xG/60 | Expected Goals per 60 minutes. |
| Individual | GAE/60 | Goals Above Expected (G/60 - xG/60). |
| Individual | Sh% | Shooting Percentage. |
| Individual | xSh% | Expected Shooting Percentage. |
| Individual | Sh%AE | Shooting percentage above expected (Sh% - xSh%). |
| Individual | %SA Rush | Percentage of shot attempts determined to be on the rush. |
| Individual | %SA Reb. | Percentage of shot attempts determined to be from rebounds. |
| On Ice | SAF/60 | Shot Attempts For per 60 minutes. |
| On Ice | GF/60 | Goals For per 60 minutes. |
| On Ice | xGF/60 | Expected Goals For per 60 minutes. |
| On Ice | SAA/60 | Shot Attempts Against per 60 minutes (lower is better). |
| On Ice | GA/60 | Goals Against per 60 minutes (lower is better). |
| On Ice | xGA/60 | Expected Goals Against per 60 minutes (lower is better). |
| On Ice | GF% | Goals For Percentage = Goals For / (Goals For + Goals Against) |
| On Ice | xGF% | Expected Goals For Percentage = Expected Goals For / (Expected Goals For + Expected Goals Against) |
| On Ice | xGF Rel | xGF/60 when On Ice - xGF/60 when not On Ice. |
| On Ice | xGA Rel | xGA/60 when On Ice - xGA/60 when not On Ice (lower is better). |
| On Ice | xGF% Rel | xGF% when On Ice - xGF% when not On Ice. |
News and Opinions
-
Rangers’ Shesterkin, Gavrikov set for star-studded charity hockey game in Russia at Forever Blueshirts (Wed Jul 15, 2026)
-
Cold water dumped on Rangers' Vladislav Gavrikov trade rumors at Blue Line Station (Thu Jun 25, 2026)
-
Which Rangers Were Overpaid, Underpaid in 2025-26, including Miller, Gavrikov at Forever Blueshirts (Wed Jun 17, 2026)
-
Could the LA Kings reunite with Vladislav Gavrikov this offseason? at Rink Royalty (Tue Jun 16, 2026)
-
Former Kings Fan Favorite Suddenly Linked to Los Angeles Reunion at Yahoo Sports NHL (Tue Jun 16, 2026)
-
MTPS: Is Gavrikov Returning to Los Angeles? at Blue Shirt Banter (Tue Jun 16, 2026)
-
Latest unexpected Rangers trade rumor calls into question Chris Drury's vision at Blue Line Station (Mon Jun 15, 2026)
-
2026 Rangers Report Card: Vladislav Gavrikov at Blue Shirt Banter (Mon May 25, 2026)
-
Rangers Defense Is Now a Team Strength at The Hockey Writers (Sun May 24, 2026)
-
The Defensive Departures That Impacted the Kings Future at Yahoo Sports NHL (Tue May 19, 2026)
-
New York Rangers report cards: Grading Gavrikov, off-season additions at Forever Blueshirts (Mon May 18, 2026)
-
New York Rangers’ 2025-26 Report Cards: Vladislav Gavrikov at The Hockey Writers (Fri May 1, 2026)
-
The 2025-26 New York Rangers Final Report Card; Grades & In-Detail Profiles on Every Player, Blueshirts’ Break-Up Day Not That Encouraging; The ZOOM ZOOM Pizza Man Chris Drury Ducks-And-Dodges Everyone Again, Complete 2026 Stanley Cup Playoffs Preview & Predictions, Looking Ahead; Mark Down Cinco De Mayo On Your Calendar & Much More at Blue Collar Blue Shirts (Mon Apr 20, 2026)
-
Rangers star says Vladislav Gavrikov ‘perfect complement’ on top defense pair at Forever Blueshirts (Fri Apr 17, 2026)
-
Vladislav Gavrikov finding a ‘different dimension’ to his game on pair with Adam Fox at Yahoo Sports NHL (Fri Apr 3, 2026)
-
Rangers vs. Kings: Lineups, storylines for Artemi Panarin return to MSG at Forever Blueshirts (Mon Mar 16, 2026)
-
Where Rangers signing of Vladislav Gavrikov ranks among 2025 NHL free agents at Forever Blueshirts (Sun Mar 15, 2026)
-
Vladislav Gavrikov's point production provides some hope in an unusual season at Blue Line Station (Mon Mar 9, 2026)
-
Defenseman Vladislav Gavrikov showing unexpected scoring touch for Rangers at Yahoo Sports NHL (Mon Mar 9, 2026)
-
Ex-LA Kings blue-liner the subject of trade rumors at Rink Royalty (Tue Feb 24, 2026)
-
Former Los Angeles Kings Defenseman In Spotlight Of NHL Trade Rumors at Yahoo Sports NHL (Mon Feb 23, 2026)
-
NHL Rumors: New York Rangers – Gavrikov, Trocheck, Brodzinski and Quick at NHL Rumors (Mon Feb 23, 2026)
-
NHL Rumor Roundup: Does Vladislav Gavrikov Want Out Of New York? Can The Canucks Move Evander Kane? at The Hockey News (Fri Feb 20, 2026)
-
NHL Rumor Mill – February 19, 2026 at Spectors Hockey (Thu Feb 19, 2026)
-
Artemi Panarin reveals how Vladislav Gavrikov is still assisting him after Rangers blockbuster at Blue Line Station (Thu Feb 19, 2026)
-
How Vladislav Gavrikov Helped Guide Artemi Panarin to Los Angeles at Yahoo Sports NHL (Mon Feb 16, 2026)
-
The Kings lost him for nothing, and now Vladislav Gavrikov returns to L.A. as the Rangers’ new defensive anchor at Blue Line Station (Tue Jan 20, 2026)
-
Halfway There: Midseason Awards for the Rangers’ Best, Worst, and Most Surprising Performers at Blue Shirt Banter (Thu Jan 8, 2026)
-
Tom Wilson mocks Vladislav Gavrikov after Rangers defenseman tries to get tough with him at Russian Machine Never Breaks (Wed Dec 31, 2025)
-
Rangers Daily: ‘Special’ Gavrikov goal; Penguins land mercurial forward at Forever Blueshirts (Tue Dec 30, 2025)
-
Gavrikov has been hiding a big part of his game, and the Rangers got a steal because of it at Blue Line Station (Sat Dec 6, 2025)
-
NYR/OTT 12/4 Review: Sully’s Squad Makes It 2-0 Without Adam Fox; Russian Rangers Capitalize in Canada’s Capital City, “Same Old Rangers” Winning Script; Back-Up Goalies & Injuries Galore, Even-Strength Dominance; Special Teams Still Needs Work, Panarin Needs to Defend Himself, Garden of Dreams Night Reports Interesting Figure; M$GN, Standings; Huge “Prove It” Weekend Ahead & More at Blue Collar Blue Shirts (Fri Dec 5, 2025)
-
Rangers Secure Win Over Senators With Strong All-Around Performance at Yahoo Sports NHL (Fri Dec 5, 2025)
-
‘He can play offense’: Rangers learn there’s more to Vlad Gavrikov’s game at Forever Blueshirts (Wed Dec 3, 2025)
-
Vladislav Gavrikov has been one of the Rangers’ biggest early-season wins at Blue Line Station (Wed Dec 3, 2025)
-
Vladislav Gavrikov's OT winner lifts Rangers to 3-2 win over Stars at Yahoo Sports NHL (Wed Dec 3, 2025)
-
Recap: Gavrikov the Hero as Rangers Come From Behind to Beat Dallas 3-2 in OT at Blue Shirt Banter (Wed Dec 3, 2025)
-
Gavrikov, Borgen have been key factors in stabilizing Rangers’ defense at Forever Blueshirts (Tue Dec 2, 2025)
-
Former LA Kings defenseman finding home with Rangers at Rink Royalty (Wed Nov 26, 2025)
-
Vladislav Gavrikov steps up on both sides of the ice as Rangers snap four-game skid with home win against Blues at Blue Line Station (Tue Nov 25, 2025)
-
NYR/STL 11/24 Review: Last Place Blueshirts Find a Team Much Worse Than Them; Eke Out One-Goal Victory Over Stumbling-and-Bumbling Blues, Fox & Gavrikov Absolutely Dominate; Solid Season Debut for Berard Too, Not Much Desperation Displayed; Another Low Energy Game, Egads CZAR IGOR, Real Test on T-Day Eve – Then Even Tougher Travels The Next Two Weeks Ahead, Injury Updates, Brian Boyle/M$GN & More at Blue Collar Blue Shirts (Tue Nov 25, 2025)
-
Vladislav Gavrikov is exactly what the Rangers needed on defense at Blue Line Station (Tue Nov 18, 2025)
-
Rangers’ Fox & Gavrikov Pairing Off to Strong Start at The Hockey Writers (Tue Nov 4, 2025)
-
Blueshirt Banter 2026-26 Season Preview Roundtable at Blue Shirt Banter (Mon Oct 6, 2025)
-
2025 Rangers Season Previews: Adam Fox at Blue Shirt Banter (Wed Oct 1, 2025)
-
Key takeaways after Rangers blow lead in 5-4 OT preseason loss to Bruins at Forever Blueshirts (Wed Sep 24, 2025)
-
3 things to watch for when Rangers host Bruins in preseason clash at MSG at Forever Blueshirts (Tue Sep 23, 2025)
-
2025 Rangers Season Previews: Vladislav Gavrikov at Blue Shirt Banter (Tue Sep 23, 2025)
-
There's Optimism Around Potential Adam Fox-Vladislav Gavrikov Defensive Pairing at Yahoo Sports NHL (Fri Sep 19, 2025)
-
Vladislav Gavrikov ‘massive upgrade’ on Rangers defense corps, former NHL enforcer believes at Forever Blueshirts (Mon Sep 1, 2025)
-
Rangers News & Rumors: Fox, Gavrikov, Boyko, Garand at The Hockey Writers (Mon Aug 18, 2025)
-
3 biggest whiffs for LA Kings in free agency this offseason at Rink Royalty (Sat Aug 9, 2025)
-
NHL Network analyst likes Rangers future, unsure of present: ‘don’t know that it happens overnight’ at Forever Blueshirts (Thu Aug 7, 2025)
-
LA Kings reportedly tried to get a sign-and-trade done for Vladislav Gavrikov at Rink Royalty (Mon Jul 7, 2025)
-
Even coaching ties couldn’t bring star defenseman to the Red Wings at Octopus Thrower (Tue Jul 1, 2025)
-
Rangers sign top NHL free agent Vladislav Gavrikov to anchor top pair with Adam Fox at Blue Line Station (Tue Jul 1, 2025)
-
LA Kings would love if Vladislav Gavrikov agreed to team-friendly deal like Ekblad at Rink Royalty (Mon Jun 30, 2025)
-
Ken Holland gives bleak update on LA Kings negotiations with Vladislav Gavrikov at Rink Royalty (Sun Jun 29, 2025)
-
Ken Holland shares what the holdup is in Vladislav Gavrikov's negotiations at Rink Royalty (Wed Jun 25, 2025)
-
Insider believes NY Rangers are landing top free agent defenseman on expensive contract at Blue Line Station (Wed Jun 25, 2025)
-
LA Kings and New York Rangers trade idea would be a win-win for everyone at Rink Royalty (Mon Jun 23, 2025)
Current Contract
Vladislav Gavrikov signed a $49,000,000 7-year contract with the New York Rangers and General Manager Chris Drury on July 1, 2025 with an AAV of $7,000,000. This contract will start in 2025-26 and end after the 2031-32 season. In the first season of the contract the cap hit was equivalent to 7.33% of the salary cap.
Standard Contract (UFA) ( ) (0 ratings)
Vladislav Gavrikov signed a $11,750,000 2-year contract with the Los Angeles Kings and General Manager Rob Blake on June 7, 2023 with an AAV of $5,875,000. This contract will start in 2023-24 and end after the 2024-25 season. In the first season of the contract the cap hit was equivalent to 7.04% of the salary cap.
Standard Contract (UFA) ( ) (0 ratings)
| Season | Age* | Clause | Cap Hit | AAV | Perf. Bonus | Sign. Bonus | Salary | Compensation | Minors Salary | Status | |
|---|---|---|---|---|---|---|---|---|---|---|---|
| 2023-24 | 27 | $5,875,000 | $5,875,000 | - | $5,725,000 | $775,000 | $6,500,000 | $6,500,000 | UFA | ||
| 2024-25 | 28 | $5,875,000 | $5,875,000 | - | $4,475,000 | $775,000 | $5,250,000 | $5,250,000 | UFA | ||
| Total | - | $10,200,000 | $1,550,000 | $11,750,000 | $11,750,000 |
Vladislav Gavrikov signed a $8,400,000 3-year contract with the Columbus Blue Jackets and General Manager Jarmo Kekalainen on November 5, 2020 with an AAV of $2,800,000. This contract will start in 2020-21 and end after the 2022-23 season. In the first season of the contract the cap hit was equivalent to 3.44% of the salary cap.
Standard Contract (RFA) ( ) (0 ratings)
| Season | Age* | Clause | Cap Hit | AAV | Perf. Bonus | Sign. Bonus | Salary | Compensation | Minors Salary | Status | |
|---|---|---|---|---|---|---|---|---|---|---|---|
| 2020-21 | 24 | $2,800,000 | $2,800,000 | - | - | $1,650,000 | $1,650,000 | $1,650,000 | 10.2(c) | ||
| 2021-22 | 25 | $2,800,000 | $2,800,000 | - | - | $2,550,000 | $2,550,000 | $2,550,000 | RFA | ||
| 2022-23 | 26 | $2,800,000 | $2,800,000 | - | - | $4,200,000 | $4,200,000 | $4,200,000 | RFA-arb | ||
| Total | - | - | $8,400,000 | $8,400,000 | $8,400,000 |
Vladislav Gavrikov signed a $1,850,000 2-year contract with the Columbus Blue Jackets and General Manager Jarmo Kekalainen on April 13, 2019 with an AAV of $925,000. This contract will start in 2018-19 and end after the 2019-20 season. In the first season of the contract the cap hit was equivalent to 1.16% of the salary cap.
Entry Level Contract ( ) (0 ratings)
| Season | Age* | Clause | Cap Hit | AAV | Perf. Bonus | Sign. Bonus | Salary | Compensation | Minors Salary | Status | |
|---|---|---|---|---|---|---|---|---|---|---|---|
| 2018-19 | 22 | $925,000 | $1,350,000 | - | $92,500 | $832,500 | $925,000 | $70,000 | ELC | ||
| 2019-20 | 23 | $925,000 | $1,350,000 | $850,000 | $92,500 | $832,500 | $925,000 | $70,000 | ELC | ||
| Total | $850,000 | $185,000 | $1,665,000 | $1,850,000 | $140,000 |
Career Statistics
| Regular Season | Playoffs | |||||||||||||||||||
|---|---|---|---|---|---|---|---|---|---|---|---|---|---|---|---|---|---|---|---|---|
| Season | League | Team | GP | G | A | Pts | +/- | PIM | Shots | Sh% | TOI/G | GP | G | A | Pts | +/- | PIM | Shots | Sh% | TOI/G |
| 2010-11 | Russia U16 | Lokomotiv Yaroslavl U16 | 18 | 0 | 8 | 8 | 16 | |||||||||||||
| 2010-11 | Russia U16 Finals | Lokomotiv Yaroslavl U16 | 5 | 2 | 2 | +3 | 8 | |||||||||||||
| 2011-12 | Russia-Jr. | Yaroslavl Jr. | 8 | 1 | 1 | 2 | 4 | 2 | ||||||||||||
| 2012-13 | Russia-Jr. | Yaroslavl Jr. | 47 | 3 | 3 | 6 | 18 | |||||||||||||
| 2013-14 | Russia-Jr. | Yaroslavl Jr. | 45 | 3 | 9 | 12 | 28 | 7 | 2 | 2 | 4 | |||||||||
| 2014-15 | Russia-2 | Ryazan | 11 | 1 | 2 | 3 | 4 | |||||||||||||
| 2014-15 | Russia-Jr. | Yaroslavl Jr. | 16 | 1 | 6 | 7 | 16 | 5 | 2 | |||||||||||
| 2014-15 | KHL | Yaroslavl | 16 | 0 | 1 | 1 | 4 | 4 | ||||||||||||
| 2015-16 | EHT | Russia | 2 | 0 | 0 | 0 | +1 | |||||||||||||
| 2015-16 | KHL | Yaroslavl | 42 | 3 | 4 | 7 | 18 | 5 | 1 | 1 | 2 | |||||||||
| 2015-16 | KHL | Lokomotiv Yaroslavl | 42 | 3 | 4 | 7 | +17 | 18 | 5 | 1 | 1 | -1 | 2 | |||||||
| 2016-17 | WC | Russia | 9 | 1 | 1 | 2 | +9 | 2 | ||||||||||||
| 2016-17 | EHT | Russia | 7 | 1 | 0 | 1 | +2 | 2 | ||||||||||||
| 2016-17 | KHL | Lokomotiv Yaroslavl | 54 | 3 | 4 | 7 | +8 | 38 | 15 | 1 | 4 | 5 | +5 | 14 | ||||||
| 2017-18 | EHT | Russia | 11 | 0 | 2 | 2 | +1 | 6 | ||||||||||||
| 2017-18 | WC | Russia | 8 | 0 | 1 | 1 | +7 | 2 | ||||||||||||
| 2017-18 | OG | Russia | 6 | 2 | 1 | 3 | +6 | 6 | ||||||||||||
| 2017-18 | KHL | SKA St. Petersburg | 50 | 5 | 9 | 14 | +21 | 26 | 15 | 1 | 4 | 5 | +7 | 2 | ||||||
| 2018-19 | WC | Russia | 10 | 0 | 0 | 0 | +2 | 4 | ||||||||||||
| 2018-19 | EHT | Russia | 3 | 2 | 0 | 2 | +2 | |||||||||||||
| 2018-19 | KHL | SKA St. Petersburg | 60 | 5 | 15 | 20 | +48 | 10 | 18 | 1 | 1 | +2 | ||||||||
| 2018-19 | NHL | Columbus Blue Jackets | 2 | -2 | 1 | 0.0 | 15:35 | |||||||||||||
| 2019-20 | NHL | Columbus Blue Jackets | 69 | 5 | 13 | 18 | +1 | 18 | 81 | 6.2 | 18:59 | 10 | 1 | 2 | 3 | -4 | 6 | 15 | 6.7 | 23:21 |
| 2020-21 | NHL | Columbus Blue Jackets | 55 | 2 | 10 | 12 | -13 | 14 | 48 | 4.2 | 19:24 | |||||||||
| 2020-21 | WC | Russia | 8 | 0 | 2 | 2 | +3 | |||||||||||||
| 2021-22 | NHL | Columbus Blue Jackets | 80 | 5 | 28 | 33 | -3 | 68 | 108 | 4.6 | 22:17 | |||||||||
| 2022-23 | NHL | Columbus Blue Jackets | 52 | 3 | 7 | 10 | -8 | 30 | 61 | 4.9 | 22:20 | |||||||||
| 2022-23 | NHL | Los Angeles Kings | 20 | 3 | 6 | 9 | +12 | 8 | 28 | 10.7 | 21:01 | 6 | 1 | 1 | +5 | 10 | 0.0 | 21:38 | ||
| 2023-24 | NHL | Los Angeles Kings | 77 | 6 | 17 | 23 | +9 | 28 | 114 | 5.3 | 20:37 | 5 | 2 | 2 | 2 | 2 | 0.0 | 19:48 | ||
| 2024-25 | NHL | Los Angeles Kings | 82 | 5 | 25 | 30 | +26 | 28 | 112 | 4.5 | 23:05 | 6 | 2 | 2 | -1 | 2 | 5 | 0.0 | 21:00 | |
| 2025-26 | NHL | New York Rangers | 82 | 14 | 21 | 35 | -8 | 50 | 119 | 11.8 | 23:44 | |||||||||
| NHL Career | 517 | 43 | 127 | 170 | +16 | 244 | 671 | 6.4 | 21:36 | 29 | 1 | 7 | 8 | -2 | 10 | 33 | 3.0 | 21:21 | ||