
 Tyler Toffoli
| Position | Right Wing / Left Wing | Current Team | San Jose Sharks |
| Shoots | Right | Current Contract | 4 years ($6.0M CapHit) |
| Height | 6'0" | Expires | 2027-28 |
| Weight (lbs) | 205 | Expiry Age (Jun 30) | 36 |
| Age (DOB) | 34 (Apr 24, 1992) | Expiry Status | UFA |
| Drafted | 2010, Round 2, Overall 47 (LAK) |
| Date | Team | Transaction | |
|---|---|---|---|
| Jul 1, 2024 | San Jose Sharks | Signed 4 years @ $6.000M AAV starting in 2024-25 | |
| Oct 12, 2020 | Montreal Canadiens | Signed 4 years @ $4.250M AAV starting in 2020-21 | |
| Jun 7, 2017 | Los Angeles Kings | Signed 3 years @ $4.600M AAV starting in 2017-18 | |
| Jun 26, 2015 | Los Angeles Kings | Signed 2 years @ $3.250M AAV starting in 2015-16 | |
| Apr 18, 2011 | Los Angeles Kings | Signed to an entry level contract. |
Player Card(s)
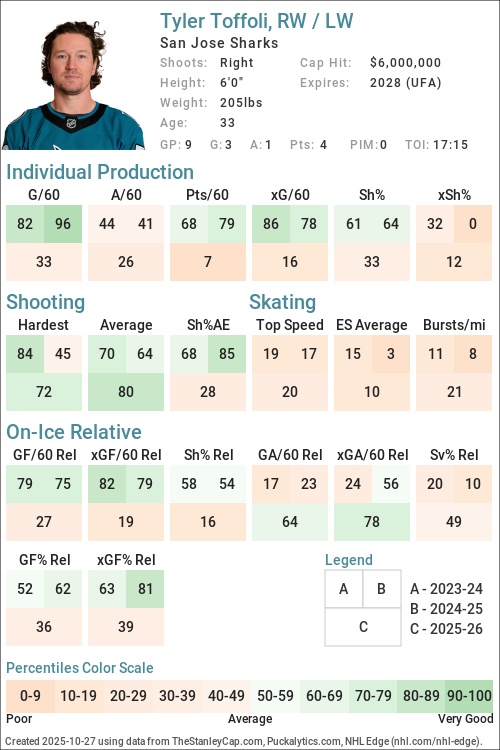
URL: https://thestanleycap.com/cdn/player_cards/20252026/tyler-toffoli-8475726.png
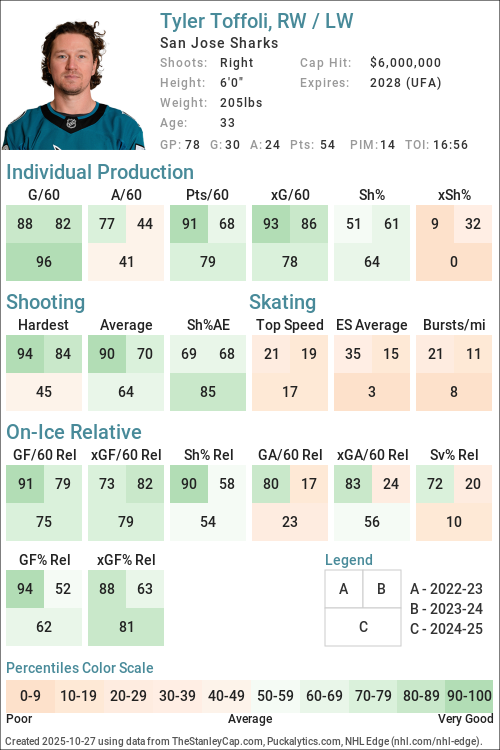
URL: https://thestanleycap.com/cdn/player_cards/20242025/tyler-toffoli-8475726.png
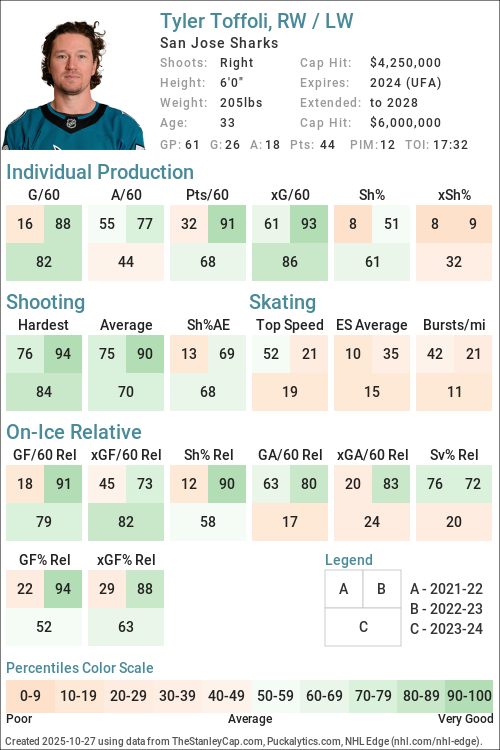
URL: https://thestanleycap.com/cdn/player_cards/20232024/tyler-toffoli-8475726.png
About Player Cards
Player cards present an infographic of a players performance using a series of Player Archetypes developed for Puckalytics.com and TheStanleyCap.com. The boxes in the rink image show the archetype ratings for the season specified in the card while the graphs to the right show the five-year trends for those archetypes.
Except for Faceoffs, the values shown are the players z-score (standard deviation from the mean) for the specific metric used to calculate the archetype values. When calculating z-scores forwards were compared to forwards and defensemen were compared to defensemen. Positive values indicate the player is above average and shaded in blue, while negative values indicate the player is below average and shaded in pink. The five year trend charts show a range of -4.0 to 4.0.
The value shown for Faceoffs is the faceoff winning percentage rather than their z-score with winning percentages below 50 in pink shades and above 50 in blue shades.
All archetypes are 5v5 except 5v4 TOI, 4v5 TOI, Skating (even strength) and Faceoffs (all situations). Archetypes use regular season data only.
Archetypes Summary
- Sniper - Measures the to score above the expected goal rate.
- Rebound - Measures the percent of a players shot attempts that come from rebounds (forwards only).
- 5v4 TOI - Powerplay ice time, calculated as the percentage of his teams 5v4 ice time that the player was on the ice for.
- Shooter - Measures whether a players points come from shots (goals or assists on rebounds from his shots).
- Producer - Measures a players ability to produce goals and assists, adjusted for quality of teammates.
- Playmaker - Measures whether a players points come from passes.
- Drive - Measures a players ability to drive puck possession and generate shot attempts for his team.
- Rush - Measures the percent of a players shot attempts that come from rush plays
- Possession - An indicator of a players ability to improve his teams puck possession game.
- Faceoffs - Faceoff Winning Percentage (min. 75 faceoffs taken).
- 5v5 TOI - The percentage of his teams 5v5 TOI that the player was on the ice for.
- Suppress - Measures a players ability to suppress opponent puck possession and shot attempts against.
- Skating - An indicator of a players skating ability, or speed bursts above 20mph per mile skated.
- Defend - An indicator of a players ability to suppress shot quality against.
- 4v5 TOI - Penalty Kill ice time, calculated as the percentage of his teams 4v5 ice time that the player was on the ice for.
Data Sources
- Salary data is from TheStanleyCap.com
- Skating data is from NHL Edge
- Other statistics are from Puckalytics.com and derived from data from NHL.com
Terms of Use
You are free to use include player cards in written articles, share on social media, or on other public websites under the following conditions:
- You credit TheStanleyCap.com as the source and provide a link back to TheStanleyCap.com or this player page.
- You do not mass copy/duplicate/publish dozens or hundreds of player cards. A few, or a handful for a written article is fine. Be reasonable. Fair use rules apply.
- If you are a high-traffic website you must download and host the image(s) on your site rather than overload TheStanleyCap servers with traffic.
Note: Player cards will update daily throughout the season so if you want to include snapshot then you must download the image.
If you have any questions, send an e-mail to the e-mail address at the top of this page.
Read Introducing Player Archetypes on HockeyAnalysis.com for more details on archetype calculations.
Core Archetypes
| Season | Team(s) | GP | TOI | Producer | Playmaker | Shooter | Sniper | Rebound | Rush | Skating | Defend |
|---|---|---|---|---|---|---|---|---|---|---|---|
| 2015-16 | LAK | 82 | 0.92 | -0.45 | 1.85 | 0.92 | -0.38 | -0.80 | - | 0.75 | |
| 2016-17 | LAK | 63 | -0.45 | -0.45 | -0.24 | -0.66 | -0.23 | 0.25 | - | -0.01 | |
| 2017-18 | LAK | 82 | 0.07 | -0.27 | 0.28 | -0.25 | -1.02 | -0.26 | - | 0.47 | |
| 2018-19 | LAK | 82 | -0.70 | -0.45 | -0.80 | -1.74 | -0.21 | 0.32 | - | -0.35 | |
| 2019-20 | LAK, VAN | 68 | 0.77 | -0.14 | 1.10 | 0.23 | 1.71 | -0.25 | - | 1.29 | |
| 2020-21 | MTL | 52 | 0.89 | -0.65 | 2.27 | 0.73 | -0.82 | 0.54 | - | -0.78 | |
| 2021-22 | CGY, MTL | 74 | -0.36 | 0.34 | -0.87 | -1.03 | -0.82 | -0.00 | -0.36 | 0.72 | |
| 2022-23 | CGY | 82 | 1.13 | 0.08 | 1.21 | 0.48 | -0.69 | 0.25 | -0.78 | 0.59 | |
| 2023-24 | NJD, WPG | 79 | -0.00 | -0.67 | 0.63 | 0.35 | -0.78 | 0.00 | -1.02 | -0.80 | |
| 2024-25 | SJS | 78 | 1.15 | -0.66 | 2.70 | 0.88 | -0.28 | -1.28 | -1.17 | -1.20 | |
| 2025-26 | SJS | 79 | 0.83 | 0.88 | 0.04 | 0.02 | -1.10 | -0.85 | -1.14 | 0.37 |
Situational and Secondary Archetypes
| Season | Team(s) | GP | TOI | 5v5 TOI | 5v4 TOI | 4v5 TOI | Possession | Drive | Suppress | Faceoffs |
|---|---|---|---|---|---|---|---|---|---|---|
| 2015-16 | LAK | 82 | 0.52 | 0.38 | -0.22 | 0.47 | 1.16 | -0.64 | - | |
| 2016-17 | LAK | 63 | 0.22 | 0.22 | -0.52 | 0.65 | 1.13 | -0.32 | - | |
| 2017-18 | LAK | 82 | 0.41 | 0.12 | -1.37 | 0.03 | 1.21 | -1.85 | - | |
| 2018-19 | LAK | 82 | 0.32 | 0.23 | 0.09 | 1.78 | 1.27 | 1.03 | - | |
| 2019-20 | LAK, VAN | 68 | 0.21 | 0.44 | -0.48 | 1.02 | 1.46 | -0.03 | - | |
| 2020-21 | MTL | 52 | 0.58 | 0.61 | -1.02 | 0.54 | 0.91 | -0.17 | - | |
| 2021-22 | CGY, MTL | 74 | -0.17 | 0.49 | -0.48 | -0.40 | -0.05 | -0.75 | - | |
| 2022-23 | CGY | 82 | 0.04 | 0.65 | -1.11 | 0.90 | 0.68 | 0.60 | - | |
| 2023-24 | NJD, WPG | 79 | 0.43 | 1.10 | -2.01 | 0.97 | 1.59 | -0.57 | - | |
| 2024-25 | SJS | 78 | 0.35 | 1.01 | -2.13 | 1.59 | 1.32 | 0.75 | - | |
| 2025-26 | SJS | 79 | -0.36 | 0.67 | -1.99 | 0.29 | 0.50 | -0.33 | - |
5v5 Individual Stats
| Season | Team(s) | GP | TOI | G/60 | A/60 | Pts/60 | xG/60 | GAE/60 | Sh% | xSh% | Sh%AE | %SA Rush | %SA Reb. |
|---|---|---|---|---|---|---|---|---|---|---|---|---|---|
| 2015-16 | LAK | 82 | 1057:12 | 1.14 | 0.91 | 2.04 | 0.87 | 0.26 | 12.35 | 9.50 | 2.84 | 2.48 | 4.13 |
| 2016-17 | LAK | 63 | 780:11 | 0.62 | 0.69 | 1.31 | 0.85 | -0.23 | 6.56 | 9.01 | -2.45 | 4.55 | 4.55 |
| 2017-18 | LAK | 82 | 1057:09 | 0.79 | 0.91 | 1.70 | 0.89 | -0.10 | 7.22 | 8.08 | -0.87 | 3.45 | 2.68 |
| 2018-19 | LAK | 82 | 1056:12 | 0.34 | 0.91 | 1.25 | 0.94 | -0.60 | 3.47 | 9.53 | -6.06 | 4.74 | 4.74 |
| 2019-20 | LAK | 58 | 723:27 | 0.91 | 0.91 | 1.82 | 0.94 | -0.02 | 8.53 | 8.75 | -0.23 | 2.30 | 11.49 |
| 2019-20 | VAN | 10 | 147:31 | 1.63 | 0.81 | 2.44 | 1.04 | 0.58 | 12.90 | 8.28 | 4.62 | 8.11 | 10.81 |
| 2019-20 | LAK, VAN | 68 | 870:58 | 1.03 | 0.90 | 1.93 | 0.95 | 0.08 | 9.38 | 8.66 | 0.71 | 3.32 | 11.37 |
| 2020-21 | MTL | 52 | 684:23 | 1.23 | 0.79 | 2.02 | 0.92 | 0.30 | 12.96 | 9.76 | 3.20 | 4.90 | 3.50 |
| 2021-22 | CGY | 37 | 405:44 | 0.59 | 0.89 | 1.48 | 0.88 | -0.29 | 5.80 | 8.62 | -2.82 | 4.55 | 3.41 |
| 2021-22 | MTL | 37 | 463:13 | 0.26 | 1.04 | 1.30 | 0.64 | -0.38 | 3.33 | 8.25 | -4.92 | 3.49 | 4.65 |
| 2021-22 | CGY, MTL | 74 | 868:57 | 0.41 | 0.97 | 1.38 | 0.75 | -0.34 | 4.65 | 8.45 | -3.80 | 4.02 | 4.02 |
| 2022-23 | CGY | 82 | 990:03 | 1.15 | 1.27 | 2.42 | 1.02 | 0.14 | 10.05 | 8.87 | 1.18 | 4.28 | 5.06 |
| 2023-24 | WPG | 18 | 216:00 | 1.11 | 0.83 | 1.94 | 0.82 | 0.29 | 11.76 | 8.70 | 3.06 | 4.26 | 2.13 |
| 2023-24 | NJD | 61 | 809:16 | 0.96 | 0.89 | 1.85 | 0.88 | 0.08 | 10.83 | 9.90 | 0.93 | 3.78 | 6.49 |
| 2023-24 | NJD, WPG | 79 | 1025:16 | 0.99 | 0.88 | 1.87 | 0.87 | 0.13 | 11.04 | 9.64 | 1.40 | 3.88 | 5.60 |
| 2024-25 | SJS | 78 | 996:01 | 1.20 | 0.78 | 1.99 | 0.88 | 0.32 | 11.98 | 8.78 | 3.20 | 0.47 | 6.60 |
| 2025-26 | SJS | 79 | 905:37 | 0.66 | 1.26 | 1.92 | 0.70 | -0.04 | 9.62 | 10.20 | -0.58 | 1.32 | 4.61 |
5v5 On Ice Stats
| Season | Team(s) | GP | TOI | SAF/60 | GF/60 | xGF/60 | SAA/60 | GA/60 | xGA/60 | GF% | xGF% | xGF Rel | xGA Rel | xGF% Rel |
|---|---|---|---|---|---|---|---|---|---|---|---|---|---|---|
| 2015-16 | LAK | 82 | 1057:12 | 50.68 | 3.06 | 2.70 | 37.29 | 1.65 | 1.95 | 65.06 | 57.98 | 0.46 | -0.04 | 5.12 |
| 2016-17 | LAK | 63 | 780:11 | 47.68 | 2.15 | 2.40 | 36.84 | 2.15 | 2.01 | 50.00 | 54.37 | 0.14 | 0.01 | 1.37 |
| 2017-18 | LAK | 82 | 1057:09 | 45.52 | 2.61 | 2.34 | 46.20 | 2.10 | 2.71 | 55.42 | 46.30 | 0.26 | 0.50 | -2.19 |
| 2018-19 | LAK | 82 | 1056:12 | 43.74 | 1.99 | 2.58 | 40.62 | 2.50 | 2.23 | 44.30 | 53.71 | 0.47 | -0.32 | 8.30 |
| 2019-20 | LAK | 58 | 723:27 | 52.42 | 2.24 | 2.91 | 39.98 | 2.32 | 2.27 | 49.09 | 56.23 | 0.43 | -0.12 | 5.32 |
| 2019-20 | VAN | 10 | 147:31 | 49.21 | 4.07 | 3.19 | 43.52 | 1.63 | 2.70 | 71.43 | 54.11 | 0.70 | 0.15 | 4.83 |
| 2019-20 | LAK, VAN | 68 | 870:58 | 51.87 | 2.55 | 2.96 | 40.58 | 2.20 | 2.34 | 53.62 | 55.83 | 0.48 | -0.08 | 5.16 |
| 2020-21 | MTL | 52 | 684:23 | 45.33 | 2.63 | 2.63 | 38.05 | 2.72 | 2.27 | 49.18 | 53.62 | 0.39 | 0.21 | 1.61 |
| 2021-22 | CGY | 37 | 405:44 | 48.21 | 2.37 | 2.68 | 45.40 | 2.37 | 2.78 | 50.00 | 49.04 | -0.20 | 0.63 | -8.18 |
| 2021-22 | MTL | 37 | 463:13 | 39.38 | 1.68 | 2.50 | 42.74 | 2.46 | 2.44 | 40.62 | 50.64 | 0.30 | -0.44 | 7.27 |
| 2021-22 | CGY, MTL | 74 | 868:57 | 43.50 | 2.00 | 2.58 | 43.98 | 2.42 | 2.60 | 45.31 | 49.85 | 0.04 | 0.09 | -0.54 |
| 2022-23 | CGY | 82 | 990:03 | 51.33 | 3.52 | 3.18 | 35.57 | 2.24 | 2.26 | 61.05 | 58.47 | 0.29 | -0.23 | 4.75 |
| 2023-24 | WPG | 18 | 216:00 | 48.33 | 4.44 | 3.06 | 41.39 | 1.67 | 2.31 | 72.73 | 56.91 | 0.79 | -0.19 | 9.39 |
| 2023-24 | NJD | 61 | 809:16 | 50.49 | 2.89 | 2.81 | 42.85 | 3.41 | 2.74 | 45.88 | 50.60 | 0.24 | 0.37 | -1.41 |
| 2023-24 | NJD, WPG | 79 | 1025:16 | 50.04 | 3.22 | 2.86 | 42.54 | 3.04 | 2.65 | 51.40 | 51.90 | 0.37 | 0.25 | 0.94 |
| 2024-25 | SJS | 78 | 996:01 | 42.95 | 2.53 | 2.39 | 43.25 | 3.25 | 2.76 | 43.75 | 46.40 | 0.30 | 0.01 | 3.20 |
| 2025-26 | SJS | 79 | 905:37 | 37.30 | 2.52 | 2.44 | 42.87 | 2.58 | 2.63 | 49.35 | 48.15 | 0.04 | -0.05 | 0.89 |
NHL Edge Stats
| Skating | Shooting | Zone Time | |||||||||||
|---|---|---|---|---|---|---|---|---|---|---|---|---|---|
| Season | GP | Top Speed | Bursts>20/mi | Avg. Speed | Top Speed | Avg. Speed | %Long Range | %Mid Range | %High Danger | ES DZ% | ES NZ% | ES OZ% | |
| This table is for Basic and Premium subscribers only. To view please login to and/or subscribe to one of our subscription plans. | |||||||||||||
Legend
| Percentile 0-25 | Percentile 25-50 | Percentile 50-75 | Percentile 75-100 |
5v5 Lines
| Season | Teammate | Teammate | Team | TOI | GF/60 | GA/60 | GF% | xGF/60 | xGA/60 | xGF% | xGF Rel | xGA Rel | xGF% Rel |
|---|
Glossary
| Type | Statistic | Definition |
|---|---|---|
| Individual | G/60 | Goals Against per 60 minutes. |
| Individual | A/60 | Assists per 60 minutes. |
| Individual | Pts/60 | Points per 60 minutes. |
| Individual | xG/60 | Expected Goals per 60 minutes. |
| Individual | GAE/60 | Goals Above Expected (G/60 - xG/60). |
| Individual | Sh% | Shooting Percentage. |
| Individual | xSh% | Expected Shooting Percentage. |
| Individual | Sh%AE | Shooting percentage above expected (Sh% - xSh%). |
| Individual | %SA Rush | Percentage of shot attempts determined to be on the rush. |
| Individual | %SA Reb. | Percentage of shot attempts determined to be from rebounds. |
| On Ice | SAF/60 | Shot Attempts For per 60 minutes. |
| On Ice | GF/60 | Goals For per 60 minutes. |
| On Ice | xGF/60 | Expected Goals For per 60 minutes. |
| On Ice | SAA/60 | Shot Attempts Against per 60 minutes (lower is better). |
| On Ice | GA/60 | Goals Against per 60 minutes (lower is better). |
| On Ice | xGA/60 | Expected Goals Against per 60 minutes (lower is better). |
| On Ice | GF% | Goals For Percentage = Goals For / (Goals For + Goals Against) |
| On Ice | xGF% | Expected Goals For Percentage = Expected Goals For / (Expected Goals For + Expected Goals Against) |
| On Ice | xGF Rel | xGF/60 when On Ice - xGF/60 when not On Ice. |
| On Ice | xGA Rel | xGA/60 when On Ice - xGA/60 when not On Ice (lower is better). |
| On Ice | xGF% Rel | xGF% when On Ice - xGF% when not On Ice. |
News and Opinions
-
Revisiting the Canadiens’ Tyler Toffoli Trade at The Hockey Writers (Sat Aug 1, 2026)
-
73 Days to Opening Day: The Story of Tyler Toffoli at Yahoo Sports NHL (Mon Jul 20, 2026)
-
Toffoli Already Excited for Next Year, Endorses Celebrini for Captain at San Jose Hockey Now (Wed Apr 29, 2026)
-
Sharks' Toffoli Reflects on Anze Kopitar, Jonathan Quick Retirements at Yahoo Sports NHL (Sun Apr 26, 2026)
-
5 biggest mistakes of Tom Fitzgerald's New Jersey Devils career at Pucks and Pitchforks (Mon Apr 6, 2026)
-
Preview/Lines #75: Toffoli on Growth From Last Year, Wiesblatt Talks Time in San Jose at San Jose Hockey Now (Sat Apr 4, 2026)
-
Preview/Lines #70: Askarov Starts, Who Sits If Toffoli Plays? at San Jose Hockey Now (Thu Mar 26, 2026)
-
Preview/Lines #68: Toffoli May Not Travel on Road Trip, Desharnais Will Not Play Today at San Jose Hockey Now (Sat Mar 21, 2026)
-
Sharks Practice: Toffoli Will Not Play Against Flyers, Desharnais Game-Time Decision, Team Photo Day Fun at San Jose Hockey Now (Fri Mar 20, 2026)
-
New Jersey Devils finally found their Tyler Toffoli replacement at Pucks and Pitchforks (Fri Mar 20, 2026)
-
Sharks Too Loose, Lose 7-4 to Sens at San Jose Hockey Now (Sun Mar 15, 2026)
-
In Need of a Retool: Who Should the Devils Target in Trades? at All About the Jersey (Sun Mar 1, 2026)
-
In Need of a Retool: Who Should the Devils Target in Trades? at Yahoo Sports NHL (Sun Mar 1, 2026)
-
Preview/Lines #57: Wennberg & Toffoli Coach Pride Scrimmage, Mukhamadullin Back in Sharks’ Line-Up at San Jose Hockey Now (Sat Feb 28, 2026)
-
Sharks Practice: Dellandrea & Toffoli Injury Updates, Why Recall Bystedt & Leddy? at San Jose Hockey Now (Wed Feb 18, 2026)
-
Quick bites: Sharks make quick work of Canucks at Fear the Fin (Wed Jan 28, 2026)
-
Sharks special teams rockets them past the Stars at Fear the Fin (Sun Jan 11, 2026)
-
Sharks Win! Toffoli Powers 5-4 OT Comeback at San Jose Hockey Now (Sat Jan 10, 2026)
-
Sharks prove they belong with heroic comeback in ‘playoff-style' win over Stars at Yahoo Sports NHL (Sat Jan 10, 2026)
-
Celebrini, Eklund, Toffoli Share Excitement Over Wennberg’s Extension at San Jose Hockey Now (Tue Jan 6, 2026)
-
Quick bites: Sharks roar back in Pittsburgh to 6-5 overtime win at Fear the Fin (Sat Dec 13, 2025)
-
Toffoli Breaks Slump, Smith Dazzles, Sharks Win 6-3 at San Jose Hockey Now (Tue Dec 2, 2025)
-
Preview/Lines #24: Toffoli Game-Time Decision, Sharks Will Run 11-7 Without Him at San Jose Hockey Now (Wed Nov 26, 2025)
-
A Breakdown of Every Trade Tom Fitzgerald Has Made Since Becoming Devils General Manager at All About the Jersey (Wed Nov 19, 2025)
-
Preview/Lines #20: Toffoli Finding His Game, Klingberg Scratched at San Jose Hockey Now (Tue Nov 18, 2025)
-
Canucks: 5 Worst Jim Benning Trades at The Hockey Writers (Thu Oct 30, 2025)
-
Sharks Need to Find the Defensive Equivalent of Tyler Toffoli at The Hockey Writers (Thu Oct 23, 2025)
-
Can Macklin Celebrini and Will Smith be the NHL's next great Stanley Cup-winning duo? at ESPN (Tue Oct 21, 2025)
-
Renaud Lavoie Unleashes on Former Hab Tyler Toffoli: 'He Wanted Nothing to Do With Playing for the Canadiens' at Habs Fanatics (Sun Oct 19, 2025)
-
« Il nuisait plus qu’autre chose à Montréal » : Renaud Lavoie ramasse Tyler Toffoli at Dans Les Coulisses (Wed Oct 15, 2025)
-
Quick bites: Sharks fall to Ducks 5-2 in physical preseason game at Fear the Fin (Thu Oct 2, 2025)
-
Rumeur Carey Price : c’est Will Smith qui y croyait le plus at Dans Les Coulisses (Thu Sep 25, 2025)
-
Sharks shutout Vegas 3-0 in preseason opener at Fear the Fin (Mon Sep 22, 2025)
-
Carey Price devant le filet des Sharks? Certains joueurs y ont cru grâce à Tyler Toffoli at HABSolument Fan (Sat Sep 20, 2025)
-
Tyler Toffoli a fait croire à certains joueurs des Sharks que Carey Price reviendra au jeu at Dans Les Coulisses (Fri Sep 19, 2025)
-
Toffoli Talks Sharks’ Captaincy, Impressions of Misa, Hiking With Celebrini at San Jose Hockey Now (Fri Sep 19, 2025)
-
More Reaction: Toffoli and Stoll Share Thoughts on Kopitar’s Announcement at Mayors Manor (Fri Sep 19, 2025)
-
More Reaction: Toffoli and Stoll Share Thoughts on Kopitar’s Annoucement at Mayors Manor (Fri Sep 19, 2025)
-
Misa on How To Stick With Sharks, Hoping To Live With Toffoli, NCAA at San Jose Hockey Now (Wed Sep 10, 2025)
-
3 former LA Kings players on rival teams in 2025-26 season at Rink Royalty (Mon Sep 1, 2025)
-
Giveaway of the year? San Jose Sharks turn player sleepover between Macklin Celebrini, Will Smith, and Tyler Toffoli into viral bobblehead. at Russian Machine Never Breaks (Thu Aug 28, 2025)
-
SJHN Daily: How To Get Special Toffoli Sleepover Bobblehead, Misa at Giants Game at San Jose Hockey Now (Thu Aug 28, 2025)
-
The Real Reason Tyler Toffoli Was Just Spotted Practicing With the Canadiens Has Been Revealed at Habs Fanatics (Wed Jul 23, 2025)
-
Skinner Talks Childhood Team With Toffoli, Has Got A Lot Left in the Tank for Sharks at San Jose Hockey Now (Mon Jul 14, 2025)
-
Analyzing Every Tom Fitzgerald Trade Pt. III; 2023-2024 at Devils Army (Tue Nov 19, 2024)
-
Grading The Devils Extremely Busy 2024 Trade Deadline at Devils Army (Sat Mar 9, 2024)
-
Deadline Day: Devils Most likely On The Move at Devils Army (Fri Mar 8, 2024)
-
Tyler Toffoli’s Hat Trick Leads Devils to 6-5 Thriller Over Vegas at Devils Army (Tue Jan 23, 2024)
-
Devils Continue Road Trip Against Flames at Devils Army (Fri Dec 8, 2023)
-
Devils Fall In A Struggle Against Colorado To Close Out Road Trip at Devils Army (Wed Nov 8, 2023)
-
Devils Cling On To 4-3 Win Over Wild In Newark at Devils Army (Mon Oct 30, 2023)
-
What The Betting Markets Think Of The 2023-24 New Jersey Devils at Devils Army (Thu Sep 21, 2023)
-
Analyzing The Devils’ Terrific Trade For Tyler Toffoli at Devils Army (Wed Jun 28, 2023)
Current Contract
Tyler Toffoli signed a $24,000,000 4-year contract with the San Jose Sharks and General Manager Mike Grier on July 1, 2024 with an AAV of $6,000,000. This contract will start in 2024-25 and end after the 2027-28 season. In the first season of the contract the cap hit was equivalent to 6.82% of the salary cap.
Standard Contract (UFA) ( ) (0 ratings)
Tyler Toffoli signed a $17,000,000 4-year contract with the Montreal Canadiens and General Manager Marc Bergevin on October 12, 2020 with an AAV of $4,250,000. This contract will start in 2020-21 and end after the 2023-24 season. In the first season of the contract the cap hit was equivalent to 5.21% of the salary cap.
Standard Contract (UFA) ( ) (0 ratings)
| Season | Age* | Clause | Cap Hit | AAV | Perf. Bonus | Sign. Bonus | Salary | Compensation | Minors Salary | Status | |
|---|---|---|---|---|---|---|---|---|---|---|---|
| 2020-21 | 28 | $4,250,000 | $4,250,000 | - | - | $3,250,000 | $3,250,000 | $3,250,000 | UFA | ||
| 2021-22 | 29 | $4,250,000 | $4,250,000 | - | - | $5,125,000 | $5,125,000 | $5,125,000 | UFA | ||
| 2022-23 | 30 | $4,250,000 | $4,250,000 | - | - | $5,125,000 | $5,125,000 | $5,125,000 | UFA | ||
| 2023-24 | 31 | $4,250,000 | $4,250,000 | - | - | $3,500,000 | $3,500,000 | $3,500,000 | UFA | ||
| Total | - | - | $17,000,000 | $17,000,000 | $17,000,000 |
Tyler Toffoli signed a $13,800,000 3-year contract with the Los Angeles Kings and General Manager Rob Blake on June 7, 2017 with an AAV of $4,600,000. This contract will start in 2017-18 and end after the 2019-20 season. In the first season of the contract the cap hit was equivalent to 6.13% of the salary cap.
Standard Contract (RFA) ( ) (0 ratings)
| Season | Age* | Clause | Cap Hit | AAV | Perf. Bonus | Sign. Bonus | Salary | Compensation | Minors Salary | Status | |
|---|---|---|---|---|---|---|---|---|---|---|---|
| 2017-18 | 25 | $4,600,000 | $4,600,000 | - | $350,000 | $4,050,000 | $4,400,000 | $4,400,000 | RFA-arb | ||
| 2018-19 | 26 | $4,600,000 | $4,600,000 | - | - | $4,600,000 | $4,600,000 | $4,600,000 | RFA-arb | ||
| 2019-20 | 27 | $4,600,000 | $4,600,000 | - | - | $4,800,000 | $4,800,000 | $4,800,000 | UFA | ||
| Total | - | $350,000 | $13,450,000 | $13,800,000 | $13,800,000 |
Tyler Toffoli signed a $6,500,000 2-year contract with the Los Angeles Kings and General Manager Dean Lombardi on June 26, 2015 with an AAV of $3,250,000. This contract will start in 2015-16 and end after the 2016-17 season. In the first season of the contract the cap hit was equivalent to 4.55% of the salary cap.
Standard Contract (RFA) ( ) (0 ratings)
| Season | Age* | Clause | Cap Hit | AAV | Perf. Bonus | Sign. Bonus | Salary | Compensation | Minors Salary | Status | |
|---|---|---|---|---|---|---|---|---|---|---|---|
| 2015-16 | 23 | $3,250,000 | $3,250,000 | - | - | $2,600,000 | $2,600,000 | $2,600,000 | RFA | ||
| 2016-17 | 24 | $3,250,000 | $3,250,000 | - | - | $3,900,000 | $3,900,000 | $3,900,000 | RFA-arb | ||
| Total | - | - | $6,500,000 | $6,500,000 | $6,500,000 |
Tyler Toffoli signed a $2,240,000 3-year contract with the Los Angeles Kings and General Manager Dean Lombardi on April 18, 2011 with an AAV of $746,667. This contract will start in 2011-12 and end after the 2014-15 season. In the first season of the contract the cap hit was equivalent to 1.16% of the salary cap.
Entry Level Contract ( ) (0 ratings)
| Season | Age* | Clause | Cap Hit | AAV | Perf. Bonus | Sign. Bonus | Salary | Compensation | Minors Salary | Status | |
|---|---|---|---|---|---|---|---|---|---|---|---|
| 2011-12 | 19 | $746,667 | $900,000 | - | $90,000 | - | $90,000 | - | ELC | ||
| 2012-13 | 20 | $716,667 | $870,000 | $200,000 | $90,000 | $610,000 | $700,000 | $67,500 | ELC | ||
| 2013-14 | 21 | $716,667 | $870,000 | $135,000 | $90,000 | $675,000 | $765,000 | $67,500 | ELC | ||
| 2014-15 | 22 | $716,667 | $870,000 | $125,000 | - | $685,000 | $685,000 | $67,500 | ELC | ||
| Total | $460,000 | $270,000 | $1,970,000 | $2,240,000 | $202,500 |
Career Statistics
| Regular Season | Playoffs | |||||||||||||||||||
|---|---|---|---|---|---|---|---|---|---|---|---|---|---|---|---|---|---|---|---|---|
| Season | League | Team | GP | G | A | Pts | +/- | PIM | Shots | Sh% | TOI/G | GP | G | A | Pts | +/- | PIM | Shots | Sh% | TOI/G |
| 2007-08 | GTHL | Tor. Jr. Canadiens | 83 | 68 | 106 | 174 | 72 | |||||||||||||
| 2008-09 | OHL | Ottawa | 54 | 17 | 29 | 46 | 16 | 7 | 2 | 6 | 8 | +3 | 4 | |||||||
| 2009-10 | OHL | Ottawa | 65 | 37 | 42 | 79 | +25 | 54 | 12 | 7 | 6 | 13 | -2 | 10 | ||||||
| 2010-11 | AHL | Manchester | 1 | 1 | 0 | 1 | 4 | 2,500.0 | 5 | 1 | 1 | -2 | 6 | |||||||
| 2010-11 | OHL | Ottawa | 68 | 57 | 51 | 108 | +44 | 33 | 4 | 3 | 5 | 8 | -4 | 4 | ||||||
| 2011-12 | OHL | Ottawa | 65 | 52 | 48 | 100 | +31 | 22 | 18 | 11 | 7 | 18 | -4 | 21 | ||||||
| 2012-13 | AHL | Manchester | 58 | 28 | 23 | 51 | +20 | 18 | 178 | 1,573.0 | ||||||||||
| 2012-13 | NHL | Los Angeles Kings | 10 | 2 | 3 | 5 | +3 | 2 | 20 | 10.0 | 11:59 | 12 | 2 | 4 | 6 | +5 | 19 | 10.5 | 10:46 | |
| 2013-14 | AHL | Manchester | 18 | 15 | 8 | 23 | +5 | 4 | 63 | 2,380.0 | ||||||||||
| 2013-14 | NHL | Los Angeles Kings | 62 | 12 | 17 | 29 | +21 | 10 | 124 | 9.7 | 12:56 | 26 | 7 | 7 | 14 | +6 | 10 | 65 | 10.8 | 13:18 |
| 2014-15 | NHL | Los Angeles Kings | 76 | 23 | 26 | 49 | +25 | 37 | 200 | 11.5 | 14:35 | |||||||||
| 2014-15 | WC-A | Canada | 10 | 2 | 3 | 5 | +9 | 2 | 23 | |||||||||||
| 2015-16 | NHL | Los Angeles Kings | 82 | 31 | 27 | 58 | +35 | 20 | 213 | 14.6 | 17:19 | 5 | 1 | 1 | -5 | 2 | 9 | 0.0 | 16:43 | |
| 2016-17 | NHL | Los Angeles Kings | 63 | 16 | 18 | 34 | +6 | 22 | 165 | 9.7 | 16:35 | |||||||||
| 2017-18 | NHL | Los Angeles Kings | 82 | 24 | 23 | 47 | +9 | 16 | 251 | 9.6 | 16:07 | 4 | -1 | 17 | 0.0 | 18:06 | ||||
| 2018-19 | NHL | Los Angeles Kings | 82 | 13 | 21 | 34 | -16 | 23 | 226 | 5.8 | 17:13 | |||||||||
| 2019-20 | NHL | Los Angeles Kings | 58 | 18 | 16 | 34 | -4 | 16 | 165 | 10.9 | 16:37 | |||||||||
| 2019-20 | NHL | Vancouver Canucks | 10 | 6 | 4 | 10 | +3 | 4 | 38 | 15.8 | 18:15 | 7 | 2 | 2 | 4 | -4 | 11 | 18.2 | 15:46 | |
| 2020-21 | NHL | Montréal Canadiens | 52 | 28 | 16 | 44 | 24 | 158 | 17.7 | 17:31 | 22 | 5 | 9 | 14 | -6 | 6 | 49 | 10.2 | 17:48 | |
| 2021-22 | NHL | Montréal Canadiens | 37 | 9 | 17 | 26 | -8 | 4 | 100 | 9.0 | 17:31 | |||||||||
| 2021-22 | NHL | Calgary Flames | 37 | 11 | 12 | 23 | +3 | 10 | 95 | 11.6 | 15:05 | 12 | 2 | 3 | 5 | -6 | 6 | 33 | 6.1 | 16:25 |
| 2022-23 | NHL | Calgary Flames | 82 | 34 | 39 | 73 | +16 | 28 | 268 | 12.7 | 16:37 | |||||||||
| 2023-24 | NHL | New Jersey Devils | 61 | 26 | 18 | 44 | -15 | 12 | 179 | 14.5 | 17:32 | |||||||||
| 2023-24 | NHL | Winnipeg Jets | 18 | 7 | 4 | 11 | +9 | 2 | 50 | 14.0 | 15:01 | 5 | 2 | 2 | -2 | 8 | 25.0 | 14:05 | ||
| 2024-25 | NHL | San Jose Sharks | 78 | 30 | 24 | 54 | -21 | 14 | 233 | 12.9 | 16:56 | |||||||||
| 2025-26 | NHL | San Jose Sharks | 79 | 19 | 30 | 49 | -12 | 10 | 172 | 11.0 | 14:58 | |||||||||
| NHL Career | 969 | 309 | 315 | 624 | +54 | 254 | 2657 | 11.6 | 16:12 | 93 | 20 | 26 | 46 | -13 | 24 | 211 | 9.5 | 15:03 | ||