
 Rasmus Sandin
| Position | Left Defense | Current Team | Washington Capitals |
| Shoots | Left | Current Contract | 5 years ($4.6M CapHit) |
| Height | 5'11" | Expires | 2028-29 |
| Weight (lbs) | 189 | Expiry Age (Jun 30) | 29 |
| Age (DOB) | 26 (Mar 7, 2000) | Expiry Status | UFA |
| Drafted | 2018, Round 1, Overall 29 (TOR) |
| Date | Team | Transaction | |
|---|---|---|---|
| Nov 5, 2025 | Washington Capitals | Activated from IR | |
| Oct 27, 2025 | Washington Capitals | Placed on IR | |
| Mar 6, 2024 | Washington Capitals | Signed 5 years @ $4.600M AAV starting in 2024-25 | |
| Sep 29, 2022 | Toronto Maple Leafs | Signed 2 years @ $1.400M AAV starting in 2022-23 | |
| Jul 15, 2018 | Toronto Maple Leafs | Signed to an entry level contract. |
Player Card(s)
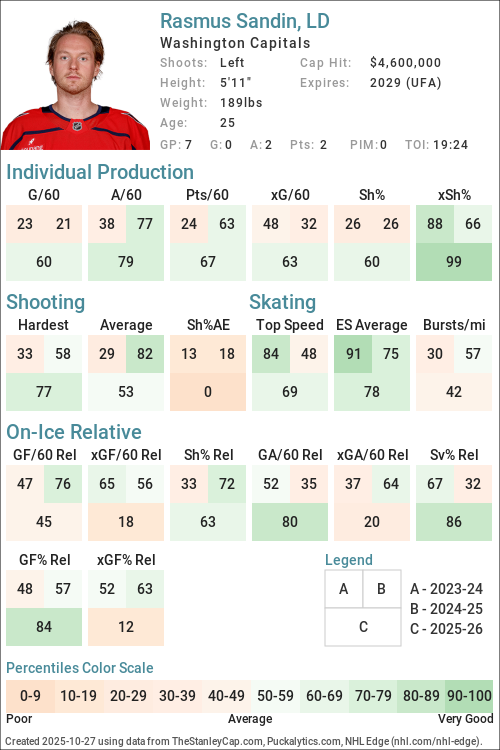
URL: https://thestanleycap.com/cdn/player_cards/20252026/rasmus-sandin-8480873.png
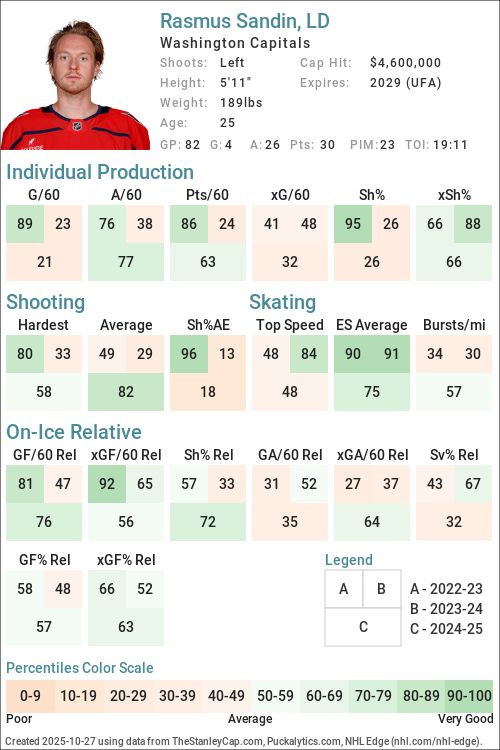
URL: https://thestanleycap.com/cdn/player_cards/20242025/rasmus-sandin-8480873.png
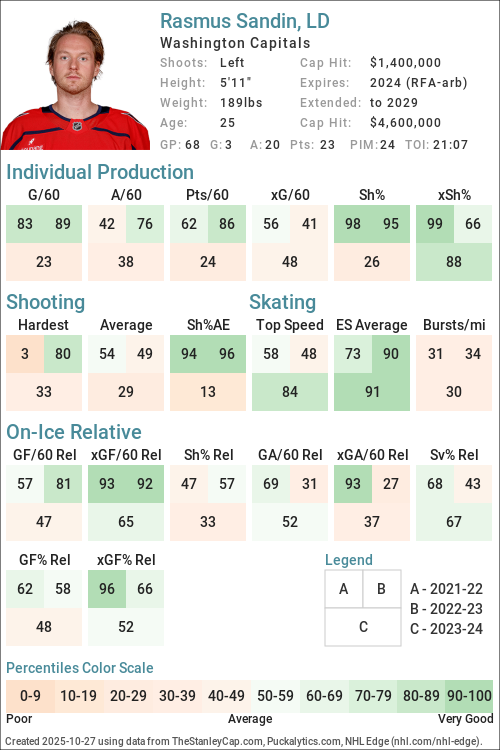
URL: https://thestanleycap.com/cdn/player_cards/20232024/rasmus-sandin-8480873.png
About Player Cards
Player cards present an infographic of a players performance using a series of Player Archetypes developed for Puckalytics.com and TheStanleyCap.com. The boxes in the rink image show the archetype ratings for the season specified in the card while the graphs to the right show the five-year trends for those archetypes.
Except for Faceoffs, the values shown are the players z-score (standard deviation from the mean) for the specific metric used to calculate the archetype values. When calculating z-scores forwards were compared to forwards and defensemen were compared to defensemen. Positive values indicate the player is above average and shaded in blue, while negative values indicate the player is below average and shaded in pink. The five year trend charts show a range of -4.0 to 4.0.
The value shown for Faceoffs is the faceoff winning percentage rather than their z-score with winning percentages below 50 in pink shades and above 50 in blue shades.
All archetypes are 5v5 except 5v4 TOI, 4v5 TOI, Skating (even strength) and Faceoffs (all situations). Archetypes use regular season data only.
Archetypes Summary
- Sniper - Measures the to score above the expected goal rate.
- Rebound - Measures the percent of a players shot attempts that come from rebounds (forwards only).
- 5v4 TOI - Powerplay ice time, calculated as the percentage of his teams 5v4 ice time that the player was on the ice for.
- Shooter - Measures whether a players points come from shots (goals or assists on rebounds from his shots).
- Producer - Measures a players ability to produce goals and assists, adjusted for quality of teammates.
- Playmaker - Measures whether a players points come from passes.
- Drive - Measures a players ability to drive puck possession and generate shot attempts for his team.
- Rush - Measures the percent of a players shot attempts that come from rush plays
- Possession - An indicator of a players ability to improve his teams puck possession game.
- Faceoffs - Faceoff Winning Percentage (min. 75 faceoffs taken).
- 5v5 TOI - The percentage of his teams 5v5 TOI that the player was on the ice for.
- Suppress - Measures a players ability to suppress opponent puck possession and shot attempts against.
- Skating - An indicator of a players skating ability, or speed bursts above 20mph per mile skated.
- Defend - An indicator of a players ability to suppress shot quality against.
- 4v5 TOI - Penalty Kill ice time, calculated as the percentage of his teams 4v5 ice time that the player was on the ice for.
Data Sources
- Salary data is from TheStanleyCap.com
- Skating data is from NHL Edge
- Other statistics are from Puckalytics.com and derived from data from NHL.com
Terms of Use
You are free to use include player cards in written articles, share on social media, or on other public websites under the following conditions:
- You credit TheStanleyCap.com as the source and provide a link back to TheStanleyCap.com or this player page.
- You do not mass copy/duplicate/publish dozens or hundreds of player cards. A few, or a handful for a written article is fine. Be reasonable. Fair use rules apply.
- If you are a high-traffic website you must download and host the image(s) on your site rather than overload TheStanleyCap servers with traffic.
Note: Player cards will update daily throughout the season so if you want to include snapshot then you must download the image.
If you have any questions, send an e-mail to the e-mail address at the top of this page.
Read Introducing Player Archetypes on HockeyAnalysis.com for more details on archetype calculations.
Core Archetypes
| Season | Team(s) | GP | TOI | Producer | Playmaker | Shooter | Sniper | Rebound | Rush | Skating | Defend |
|---|---|---|---|---|---|---|---|---|---|---|---|
| 2019-20 | TOR | 28 | 1.11 | 1.22 | 0.00 | 0.65 | - | 2.34 | - | -1.69 | |
| 2020-21 | TOR | 9 | 1.76 | 4.05 | -0.83 | -1.78 | - | 11.02 | - | 1.95 | |
| 2021-22 | TOR | 51 | -0.10 | -0.32 | 0.16 | 1.66 | - | 0.69 | -0.68 | 0.47 | |
| 2022-23 | TOR, WSH | 71 | 0.72 | 0.43 | 0.69 | 2.20 | - | 0.06 | -0.55 | -0.09 | |
| 2023-24 | WSH | 68 | -0.62 | -0.28 | -0.78 | -1.12 | - | -1.10 | -0.62 | 0.38 | |
| 2024-25 | WSH | 82 | -0.27 | 0.06 | -0.68 | -1.00 | - | -0.68 | -0.04 | -0.41 | |
| 2025-26 | WSH | 73 | 1.80 | 2.30 | 0.07 | 0.10 | - | 0.32 | 0.33 | -1.56 |
Situational and Secondary Archetypes
| Season | Team(s) | GP | TOI | 5v5 TOI | 5v4 TOI | 4v5 TOI | Possession | Drive | Suppress | Faceoffs |
|---|---|---|---|---|---|---|---|---|---|---|
| 2019-20 | TOR | 28 | -1.80 | -1.04 | -1.89 | 0.23 | -0.10 | 0.45 | - | |
| 2020-21 | TOR | 9 | -1.88 | 0.14 | -2.31 | 0.66 | 0.62 | 0.23 | - | |
| 2021-22 | TOR | 51 | -0.75 | -0.07 | -2.18 | 0.78 | 0.60 | 0.65 | - | |
| 2022-23 | TOR, WSH | 71 | 0.13 | 0.35 | -2.07 | 0.44 | 1.10 | -0.51 | - | |
| 2023-24 | WSH | 68 | 1.17 | -0.19 | -1.90 | 0.05 | 0.20 | -0.18 | - | |
| 2024-25 | WSH | 82 | 0.33 | -0.66 | -1.33 | 0.15 | -0.06 | 0.30 | - | |
| 2025-26 | WSH | 73 | -0.03 | -0.71 | -0.38 | -0.65 | -0.92 | -0.02 | - |
5v5 Individual Stats
| Season | Team(s) | GP | TOI | G/60 | A/60 | Pts/60 | xG/60 | GAE/60 | Sh% | xSh% | Sh%AE | %SA Rush | %SA Reb. |
|---|---|---|---|---|---|---|---|---|---|---|---|---|---|
| 2019-20 | TOR | 28 | 355:59 | 0.17 | 0.84 | 1.01 | 0.12 | 0.04 | 5.56 | 4.10 | 1.45 | 3.57 | 10.71 |
| 2020-21 | TOR | 9 | 111:18 | 0.00 | 1.62 | 1.62 | 0.17 | -0.17 | 0.00 | 4.43 | -4.43 | 14.29 | 0.00 |
| 2021-22 | TOR | 51 | 759:35 | 0.32 | 0.63 | 0.95 | 0.20 | 0.12 | 10.81 | 6.84 | 3.97 | 1.67 | 1.67 |
| 2022-23 | WSH | 19 | 347:46 | 0.52 | 1.38 | 1.90 | 0.13 | 0.39 | 16.67 | 4.16 | 12.50 | 0.00 | 8.00 |
| 2022-23 | TOR | 52 | 799:27 | 0.30 | 0.60 | 0.90 | 0.19 | 0.11 | 7.55 | 4.88 | 2.67 | 1.43 | 2.86 |
| 2022-23 | TOR, WSH | 71 | 1147:13 | 0.37 | 0.84 | 1.20 | 0.17 | 0.19 | 9.86 | 4.70 | 5.16 | 1.05 | 4.21 |
| 2023-24 | WSH | 68 | 1241:55 | 0.10 | 0.58 | 0.68 | 0.18 | -0.08 | 2.99 | 5.43 | -2.44 | 0.00 | 6.32 |
| 2024-25 | WSH | 82 | 1392:01 | 0.09 | 0.82 | 0.91 | 0.16 | -0.07 | 2.78 | 5.13 | -2.35 | 0.00 | 1.53 |
| 2025-26 | WSH | 73 | 1163:18 | 0.26 | 1.08 | 1.34 | 0.23 | 0.02 | 6.25 | 5.66 | 0.59 | 0.83 | 0.83 |
5v5 On Ice Stats
| Season | Team(s) | GP | TOI | SAF/60 | GF/60 | xGF/60 | SAA/60 | GA/60 | xGA/60 | GF% | xGF% | xGF Rel | xGA Rel | xGF% Rel |
|---|---|---|---|---|---|---|---|---|---|---|---|---|---|---|
| 2019-20 | TOR | 28 | 355:59 | 43.82 | 2.02 | 2.48 | 40.45 | 3.54 | 2.71 | 36.36 | 47.77 | -0.41 | 0.30 | -6.80 |
| 2020-21 | TOR | 9 | 111:18 | 40.97 | 4.31 | 2.50 | 36.12 | 1.08 | 2.09 | 80.00 | 54.44 | -0.11 | -0.04 | -0.55 |
| 2021-22 | TOR | 51 | 759:35 | 47.08 | 3.00 | 3.20 | 40.36 | 2.45 | 2.36 | 55.07 | 57.54 | 0.37 | -0.18 | 4.88 |
| 2022-23 | WSH | 19 | 347:46 | 41.75 | 3.80 | 2.67 | 50.21 | 3.97 | 3.50 | 48.89 | 43.28 | 0.35 | 0.48 | -0.19 |
| 2022-23 | TOR | 52 | 799:27 | 46.61 | 2.85 | 3.38 | 39.85 | 1.80 | 2.39 | 61.29 | 58.55 | 0.53 | -0.06 | 4.83 |
| 2022-23 | TOR, WSH | 71 | 1147:13 | 45.14 | 3.14 | 3.17 | 42.99 | 2.46 | 2.73 | 56.07 | 53.70 | 0.45 | 0.14 | 2.55 |
| 2023-24 | WSH | 68 | 1241:55 | 38.02 | 2.13 | 2.35 | 43.96 | 2.75 | 2.62 | 43.56 | 47.33 | 0.08 | 0.09 | -0.04 |
| 2024-25 | WSH | 82 | 1392:01 | 41.25 | 3.06 | 2.68 | 38.66 | 2.50 | 2.41 | 55.04 | 52.74 | 0.18 | -0.07 | 2.42 |
| 2025-26 | WSH | 73 | 1163:18 | 38.99 | 2.48 | 2.56 | 40.49 | 2.63 | 2.54 | 48.48 | 50.18 | -0.31 | -0.22 | -0.83 |
NHL Edge Stats
| Skating | Shooting | Zone Time | |||||||||||
|---|---|---|---|---|---|---|---|---|---|---|---|---|---|
| Season | GP | Top Speed | Bursts>20/mi | Avg. Speed | Top Speed | Avg. Speed | %Long Range | %Mid Range | %High Danger | ES DZ% | ES NZ% | ES OZ% | |
| This table is for Basic and Premium subscribers only. To view please login to and/or subscribe to one of our subscription plans. | |||||||||||||
Legend
| Percentile 0-25 | Percentile 25-50 | Percentile 50-75 | Percentile 75-100 |
5v5 Defense Pairs
| Season | Teammate | Team | TOI | GF/60 | GA/60 | GF% | xGF/60 | xGA/60 | xGF% | xGF Rel | xGA Rel | xGF% Rel |
|---|
Glossary
| Type | Statistic | Definition |
|---|---|---|
| Individual | G/60 | Goals Against per 60 minutes. |
| Individual | A/60 | Assists per 60 minutes. |
| Individual | Pts/60 | Points per 60 minutes. |
| Individual | xG/60 | Expected Goals per 60 minutes. |
| Individual | GAE/60 | Goals Above Expected (G/60 - xG/60). |
| Individual | Sh% | Shooting Percentage. |
| Individual | xSh% | Expected Shooting Percentage. |
| Individual | Sh%AE | Shooting percentage above expected (Sh% - xSh%). |
| Individual | %SA Rush | Percentage of shot attempts determined to be on the rush. |
| Individual | %SA Reb. | Percentage of shot attempts determined to be from rebounds. |
| On Ice | SAF/60 | Shot Attempts For per 60 minutes. |
| On Ice | GF/60 | Goals For per 60 minutes. |
| On Ice | xGF/60 | Expected Goals For per 60 minutes. |
| On Ice | SAA/60 | Shot Attempts Against per 60 minutes (lower is better). |
| On Ice | GA/60 | Goals Against per 60 minutes (lower is better). |
| On Ice | xGA/60 | Expected Goals Against per 60 minutes (lower is better). |
| On Ice | GF% | Goals For Percentage = Goals For / (Goals For + Goals Against) |
| On Ice | xGF% | Expected Goals For Percentage = Expected Goals For / (Expected Goals For + Expected Goals Against) |
| On Ice | xGF Rel | xGF/60 when On Ice - xGF/60 when not On Ice. |
| On Ice | xGA Rel | xGA/60 when On Ice - xGA/60 when not On Ice (lower is better). |
| On Ice | xGF% Rel | xGF% when On Ice - xGF% when not On Ice. |
News and Opinions
-
Capitals to explore free-agent defenseman options due to Rasmus Sandin injury at Russian Machine Never Breaks (Fri Jun 26, 2026)
-
Rasmus Sandin: 2025-26 season review at Russian Machine Never Breaks (Tue Jun 9, 2026)
-
Maple Leafs News and Rumours: Liljegren, Sandin, Treliving’s Blame, Rielly & Nurse Trade at The Hockey Writers (Thu May 21, 2026)
-
Rasmus Sandin’s Knee Injury Expected To Alter Capitals’ 2026 Offseason Plans at The Hockey Writers (Thu Apr 23, 2026)
-
Rasmus Sandin undergoes surgery to repair ACL tear in right knee, will be out 6 to 9 months at Russian Machine Never Breaks (Wed Apr 22, 2026)
-
Sandin Injury Ups the Ante for Washington's Summer Plans at Stars and Sticks (Tue Apr 21, 2026)
-
Rasmus Sandin’s knee injury will cause him to miss start of next season and impact the Capitals’ offseason plans at Russian Machine Never Breaks (Mon Apr 20, 2026)
-
Rasmus Sandin potentially suffered significant injury to knee, still waiting for final test results: ‘I think it’ll be quite a bit of rehab over the summer’ at Russian Machine Never Breaks (Thu Apr 16, 2026)
-
Pierre-Luc Dubois and Rasmus Sandin listed as game-time decisions, Logan Thompson to start for Capitals at Russian Machine Never Breaks (Sun Apr 12, 2026)
-
Rasmus Sandin leaves Penguins game in serious pain after Justin Brazeau hip check at Russian Machine Never Breaks (Sat Apr 11, 2026)
-
Bruins beat Caps 3-2 in soul-destroying shootout at Russian Machine Never Breaks (Sat Mar 14, 2026)
-
Timothy Liljegren immediately texted Rasmus Sandin after being traded to Capitals: ‘We had a lot of fun years together in Toronto. He was pumped.’ at Russian Machine Never Breaks (Sun Mar 8, 2026)
-
Tom Wilson and Rasmus Sandin miss Capitals game against Rangers at Russian Machine Never Breaks (Tue Dec 23, 2025)
-
Capitals sing ‘We want you, baby’ at Spencer Carbery and Rasmus Sandin after beating Toronto Maple Leafs at Russian Machine Never Breaks (Sat Nov 29, 2025)
-
Rasmus Sandin will make return from injury against Blues after missing five games at Russian Machine Never Breaks (Wed Nov 5, 2025)
-
Rasmus Sandin is full participant in Capitals practice ahead of game against St. Louis Blues at Russian Machine Never Breaks (Mon Nov 3, 2025)
-
Spencer Carbery offers latest injury updates on Dylan Strome and Rasmus Sandin at Russian Machine Never Breaks (Fri Oct 31, 2025)
-
Rasmus Sandin placed on injured reserve by Washington Capitals at Russian Machine Never Breaks (Mon Oct 27, 2025)
-
Pierre-Luc Dubois and Rasmus Sandin will not play for Capitals against Blue Jackets at Russian Machine Never Breaks (Fri Oct 24, 2025)
-
Rasmus Sandin misses Capitals practice due to upper-body injury at Russian Machine Never Breaks (Thu Oct 23, 2025)
-
John Carlson needed Rasmus Sandin’s help to watch Nicklas Backstrom’s SHL games: ‘John’s called me about 65 times this summer trying to get my logins’ at Russian Machine Never Breaks (Sat Sep 20, 2025)
-
Alex Ovechkin and Rasmus Sandin play some house hockey at Russian Machine Never Breaks (Sat Sep 13, 2025)
-
Rasmus Sandin on playoff bench brawl between Capitals and Canadiens: ‘That’s what made the series a little bit extra fun’ at Russian Machine Never Breaks (Mon Aug 25, 2025)
-
Rasmus Sandin shares details behind Hublot watches Alex Ovechkin gifted players and staff after breaking NHL goals record at Russian Machine Never Breaks (Sat Aug 23, 2025)
-
Alex Ovechkin gave Rasmus Sandin a stick the day he broke the NHL goals record: ‘I asked for it pretty quick’ at Russian Machine Never Breaks (Sat Aug 23, 2025)
Current Contract
Rasmus Sandin signed a $20,300,000 5-year contract with the Washington Capitals and General Manager Brian MacLellan on March 6, 2024 with an AAV of $4,600,000. This contract will start in 2024-25 and end after the 2028-29 season. In the first season of the contract the cap hit was equivalent to 5.23% of the salary cap.
Standard Contract (RFA) ( ) (0 ratings)
Rasmus Sandin signed a $2,800,000 2-year contract with the Toronto Maple Leafs and General Manager Kyle Dubas on September 29, 2022 with an AAV of $1,400,000. This contract will start in 2022-23 and end after the 2023-24 season. In the first season of the contract the cap hit was equivalent to 1.70% of the salary cap.
Standard Contract (RFA) ( ) (0 ratings)
| Season | Age* | Clause | Cap Hit | AAV | Perf. Bonus | Sign. Bonus | Salary | Compensation | Minors Salary | Status | |
|---|---|---|---|---|---|---|---|---|---|---|---|
| 2022-23 | 22 | $1,400,000 | $1,400,000 | - | $450,000 | $750,000 | $1,200,000 | $1,200,000 | RFA | ||
| 2023-24 | 23 | $1,400,000 | $1,400,000 | - | - | $1,600,000 | $1,600,000 | $1,600,000 | RFA-arb | ||
| Total | - | $450,000 | $2,350,000 | $2,800,000 | $2,800,000 |
Rasmus Sandin signed a $2,775,000 3-year contract with the Toronto Maple Leafs and General Manager Kyle Dubas on July 15, 2018 with an AAV of $925,000. This contract will start in 2018-19 and end after the 2021-22 season. In the first season of the contract the cap hit was equivalent to 1.16% of the salary cap.
Entry Level Contract ( ) (0 ratings)
| Season | Age* | Clause | Cap Hit | AAV | Perf. Bonus | Sign. Bonus | Salary | Compensation | Minors Salary | Status | |
|---|---|---|---|---|---|---|---|---|---|---|---|
| 2018-19 | 18 | $925,000 | $925,000 | - | $92,500 | - | $92,500 | - | ELC | ||
| 2019-20 | 19 | $894,167 | $894,167 | - | $92,500 | $832,500 | $925,000 | $70,000 | ELC | ||
| 2020-21 | 20 | $894,167 | $894,167 | - | $92,500 | $832,500 | $925,000 | $70,000 | ELC | ||
| 2021-22 | 21 | $894,167 | $894,167 | - | - | $832,500 | $832,500 | $70,000 | ELC | ||
| Total | - | $277,500 | $2,497,500 | $2,775,000 | $210,000 |
Career Statistics
| Regular Season | Playoffs | |||||||||||||||||||
|---|---|---|---|---|---|---|---|---|---|---|---|---|---|---|---|---|---|---|---|---|
| Season | League | Team | GP | G | A | Pts | +/- | PIM | Shots | Sh% | TOI/G | GP | G | A | Pts | +/- | PIM | Shots | Sh% | TOI/G |
| 2012-13 | WSI U13 | Sweden Selects U13 | 9 | 2 | 1 | 3 | 2 | 9 | 2 | 1 | 3 | 2 | ||||||||
| 2013-14 | U16 Elit | MODO Hockey U16 | 11 | 4 | 3 | 7 | 6 | |||||||||||||
| 2014-15 | U16 Div.1 | Almtuna IS U16 | 14 | 7 | 15 | 22 | 16 | |||||||||||||
| 2014-15 | U16 Elit | MODO Hockey U16 | 11 | 5 | 11 | 16 | 6 | |||||||||||||
| 2014-15 | J18 Allsvenskan | Almtuna IS J18 | 10 | 0 | 3 | 3 | -2 | 4 | ||||||||||||
| 2014-15 | J18 Elit | MODO Hockey J18 | 6 | 1 | 3 | 4 | +7 | |||||||||||||
| 2014-15 | U16 Div.1 | Almtuna IS U16 2 | 1 | 0 | 1 | 1 | ||||||||||||||
| 2014-15 | WSI U15 | Sweden Selects U15 | 7 | 1 | 1 | 4 | ||||||||||||||
| 2014-15 | TV-Pucken | Ångermanland | 6 | 1 | 3 | 4 | 18 | |||||||||||||
| 2015-16 | J18 Region | MoDo Hockey J18 | 20 | 5 | 17 | 22 | +24 | 6 | ||||||||||||
| 2015-16 | TV-Pucken | Ångermanland | 6 | 1 | 4 | 5 | ||||||||||||||
| 2015-16 | U16 SM | Brynäs IF U16 | 3 | 0 | 4 | 4 | 2 | |||||||||||||
| 2015-16 | J18 Nationell | Brynäs IF J18 | 18 | 1 | 7 | 8 | +1 | 2 | 5 | 1 | 2 | 3 | +1 | 6 | ||||||
| 2016-17 | J18 Elit | Brynäs IF J18 | 7 | 2 | 5 | 7 | 2 | |||||||||||||
| 2016-17 | WHC-17 | Sweden U17 | 6 | 0 | 2 | 2 | 2 | |||||||||||||
| 2016-17 | J18 Allsvenskan | Brynäs IF J18 | 2 | -5 | 12 | |||||||||||||||
| 2016-17 | J20 SuperElit | Brynäs IF J20 | 36 | 3 | 15 | 18 | -8 | 14 | 2 | 1 | 1 | -5 | 2 | |||||||
| 2017-18 | SHL | Rögle BK | 5 | 0 | 1 | 1 | -2 | |||||||||||||
| 2017-18 | Ivan Hlinka Memorial | Sweden U18 | 5 | 0 | 3 | 3 | 2 | |||||||||||||
| 2017-18 | OHL | Soo Greyhounds | 51 | 12 | 33 | 45 | +35 | 24 | 24 | 1 | 12 | 13 | +1 | 8 | ||||||
| 2018-19 | WJC-20 | Sweden U20 | 5 | 2 | 2 | 4 | +4 | 4 | ||||||||||||
| 2018-19 | AHL | Toronto Marlies | 44 | 6 | 22 | 28 | -10 | 16 | 13 | 10 | 10 | -3 | 6 | |||||||
| 2019-20 | NHL | Toronto Maple Leafs | 28 | 1 | 7 | 8 | -7 | 10 | 22 | 4.5 | 14:19 | |||||||||
| 2019-20 | AHL | Toronto Marlies | 21 | 2 | 13 | 15 | -2 | 17 | ||||||||||||
| 2019-20 | WJC-20 | Sweden U20 | 7 | 3 | 7 | 10 | +3 | 6 | ||||||||||||
| 2020-21 | AHL | Toronto Marlies | 1 | 0 | 0 | 0 | +1 | |||||||||||||
| 2020-21 | NHL | Toronto Maple Leafs | 9 | 0 | 4 | 4 | +6 | 9 | 0.0 | 14:40 | 5 | 1 | 1 | -3 | 4 | 25.0 | 13:13 | |||
| 2021-22 | NHL | Toronto Maple Leafs | 51 | 5 | 11 | 16 | +9 | 4 | 46 | 10.9 | 16:58 | |||||||||
| 2022-23 | NHL | Toronto Maple Leafs | 52 | 4 | 16 | 20 | +10 | 23 | 58 | 6.9 | 17:59 | |||||||||
| 2022-23 | NHL | Washington Capitals | 19 | 3 | 12 | 15 | -7 | 16 | 23 | 13.0 | 22:59 | |||||||||
| 2023-24 | NHL | Washington Capitals | 68 | 3 | 20 | 23 | -13 | 24 | 79 | 3.8 | 21:07 | 1 | 2 | 0.0 | 20:44 | |||||
| 2024-25 | WC | Sweden | 4 | 0 | 3 | 3 | +1 | |||||||||||||
| 2024-25 | NHL | Washington Capitals | 82 | 4 | 26 | 30 | +13 | 23 | 78 | 5.1 | 19:11 | 10 | 1 | 1 | -1 | 12 | 0.0 | 21:18 | ||
| 2025-26 | NHL | Washington Capitals | 73 | 5 | 24 | 29 | +4 | 12 | 90 | 5.6 | 19:12 | |||||||||
| NHL Career | 382 | 25 | 120 | 145 | +15 | 112 | 405 | 6.2 | 18:48 | 16 | 1 | 1 | 2 | -4 | 2 | 16 | 6.2 | 18:44 | ||