If you enjoy TheStanleyCap.com and want to keep it ad-free and support future growth please consider subscribing or making a donation.
Your support is greatly appreciated.
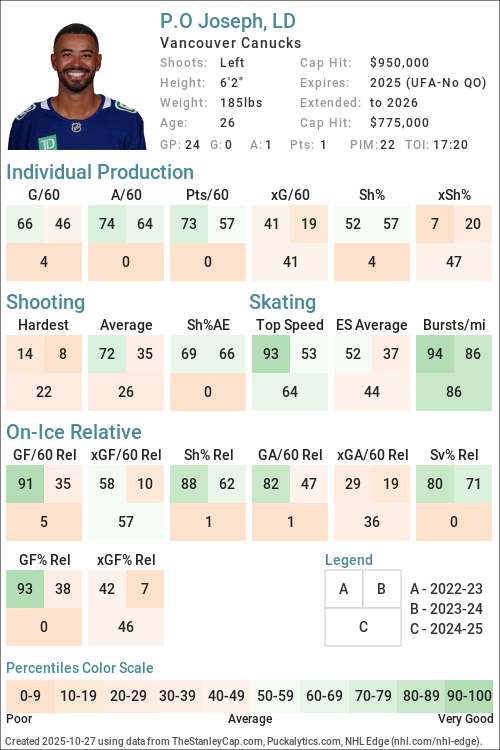
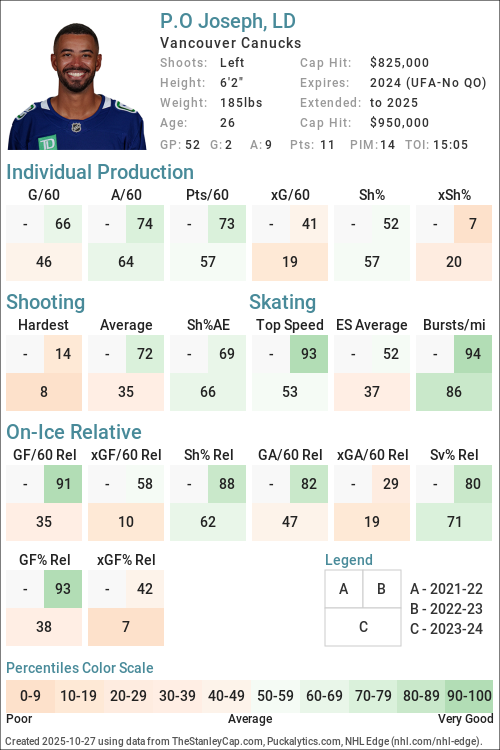
Player cards present an infographic of a players performance. In this case it shows the player performance over a 3 season span.
Each square is separated into three separate sub-boxes with the two smaller boxes on top representing the past two seasons and the larger
box on the bottom representing the current or most recent season. This allows the reader to guage how consistent a player has been, and
if early in the season it can help identify whether a players performance may be impacted by small sample size and subject to regression
or is consistent with recent past performance.
Notes and Definitions
The numbers represent percentiles so the higher the better.
Percentiles are determined by comparing Forwards to Forwards and Defensemen to Defensemen.
Bursts/mi are calculated from NHL Edge Data are are speed bursts above 20mpg per mile skated. The NHL doesn't adjust
for ice time so the players that skate more will naturally have more bursts over 20, or at least more opportunity to have more.
The NHL also does not provide ice time in the context of NHL Edge Statistics, however, it does provide distance skated. By adjusting
for distance skated it will have a similar effect to adjusting for ice time but also adjust for situationional effect. For example,
Players don't typically skate as much on the PK, mostly within the defensive zone, so don't get significant opportunity in that ice
time to get speed bursts above 20mph. Adjusting with miles skates would account for this better than adjusting with ice time.
Sh%AE is Shooting Percentage above Expected (Sh% - xSh%) and is an indicator of how good a shooter is at converting chances into goals.
Relative statistics are On Ice - Off Ice statistics and can be an indicator of whether the player makes his teammates better or worse.
All data is 5v5 except Shooting Hardest and Average, Skating Top Speed and Bursts/mi which are all situations, ES Average which is even strength (NHL doesn't give a specific definition).
You are free to use include player cards in written articles, share on social media, or on other public websites under the following conditions:
You credit TheStanleyCap.com as the source and provide a link back to TheStanleyCap.com or this player page.
You do not mass copy/duplicate/publish dozens or hundreds of player cards. A few, or a handful for a written article is fine. Be reasonable. Fair use rules apply.
If you are a high-traffic website you must download and host the image(s) on your site rather than overload TheStanleyCap servers with traffic.
Note: The image will update daily throughout the season so if you want to include snapshot then you must download the image.
If you have any questions, send an e-mail to the e-mail address at the top of this page.
5v5 Individual Stats
Season
Team(s)
GP
TOI
G/60
A/60
Pts/60
xG/60
GAE/60
Sh%
xSh%
Sh%AE
%SA Rush
%SA Reb.
2020-21
PIT
16
247:01
0.24
0.73
0.97
0.21
0.03
4.00
3.42
0.58
0.00
2.78
2021-22
PIT
4
68:52
0.00
0.00
0.00
0.31
-0.31
0.00
5.16
-5.16
0.00
0.00
2022-23
PIT
75
1027:31
0.23
0.82
1.05
0.18
0.05
4.26
3.34
0.91
0.82
2.46
2023-24
PIT
52
729:35
0.16
0.74
0.90
0.11
0.05
4.76
3.29
1.47
1.69
0.00
2024-25
STL
23
277:00
0.00
0.43
0.43
0.18
-0.18
0.00
3.99
-3.99
8.00
0.00
2024-25
PIT
24
368:07
0.00
0.00
0.00
0.13
-0.13
0.00
4.38
-4.38
0.00
3.12
2024-25
PIT, STL
47
645:07
0.00
0.19
0.19
0.15
-0.15
0.00
4.17
-4.17
3.51
1.75
2025-26
VAN
12
126:08
0.00
0.48
0.48
0.16
-0.16
0.00
3.35
-3.35
0.00
0.00
5v5 On Ice Stats
Season
Team(s)
GP
TOI
SAF/60
GF/60
xGF/60
SAA/60
GA/60
xGA/60
GF%
xGF%
xGF Rel
xGA Rel
xGF% Rel
2020-21
PIT
16
247:01
43.24
2.19
2.51
37.16
2.19
2.61
50.00
48.97
0.33
0.28
0.66
2021-22
PIT
4
68:52
47.92
1.74
3.01
30.49
2.61
2.01
40.00
59.95
-0.47
-0.86
5.20
2022-23
PIT
75
1027:31
47.36
3.09
3.01
43.39
2.34
2.82
56.99
51.66
0.02
0.17
-1.34
2023-24
PIT
52
729:35
42.44
2.63
2.44
45.56
2.96
2.75
47.06
47.03
-0.31
0.19
-4.84
2024-25
STL
23
277:00
36.17
2.17
2.06
42.02
3.68
2.62
37.04
43.99
0.03
0.26
-2.16
2024-25
PIT
24
368:07
39.44
0.82
2.23
36.51
3.42
2.23
19.23
49.99
-0.06
-0.02
-0.39
2024-25
PIT, STL
47
645:07
38.04
1.40
2.16
38.88
3.53
2.40
28.30
47.34
0.00
0.09
-0.90
2025-26
VAN
12
126:08
42.34
1.43
2.12
39.96
4.28
2.34
25.00
47.44
-0.07
-0.66
5.35
NHL Edge Stats
Skating
Shooting
Zone Time
Season
GP
Top Speed
Bursts>20/mi
Avg. Speed
ES Avg. Speed
Top Speed
Avg. Speed
%Long Range
%Mid Range
%High Danger
ES DZ%
ES NZ%
ES OZ%
This table is for Basic and Premium subscribers only.
To view please login to and/or subscribe to one of our subscription plans.
Legend
Percentile 0-25
Percentile 25-50
Percentile 50-75
Percentile 75-100
Forwards are compared with forwards and Defensemen are are compared with Defensemen.
5v5 Defense Pairs
Season
Season
Teammate
Team
TOI
GF/60
GA/60
GF%
xGF/60
xGA/60
xGF%
xGF Rel
xGA Rel
xGF% Rel
This table is for Basic and Premium subscribers only.
To view please login to and/or subscribe to one of our subscription plans.
2021-22 2022-23 2023-24 2024-25 2025-26 2026-27 2027-28 2028-29 2030-31 2031-32 2032-33 2033-34 2034-35
Glossary
Type
Statistic
Definition
Individual
G/60
Goals Against per 60 minutes.
Individual
A/60
Assists per 60 minutes.
Individual
Pts/60
Points per 60 minutes.
Individual
xG/60
Expected Goals per 60 minutes.
Individual
GAE/60
Goals Above Expected (G/60 - xG/60).
Individual
Sh%
Shooting Percentage.
Individual
xSh%
Expected Shooting Percentage.
Individual
Sh%AE
Shooting percentage above expected (Sh% - xSh%).
Individual
%SA Rush
Percentage of shot attempts determined to be on the rush.
Individual
%SA Reb.
Percentage of shot attempts determined to be from rebounds.
On Ice
SAF/60
Shot Attempts For per 60 minutes.
On Ice
GF/60
Goals For per 60 minutes.
On Ice
xGF/60
Expected Goals For per 60 minutes.
On Ice
SAA/60
Shot Attempts Against per 60 minutes (lower is better).
On Ice
GA/60
Goals Against per 60 minutes (lower is better).
On Ice
xGA/60
Expected Goals Against per 60 minutes (lower is better).
On Ice
GF%
Goals For Percentage = Goals For / (Goals For + Goals Against)
On Ice
xGF%
Expected Goals For Percentage = Expected Goals For / (Expected Goals For + Expected Goals Against)
On Ice
xGF Rel
xGF/60 when On Ice - xGF/60 when not On Ice.
On Ice
xGA Rel
xGA/60 when On Ice - xGA/60 when not On Ice (lower is better).
P.O Joseph signed a $775,000 1-year contract with the Vancouver Canucks and General Manager Patrik Alvin on July 2, 2025 with an AAV of $775,000. This contract will start in 2025-26 and end after the 2025-26 season. In the first season of the contract the cap hit was equivalent to 0.81% of the salary cap.
P.O Joseph signed a $950,000 1-year contract with the St. Louis Blues and General Manager Doug Armstrong on July 2, 2024 with an AAV of $950,000. This contract will start in 2024-25 and end after the 2024-25 season. In the first season of the contract the cap hit was equivalent to 1.08% of the salary cap.
P.O Joseph signed a $1,650,000 2-year contract with the Pittsburgh Penguins and General Manager Ron Hextall on July 12, 2022 with an AAV of $825,000. This contract will start in 2022-23 and end after the 2023-24 season. In the first season of the contract the cap hit was equivalent to 1.00% of the salary cap.
P.O Joseph signed a $2,775,000 3-year contract with the Arizona Coyotes and General Manager John Chayka on December 4, 2017 with an AAV of $925,000. This contract will start in 2017-18 and end after the 2021-22 season. In the first season of the contract the cap hit was equivalent to 1.23% of the salary cap.

 P.O Joseph