
 Nick Bjugstad
| Position | Center / Right Wing | Current Team | New Jersey Devils |
| Shoots | Right | Current Contract | 2 years ($1.8M CapHit) |
| Height | 6'6" | Expires | 2026-27 |
| Weight (lbs) | 210 | Expiry Age (Jun 30) | 34 |
| Age (DOB) | 34 (July 17, 1992) | Expiry Status | UFA |
| Drafted | 2010, Round 1, Overall 19 (FLA) |
| Date | Team | Transaction | |
|---|---|---|---|
| Feb 4, 2026 | New Jersey Devils | Acquired from St. Louis Blues | |
| Feb 4, 2026 | St. Louis Blues | Traded to New Jersey Devils | |
| Jan 13, 2026 | St. Louis Blues | Activated from IR | |
| Dec 16, 2025 | St. Louis Blues | Placed on IR | |
| Jul 1, 2025 | St. Louis Blues | Signed 2 years @ $1.750M AAV starting in 2025-26 | |
| Mar 18, 2025 | Utah Hockey Club | Activated from IR | |
| Mar 6, 2025 | Utah Hockey Club | Placed on IR | |
| Oct 25, 2024 | Utah Hockey Club | Activated from IR | |
| Oct 7, 2024 | Utah Hockey Club | Placed on IR | |
| Jul 1, 2023 | Arizona Coyotes | Signed 2 years @ $2.100M AAV starting in 2023-24 | |
| Jul 13, 2022 | Arizona Coyotes | Signed 1 year @ $900K AAV starting in 2022-23 | |
| Jul 5, 2021 | Minnesota Wild | Signed 1 year @ $900K AAV starting in 2021-22 | |
| Dec 31, 2014 | Florida Panthers | Signed 6 years @ $4.100M AAV starting in 2015-16 | |
| Apr 3, 2013 | Florida Panthers | Signed to an entry level contract. |
Player Card(s)
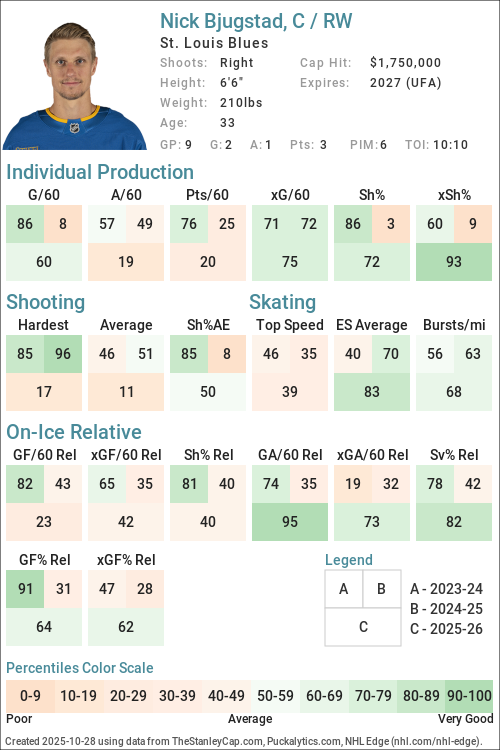
URL: https://thestanleycap.com/cdn/player_cards/20252026/nick-bjugstad-8475760.png
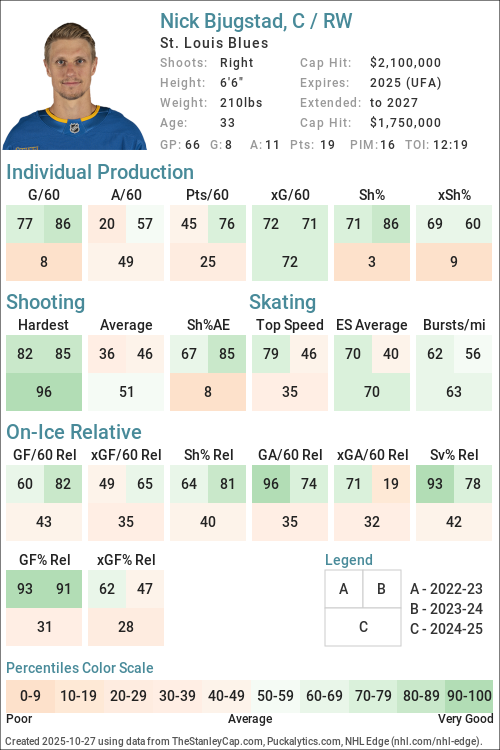
URL: https://thestanleycap.com/cdn/player_cards/20242025/nick-bjugstad-8475760.png
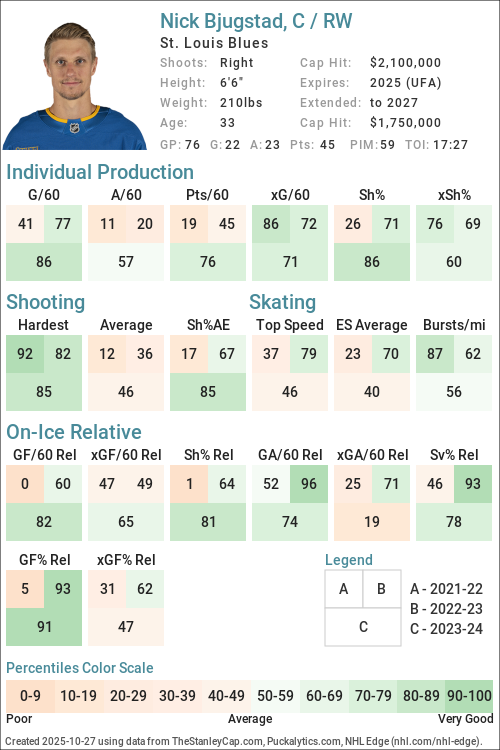
URL: https://thestanleycap.com/cdn/player_cards/20232024/nick-bjugstad-8475760.png
About Player Cards
Player cards present an infographic of a players performance using a series of Player Archetypes developed for Puckalytics.com and TheStanleyCap.com. The boxes in the rink image show the archetype ratings for the season specified in the card while the graphs to the right show the five-year trends for those archetypes.
Except for Faceoffs, the values shown are the players z-score (standard deviation from the mean) for the specific metric used to calculate the archetype values. When calculating z-scores forwards were compared to forwards and defensemen were compared to defensemen. Positive values indicate the player is above average and shaded in blue, while negative values indicate the player is below average and shaded in pink. The five year trend charts show a range of -4.0 to 4.0.
The value shown for Faceoffs is the faceoff winning percentage rather than their z-score with winning percentages below 50 in pink shades and above 50 in blue shades.
All archetypes are 5v5 except 5v4 TOI, 4v5 TOI, Skating (even strength) and Faceoffs (all situations). Archetypes use regular season data only.
Archetypes Summary
- Sniper - Measures the to score above the expected goal rate.
- Rebound - Measures the percent of a players shot attempts that come from rebounds (forwards only).
- 5v4 TOI - Powerplay ice time, calculated as the percentage of his teams 5v4 ice time that the player was on the ice for.
- Shooter - Measures whether a players points come from shots (goals or assists on rebounds from his shots).
- Producer - Measures a players ability to produce goals and assists, adjusted for quality of teammates.
- Playmaker - Measures whether a players points come from passes.
- Drive - Measures a players ability to drive puck possession and generate shot attempts for his team.
- Rush - Measures the percent of a players shot attempts that come from rush plays
- Possession - An indicator of a players ability to improve his teams puck possession game.
- Faceoffs - Faceoff Winning Percentage (min. 75 faceoffs taken).
- 5v5 TOI - The percentage of his teams 5v5 TOI that the player was on the ice for.
- Suppress - Measures a players ability to suppress opponent puck possession and shot attempts against.
- Skating - An indicator of a players skating ability, or speed bursts above 20mph per mile skated.
- Defend - An indicator of a players ability to suppress shot quality against.
- 4v5 TOI - Penalty Kill ice time, calculated as the percentage of his teams 4v5 ice time that the player was on the ice for.
Data Sources
- Salary data is from TheStanleyCap.com
- Skating data is from NHL Edge
- Other statistics are from Puckalytics.com and derived from data from NHL.com
Terms of Use
You are free to use include player cards in written articles, share on social media, or on other public websites under the following conditions:
- You credit TheStanleyCap.com as the source and provide a link back to TheStanleyCap.com or this player page.
- You do not mass copy/duplicate/publish dozens or hundreds of player cards. A few, or a handful for a written article is fine. Be reasonable. Fair use rules apply.
- If you are a high-traffic website you must download and host the image(s) on your site rather than overload TheStanleyCap servers with traffic.
Note: Player cards will update daily throughout the season so if you want to include snapshot then you must download the image.
If you have any questions, send an e-mail to the e-mail address at the top of this page.
Read Introducing Player Archetypes on HockeyAnalysis.com for more details on archetype calculations.
Core Archetypes
| Season | Team(s) | GP | TOI | Producer | Playmaker | Shooter | Sniper | Rebound | Rush | Skating | Defend |
|---|---|---|---|---|---|---|---|---|---|---|---|
| 2015-16 | FLA | 67 | -0.48 | -0.99 | 0.40 | -0.15 | -0.05 | -0.98 | - | -0.89 | |
| 2016-17 | FLA | 54 | -0.61 | -0.54 | -0.35 | -0.44 | 0.11 | 0.11 | - | -0.01 | |
| 2017-18 | FLA | 82 | 1.15 | 0.68 | 0.72 | 0.09 | 0.12 | 0.22 | - | 0.11 | |
| 2018-19 | FLA, PIT | 64 | -0.38 | -0.80 | 0.33 | -0.32 | 1.76 | -0.49 | - | 1.89 | |
| 2019-20 | PIT | 13 | -1.63 | -1.21 | -1.04 | -1.13 | -0.55 | 0.32 | - | 3.61 | |
| 2020-21 | MIN | 44 | 0.50 | 0.45 | -0.06 | -0.45 | 1.97 | -0.11 | - | 1.26 | |
| 2021-22 | MIN | 57 | -0.90 | -0.98 | -0.36 | -0.61 | 1.30 | 0.88 | 1.13 | -0.11 | |
| 2022-23 | ARI, EDM | 78 | -0.41 | -0.91 | 0.40 | 0.46 | -0.47 | 0.70 | 0.15 | 1.48 | |
| 2023-24 | ARI | 76 | 0.48 | -0.24 | 0.80 | 1.03 | -0.82 | 0.25 | -0.07 | 0.77 | |
| 2024-25 | UTA | 66 | -0.88 | 0.09 | -1.19 | -1.33 | 0.28 | 0.64 | 0.20 | -0.17 | |
| 2025-26 | NJD, STL | 61 | -1.46 | -1.44 | -0.52 | -0.58 | -0.64 | -0.39 | 0.08 | 0.34 |
Situational and Secondary Archetypes
| Season | Team(s) | GP | TOI | 5v5 TOI | 5v4 TOI | 4v5 TOI | Possession | Drive | Suppress | Faceoffs |
|---|---|---|---|---|---|---|---|---|---|---|
| 2015-16 | FLA | 67 | 0.20 | 0.44 | -1.74 | 0.15 | 0.43 | -0.48 | 51.7 | |
| 2016-17 | FLA | 54 | -0.40 | -0.53 | -2.02 | -1.84 | -0.86 | -2.58 | 47.6 | |
| 2017-18 | FLA | 82 | 0.52 | -0.50 | -2.00 | 1.10 | 1.36 | 0.10 | 51.0 | |
| 2018-19 | FLA, PIT | 64 | 0.46 | -0.54 | -1.94 | 0.17 | 0.15 | 0.05 | 49.4 | |
| 2019-20 | PIT | 13 | -1.13 | -0.97 | -1.23 | -1.34 | -1.40 | -0.48 | 39.6 | |
| 2020-21 | MIN | 44 | -0.93 | -1.18 | -2.14 | 0.50 | 0.67 | -0.03 | 46.3 | |
| 2021-22 | MIN | 57 | -1.22 | -1.85 | -1.96 | -0.96 | -0.69 | -0.75 | 55.3 | |
| 2022-23 | ARI, EDM | 78 | 0.50 | -1.32 | 0.62 | 0.29 | 0.12 | 0.30 | 47.8 | |
| 2023-24 | ARI | 76 | 0.47 | -0.32 | 0.98 | 0.32 | 0.63 | -0.53 | 49.2 | |
| 2024-25 | UTA | 66 | -0.55 | -1.28 | -2.07 | -0.54 | -0.11 | -0.78 | 47.4 | |
| 2025-26 | NJD, STL | 61 | -1.36 | -1.78 | -0.86 | -1.31 | -1.10 | -0.51 | 49.9 |
5v5 Individual Stats
| Season | Team(s) | GP | TOI | G/60 | A/60 | Pts/60 | xG/60 | GAE/60 | Sh% | xSh% | Sh%AE | %SA Rush | %SA Reb. |
|---|---|---|---|---|---|---|---|---|---|---|---|---|---|
| 2015-16 | FLA | 67 | 812:38 | 0.66 | 0.59 | 1.26 | 0.74 | -0.08 | 8.04 | 8.96 | -0.93 | 2.11 | 4.93 |
| 2016-17 | FLA | 54 | 593:05 | 0.51 | 0.51 | 1.01 | 0.62 | -0.11 | 7.35 | 9.02 | -1.67 | 4.26 | 5.32 |
| 2017-18 | FLA | 82 | 1053:31 | 1.03 | 1.25 | 2.28 | 1.00 | 0.03 | 9.63 | 9.35 | 0.28 | 4.40 | 5.20 |
| 2018-19 | FLA | 32 | 389:05 | 0.62 | 0.77 | 1.39 | 0.71 | -0.09 | 8.33 | 9.60 | -1.26 | 4.55 | 10.61 |
| 2018-19 | PIT | 32 | 441:31 | 0.95 | 0.41 | 1.36 | 1.08 | -0.13 | 8.64 | 9.85 | -1.21 | 2.11 | 8.42 |
| 2018-19 | FLA, PIT | 64 | 830:36 | 0.79 | 0.58 | 1.37 | 0.91 | -0.11 | 8.53 | 9.76 | -1.23 | 3.11 | 9.32 |
| 2019-20 | PIT | 13 | 133:27 | 0.45 | 0.45 | 0.90 | 0.71 | -0.26 | 7.14 | 11.34 | -4.20 | 4.55 | 4.55 |
| 2020-21 | MIN | 44 | 459:25 | 0.65 | 1.18 | 1.83 | 0.82 | -0.17 | 7.14 | 8.96 | -1.82 | 3.49 | 11.63 |
| 2021-22 | MIN | 57 | 565:04 | 0.64 | 0.53 | 1.17 | 0.83 | -0.19 | 7.59 | 9.86 | -2.27 | 5.77 | 9.62 |
| 2022-23 | ARI | 59 | 790:44 | 0.83 | 0.68 | 1.52 | 0.78 | 0.05 | 12.09 | 11.36 | 0.73 | 6.82 | 6.06 |
| 2022-23 | EDM | 19 | 211:56 | 1.13 | 0.57 | 1.70 | 0.94 | 0.19 | 13.79 | 11.48 | 2.32 | 0.00 | 4.76 |
| 2022-23 | ARI, EDM | 78 | 1002:40 | 0.90 | 0.66 | 1.56 | 0.82 | 0.08 | 12.50 | 11.38 | 1.12 | 5.17 | 5.75 |
| 2023-24 | ARI | 76 | 973:42 | 1.05 | 0.99 | 2.03 | 0.76 | 0.29 | 14.29 | 10.33 | 3.95 | 4.40 | 5.49 |
| 2024-25 | UTA | 66 | 750:36 | 0.32 | 0.88 | 1.20 | 0.75 | -0.43 | 3.81 | 8.93 | -5.12 | 3.40 | 8.16 |
| 2025-26 | STL | 35 | 362:24 | 0.83 | 0.17 | 0.99 | 0.81 | 0.01 | 10.42 | 10.24 | 0.18 | 1.47 | 7.35 |
| 2025-26 | NJD | 26 | 244:06 | 0.00 | 0.49 | 0.49 | 0.53 | -0.53 | 0.00 | 11.35 | -11.35 | 3.23 | 3.23 |
| 2025-26 | NJD, STL | 61 | 606:30 | 0.49 | 0.30 | 0.79 | 0.70 | -0.20 | 7.46 | 10.55 | -3.09 | 2.02 | 6.06 |
5v5 On Ice Stats
| Season | Team(s) | GP | TOI | SAF/60 | GF/60 | xGF/60 | SAA/60 | GA/60 | xGA/60 | GF% | xGF% | xGF Rel | xGA Rel | xGF% Rel |
|---|---|---|---|---|---|---|---|---|---|---|---|---|---|---|
| 2015-16 | FLA | 67 | 812:38 | 39.65 | 2.07 | 2.33 | 40.98 | 2.36 | 2.18 | 46.67 | 51.71 | 0.25 | 0.01 | 2.70 |
| 2016-17 | FLA | 54 | 593:05 | 39.25 | 1.42 | 2.05 | 48.46 | 2.93 | 2.80 | 32.56 | 42.29 | -0.23 | 0.47 | -7.20 |
| 2017-18 | FLA | 82 | 1053:31 | 49.61 | 3.25 | 2.80 | 44.19 | 2.51 | 2.44 | 56.44 | 53.45 | 0.57 | 0.00 | 5.64 |
| 2018-19 | FLA | 32 | 389:05 | 44.10 | 2.16 | 2.51 | 42.72 | 2.00 | 2.57 | 51.85 | 49.46 | -0.11 | 0.04 | -1.44 |
| 2018-19 | PIT | 32 | 441:31 | 46.75 | 1.90 | 2.91 | 43.35 | 1.36 | 2.25 | 58.33 | 56.42 | 0.31 | -0.30 | 6.00 |
| 2018-19 | FLA, PIT | 64 | 830:36 | 45.51 | 2.02 | 2.72 | 43.05 | 1.66 | 2.40 | 54.90 | 53.19 | 0.12 | -0.14 | 2.53 |
| 2019-20 | PIT | 13 | 133:27 | 40.91 | 2.70 | 2.27 | 36.87 | 1.35 | 2.06 | 66.67 | 52.52 | -0.73 | -0.05 | -6.26 |
| 2020-21 | MIN | 44 | 459:25 | 41.53 | 2.48 | 2.62 | 42.18 | 1.70 | 2.21 | 59.38 | 54.21 | 0.26 | -0.00 | 2.58 |
| 2021-22 | MIN | 57 | 565:04 | 39.50 | 2.02 | 2.42 | 42.58 | 2.44 | 2.40 | 45.24 | 50.16 | -0.15 | 0.18 | -3.45 |
| 2022-23 | ARI | 59 | 790:44 | 37.26 | 2.50 | 2.35 | 44.84 | 2.05 | 2.59 | 55.00 | 47.58 | 0.08 | -0.39 | 4.33 |
| 2022-23 | EDM | 19 | 211:56 | 41.05 | 2.83 | 2.94 | 36.52 | 1.70 | 3.07 | 62.50 | 48.94 | -0.41 | 0.37 | -6.44 |
| 2022-23 | ARI, EDM | 78 | 1002:40 | 38.06 | 2.57 | 2.48 | 43.09 | 1.97 | 2.69 | 56.58 | 47.92 | -0.08 | -0.21 | 1.12 |
| 2023-24 | ARI | 76 | 973:42 | 42.40 | 3.14 | 2.56 | 44.55 | 2.28 | 2.67 | 57.95 | 48.99 | 0.22 | 0.20 | 0.35 |
| 2024-25 | UTA | 66 | 750:36 | 43.17 | 2.16 | 2.59 | 40.45 | 2.32 | 2.42 | 48.21 | 51.76 | -0.10 | 0.14 | -2.38 |
| 2025-26 | STL | 35 | 362:24 | 36.26 | 1.32 | 2.23 | 39.24 | 2.32 | 2.45 | 36.36 | 47.67 | -0.27 | 0.03 | -3.19 |
| 2025-26 | NJD | 26 | 244:06 | 35.89 | 1.97 | 2.28 | 44.49 | 2.95 | 2.95 | 40.00 | 43.63 | -0.58 | 0.41 | -9.36 |
| 2025-26 | NJD, STL | 61 | 606:30 | 36.11 | 1.58 | 2.25 | 41.35 | 2.57 | 2.65 | 38.10 | 45.94 | -0.41 | 0.18 | -5.92 |
NHL Edge Stats
| Skating | Shooting | Zone Time | |||||||||||
|---|---|---|---|---|---|---|---|---|---|---|---|---|---|
| Season | GP | Top Speed | Bursts>20/mi | Avg. Speed | Top Speed | Avg. Speed | %Long Range | %Mid Range | %High Danger | ES DZ% | ES NZ% | ES OZ% | |
| This table is for Basic and Premium subscribers only. To view please login to and/or subscribe to one of our subscription plans. | |||||||||||||
Legend
| Percentile 0-25 | Percentile 25-50 | Percentile 50-75 | Percentile 75-100 |
5v5 Lines
| Season | Teammate | Teammate | Team | TOI | GF/60 | GA/60 | GF% | xGF/60 | xGA/60 | xGF% | xGF Rel | xGA Rel | xGF% Rel |
|---|
Glossary
| Type | Statistic | Definition |
|---|---|---|
| Individual | G/60 | Goals Against per 60 minutes. |
| Individual | A/60 | Assists per 60 minutes. |
| Individual | Pts/60 | Points per 60 minutes. |
| Individual | xG/60 | Expected Goals per 60 minutes. |
| Individual | GAE/60 | Goals Above Expected (G/60 - xG/60). |
| Individual | Sh% | Shooting Percentage. |
| Individual | xSh% | Expected Shooting Percentage. |
| Individual | Sh%AE | Shooting percentage above expected (Sh% - xSh%). |
| Individual | %SA Rush | Percentage of shot attempts determined to be on the rush. |
| Individual | %SA Reb. | Percentage of shot attempts determined to be from rebounds. |
| On Ice | SAF/60 | Shot Attempts For per 60 minutes. |
| On Ice | GF/60 | Goals For per 60 minutes. |
| On Ice | xGF/60 | Expected Goals For per 60 minutes. |
| On Ice | SAA/60 | Shot Attempts Against per 60 minutes (lower is better). |
| On Ice | GA/60 | Goals Against per 60 minutes (lower is better). |
| On Ice | xGA/60 | Expected Goals Against per 60 minutes (lower is better). |
| On Ice | GF% | Goals For Percentage = Goals For / (Goals For + Goals Against) |
| On Ice | xGF% | Expected Goals For Percentage = Expected Goals For / (Expected Goals For + Expected Goals Against) |
| On Ice | xGF Rel | xGF/60 when On Ice - xGF/60 when not On Ice. |
| On Ice | xGA Rel | xGA/60 when On Ice - xGA/60 when not On Ice (lower is better). |
| On Ice | xGF% Rel | xGF% when On Ice - xGF% when not On Ice. |
News and Opinions
-
Five Moves That Can Improve the Devils While Protecting Cap Space at All About the Jersey (Sat Jul 11, 2026)
-
An Exercise in Analytics: What Would the Ideal Devils Forward Lineup Be? at All About the Jersey (Sat Jul 4, 2026)
-
A More Modern Team: How the Devils Can Lean on their Best Players Next Season at All About the Jersey (Sun Apr 26, 2026)
-
Penguins’ Most Creative Player Nicknames Through the Years at The Hockey Writers (Wed Mar 25, 2026)
-
Devils Trade Deadline Preview: Trade Or Keep at Devils Army (Fri Mar 6, 2026)
-
NHL trade deadline live tracker, analysis on all of the deals at Yahoo Sports NHL (Thu Mar 5, 2026)
-
Nick Bjugstad Prepares For Milestone Game at Yahoo Sports NHL (Tue Mar 3, 2026)
-
NHL trade deadline tracker: Analysis on all of the big moves at Yahoo Sports NHL (Mon Mar 2, 2026)
-
Devils Snap Losing Streak With Great Performances in 3-1 Win Over Blues at All About the Jersey (Sat Feb 28, 2026)
-
Devils Snap Losing Streak With Great Performances in 3-1 Win Over Blues at Yahoo Sports NHL (Sat Feb 28, 2026)
-
What the Blues’ Recent Trade With the Devils Says About Their Direction at The Hockey Writers (Sun Feb 8, 2026)
-
Re-Signing Priorities for the New Jersey Devils Front Office This Year at All About the Jersey (Sun Feb 8, 2026)
-
Elliotte Friedman makes sense of New Jersey Devils' Nick Bjugstad trade at Pucks and Pitchforks (Sat Feb 7, 2026)
-
Devils most recent trade confuses insider at Pucks and Pitchforks (Thu Feb 5, 2026)
-
Game Preview #57: New Jersey Devils vs. New York Islanders at All About the Jersey (Thu Feb 5, 2026)
-
Meet the Newest New Jersey Devil: Nick Bjugstad at The Hockey Writers (Thu Feb 5, 2026)
-
What The Devils Are Getting In The Newly-Acquired Nick Bjugstad at Devils Army (Thu Feb 5, 2026)
-
Grading the Trade: Devils Acquire Nick Bjugstad from St. Louis Blues for Thomas Bordeleau and Mid-Round Draft Pick at All About the Jersey (Thu Feb 5, 2026)
-
Blues sell-off could begin with Bjugstad trade at Bleedin' Blue (Wed Feb 4, 2026)
-
Devils acquire Bjugstad from Blues before freeze at ESPN (Wed Feb 4, 2026)
-
Devils acquire Nick Bjugstad in a trade with the Blues before the NHL's Olympic roster freeze at Yahoo Sports NHL (Wed Feb 4, 2026)
-
Blues Make First Deal Of What Could Be Multiple Dominoes, Trade Bjugstad at Yahoo Sports NHL (Wed Feb 4, 2026)
-
New Jersey trade for a fourth-line center way too late into the season at Pucks and Pitchforks (Wed Feb 4, 2026)
-
Right before the roster freeze for Olympic break, the Blues make a move at Bleedin' Blue (Wed Feb 4, 2026)
-
St. Louis Blues trade 6-foot-6 center Nick Bjugstad to New Jersey Devils at Habs Fanatics (Wed Feb 4, 2026)
-
Red hot Nick Bjugstad has been fantastic since re-joining team at Bleedin' Blue (Sun Jan 18, 2026)
-
Nick Bjugstad set to miss a few days due to injury at Bleedin' Blue (Wed Dec 10, 2025)
-
Observations From Blues' 5-2 Win Vs. Canucks To Sweep Pair On Road at Yahoo Sports NHL (Tue Oct 14, 2025)
-
This player could be an X-factor for the Blues in 2025-26 at Bleedin' Blue (Wed Oct 1, 2025)
-
Utah Mammoth’s 2024-25 Report Cards: Nick Bjugstad at The Hockey Writers (Sun Sep 28, 2025)
-
Nick Bjugstad Is Healthy, Feeling Good About Getting Back To Past Numbers For Blues at Yahoo Sports NHL (Fri Sep 19, 2025)
-
Blues fans may have found their new locker room favorite in Nick Bjugstad at Bleedin' Blue (Sun Sep 7, 2025)
-
NHL’s Central Division Remains Stacked Heading Into 2025-26 at The Hockey Writers (Thu Aug 28, 2025)
-
Nick Bjugstad could leave a great first impression at Bleedin' Blue (Fri Aug 15, 2025)
-
Can the fourth line for the St. Louis Blues surprise again? at Bleedin' Blue (Wed Jul 30, 2025)
-
Grading the St. Louis Blues’ offseason so far with Suter and Bjugstad signings, plus Mailloux Trade at Bleedin' Blue (Thu Jul 3, 2025)
-
A deeper look into what Nick Bjugstad will bring to the Blues at Bleedin' Blue (Wed Jul 2, 2025)
-
Deadline Targets The Devils Should Focus On Post Timo Meier at Devils Army (Thu Mar 2, 2023)
-
DAB Trade Profile: Nick Bjugstad, Solid Bottom-Six Forward at Devils Army (Thu Feb 23, 2023)
Current Contract
Nick Bjugstad signed a $3,500,000 2-year contract with the St. Louis Blues and General Manager Doug Armstrong on July 1, 2025 with an AAV of $1,750,000. This contract will start in 2025-26 and end after the 2026-27 season. In the first season of the contract the cap hit was equivalent to 1.83% of the salary cap.
Standard Contract (UFA) ( ) (0 ratings)
Nick Bjugstad signed a $4,200,000 2-year contract with the Arizona Coyotes and General Manager Bill Armstrong on July 1, 2023 with an AAV of $2,100,000. This contract will start in 2023-24 and end after the 2024-25 season. In the first season of the contract the cap hit was equivalent to 2.51% of the salary cap.
Standard Contract (UFA) ( ) (0 ratings)
| Season | Age* | Clause | Cap Hit | AAV | Perf. Bonus | Sign. Bonus | Salary | Compensation | Minors Salary | Status | |
|---|---|---|---|---|---|---|---|---|---|---|---|
| 2023-24 | 31 | $2,100,000 | $2,100,000 | - | - | $2,100,000 | $2,100,000 | $2,100,000 | UFA | ||
| 2024-25 | 32 | $2,100,000 | $2,100,000 | - | - | $2,100,000 | $2,100,000 | $2,100,000 | UFA | ||
| Total | - | - | $4,200,000 | $4,200,000 | $4,200,000 |
Nick Bjugstad signed a $900,000 1-year contract with the Arizona Coyotes and General Manager Bill Armstrong on July 13, 2022 with an AAV of $900,000. This contract will start in 2022-23 and end after the 2022-23 season. In the first season of the contract the cap hit was equivalent to 1.09% of the salary cap.
Standard Contract (UFA) ( ) (0 ratings)
| Season | Age* | Clause | Cap Hit | AAV | Perf. Bonus | Sign. Bonus | Salary | Compensation | Minors Salary | Status | |
|---|---|---|---|---|---|---|---|---|---|---|---|
| 2022-23 | 30 | $900,000 | $900,000 | - | - | $900,000 | $900,000 | $900,000 | UFA | ||
| Total | - | - | $900,000 | $900,000 | $900,000 |
Nick Bjugstad signed a $900,000 1-year contract with the Minnesota Wild and General Manager Bill Guerin on July 5, 2021 with an AAV of $900,000. This contract will start in 2021-22 and end after the 2021-22 season. In the first season of the contract the cap hit was equivalent to 1.10% of the salary cap.
Standard Contract (UFA) ( ) (0 ratings)
| Season | Age* | Clause | Cap Hit | AAV | Perf. Bonus | Sign. Bonus | Salary | Compensation | Minors Salary | Status | |
|---|---|---|---|---|---|---|---|---|---|---|---|
| 2021-22 | 29 | $900,000 | $900,000 | - | - | $900,000 | $900,000 | $900,000 | UFA | ||
| Total | - | - | $900,000 | $900,000 | $900,000 |
Nick Bjugstad signed a $24,600,000 6-year contract with the Florida Panthers and General Manager Dale Tallon on December 31, 2014 with an AAV of $4,100,000. This contract will start in 2015-16 and end after the 2020-21 season. In the first season of the contract the cap hit was equivalent to 5.74% of the salary cap.
Standard Contract (RFA) ( ) (0 ratings)
| Season | Age* | Clause | Cap Hit | AAV | Perf. Bonus | Sign. Bonus | Salary | Compensation | Minors Salary | Status | |
|---|---|---|---|---|---|---|---|---|---|---|---|
| 2015-16 | 23 | $4,100,000 | $4,100,000 | - | - | $2,850,000 | $2,850,000 | $2,850,000 | RFA-arb | ||
| 2016-17 | 24 | $4,100,000 | $4,100,000 | - | - | $3,350,000 | $3,350,000 | $3,350,000 | RFA-arb | ||
| 2017-18 | 25 | $4,100,000 | $4,100,000 | - | - | $3,850,000 | $3,850,000 | $3,850,000 | RFA-arb | ||
| 2018-19 | 26 | $4,100,000 | $4,100,000 | - | - | $4,300,000 | $4,300,000 | $4,300,000 | RFA-arb | ||
| 2019-20 | 27 | $4,100,000 | $4,100,000 | - | - | $5,000,000 | $5,000,000 | $5,000,000 | RFA-arb | ||
| 2020-21 | 28 | $4,100,000 | $4,100,000 | - | - | $5,250,000 | $5,250,000 | $5,250,000 | UFA | ||
| Total | - | - | $24,600,000 | $24,600,000 | $24,600,000 |
Nick Bjugstad signed a $2,700,000 3-year contract with the Florida Panthers and General Manager Dale Tallon on April 3, 2013 with an AAV of $900,000. This contract will start in 2012-13 and end after the 2014-15 season. In the first season of the contract the cap hit was equivalent to 1.50% of the salary cap.
Entry Level Contract ( ) (0 ratings)
| Season | Age* | Clause | Cap Hit | AAV | Perf. Bonus | Sign. Bonus | Salary | Compensation | Minors Salary | Status | |
|---|---|---|---|---|---|---|---|---|---|---|---|
| 2012-13 | 20 | $900,000 | $1,100,000 | $200,000 | $90,000 | $810,000 | $900,000 | $67,500 | ELC | ||
| 2013-14 | 21 | $900,000 | $1,100,000 | $200,000 | $90,000 | $810,000 | $900,000 | $67,500 | ELC | ||
| 2014-15 | 22 | $900,000 | $1,100,000 | $200,000 | $90,000 | $810,000 | $900,000 | $67,500 | ELC | ||
| Total | $600,000 | $270,000 | $2,430,000 | $2,700,000 | $202,500 |
Career Statistics
| Regular Season | Playoffs | |||||||||||||||||||
|---|---|---|---|---|---|---|---|---|---|---|---|---|---|---|---|---|---|---|---|---|
| Season | League | Team | GP | G | A | Pts | +/- | PIM | Shots | Sh% | TOI/G | GP | G | A | Pts | +/- | PIM | Shots | Sh% | TOI/G |
| 2007-08 | High-MN | Blaine | 24 | 6 | 14 | 20 | 10 | |||||||||||||
| 2007-08 | USHS-MN | Blaine High | 3 | 2 | 1 | 3 | 2 | |||||||||||||
| 2008-09 | High-MN | Blaine | 25 | 26 | 25 | 51 | 20 | |||||||||||||
| 2008-09 | USHS-MN | Blaine High | 3 | 1 | 2 | 3 | 2 | |||||||||||||
| 2009-10 | UMHSEL | Northwest | 23 | 13 | 8 | 21 | 18 | |||||||||||||
| 2009-10 | U-18 | USNTDP | 4 | 0 | 0 | 0 | ||||||||||||||
| 2009-10 | High-MN | Blaine | 30 | 35 | 34 | 69 | 26 | 5 | 6 | 3 | 9 | 2 | ||||||||
| 2010-11 | WCHA | U. of Minnesota | 29 | 8 | 12 | 20 | 51 | |||||||||||||
| 2010-11 | WJC-A | USA | 6 | 2 | 2 | 4 | +2 | |||||||||||||
| 2011-12 | WCHA | U. of Minnesota | 40 | 25 | 17 | 42 | 28 | |||||||||||||
| 2011-12 | WJC-A | USA | 6 | 4 | 2 | 6 | +3 | |||||||||||||
| 2012-13 | WCHA | U. of Minnesota | 40 | 21 | 15 | 36 | 28 | |||||||||||||
| 2012-13 | NHL | Florida Panthers | 11 | 1 | 0 | 1 | -8 | 2 | 17 | 5.9 | 15:13 | |||||||||
| 2012-13 | WC-A | USA | 10 | 0 | 2 | 2 | -2 | |||||||||||||
| 2013-14 | NHL | Florida Panthers | 76 | 16 | 22 | 38 | -14 | 16 | 185 | 8.6 | 16:13 | |||||||||
| 2014-15 | NHL | Florida Panthers | 72 | 24 | 19 | 43 | -7 | 38 | 207 | 11.6 | 16:35 | |||||||||
| 2015-16 | NHL | Florida Panthers | 67 | 15 | 19 | 34 | -8 | 41 | 171 | 8.8 | 15:31 | 5 | 2 | 2 | 4 | +6 | 2 | 21 | 9.5 | 19:08 |
| 2016-17 | NHL | Florida Panthers | 54 | 7 | 7 | 14 | -19 | 22 | 91 | 7.7 | 13:09 | |||||||||
| 2016-17 | WC | USA | 8 | 1 | 3 | 4 | +6 | 4 | ||||||||||||
| 2017-18 | NHL | Florida Panthers | 82 | 19 | 30 | 49 | +5 | 41 | 230 | 8.3 | 15:07 | |||||||||
| 2018-19 | NHL | Florida Panthers | 32 | 5 | 7 | 12 | +2 | 16 | 60 | 8.3 | 14:30 | |||||||||
| 2018-19 | NHL | Pittsburgh Penguins | 32 | 9 | 5 | 14 | +4 | 14 | 94 | 9.6 | 15:45 | 4 | -3 | 2 | 11 | 0.0 | 14:12 | |||
| 2019-20 | NHL | Pittsburgh Penguins | 13 | 1 | 1 | 2 | +3 | 8 | 18 | 5.6 | 12:14 | |||||||||
| 2020-21 | NHL | Minnesota Wild | 44 | 6 | 11 | 17 | +7 | 17 | 78 | 7.7 | 11:49 | 6 | 1 | 1 | 2 | 11 | 9.1 | 9:04 | ||
| 2021-22 | NHL | Minnesota Wild | 57 | 7 | 6 | 13 | -2 | 20 | 81 | 8.6 | 10:16 | |||||||||
| 2022-23 | NHL | Arizona Coyotes | 59 | 13 | 10 | 23 | +7 | 26 | 111 | 11.7 | 16:59 | |||||||||
| 2022-23 | NHL | Edmonton Oilers | 19 | 4 | 2 | 6 | +6 | 8 | 34 | 11.8 | 13:45 | 12 | 3 | 3 | -2 | 16 | 16 | 18.8 | 13:34 | |
| 2023-24 | NHL | Arizona Coyotes | 76 | 22 | 23 | 45 | +11 | 59 | 165 | 13.3 | 17:27 | |||||||||
| 2024-25 | NHL | Utah Hockey Club | 66 | 8 | 11 | 19 | -2 | 16 | 115 | 7.0 | 12:19 | |||||||||
| 2025-26 | NHL | St. Louis Blues | 35 | 6 | 1 | 7 | -7 | 25 | 54 | 11.1 | 11:38 | |||||||||
| 2025-26 | NHL | New Jersey Devils | 26 | 0 | 2 | 2 | -4 | 8 | 23 | 0.0 | 10:00 | |||||||||
| NHL Career | 821 | 163 | 176 | 339 | -26 | 377 | 1734 | 9.4 | 14:28 | 27 | 6 | 2 | 8 | +1 | 22 | 59 | 10.2 | 13:42 | ||