
 Jason Zucker
| Position | Left Wing / Right Wing | Current Team | Buffalo Sabres |
| Shoots | Left | Current Contract | 2 years ($4.8M CapHit) |
| Height | 5'11" | Expires | 2026-27 |
| Weight (lbs) | 198 | Expiry Age (Jun 30) | 35 |
| Age (DOB) | 34 (Jan 16, 1992) | Expiry Status | UFA |
| Drafted | 2010, Round 2, Overall 59 (MIN) |
| Date | Team | Transaction | |
|---|---|---|---|
| Jan 6, 2026 | Buffalo Sabres | Activated from IR | |
| Dec 9, 2025 | Buffalo Sabres | Placed on IR | |
| Nov 21, 2025 | Buffalo Sabres | Activated from IR | |
| Nov 4, 2025 | Buffalo Sabres | Placed on IR | |
| Mar 7, 2025 | Buffalo Sabres | Signed 2 years @ $4.750M AAV starting in 2025-26 | |
| Jul 1, 2024 | Buffalo Sabres | Signed 1 year @ $5.000M AAV starting in 2024-25 | |
| Jul 1, 2023 | Arizona Coyotes | Signed 1 year @ $5.300M AAV starting in 2023-24 | |
| Jul 25, 2018 | Minnesota Wild | Signed 5 years @ $5.500M AAV starting in 2018-19 | |
| Jul 15, 2014 | Minnesota Wild | Signed 2 years @ $900K AAV starting in 2014-15 | |
| Mar 27, 2012 | Minnesota Wild | Signed to an entry level contract. |
Player Card(s)
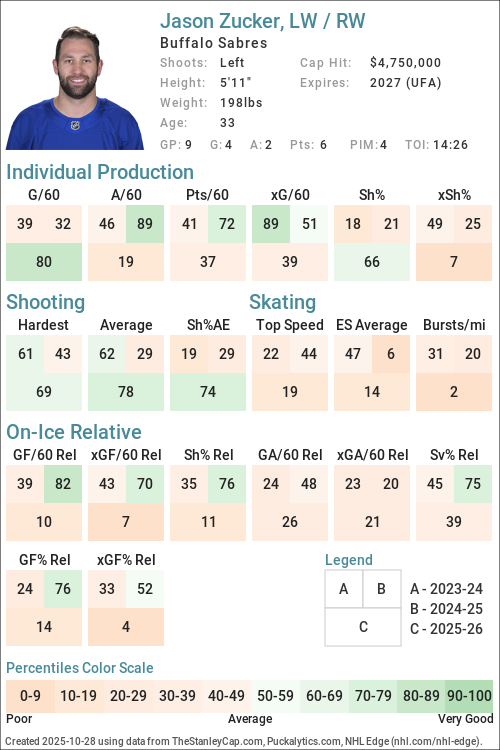
URL: https://thestanleycap.com/cdn/player_cards/20252026/jason-zucker-8475722.png
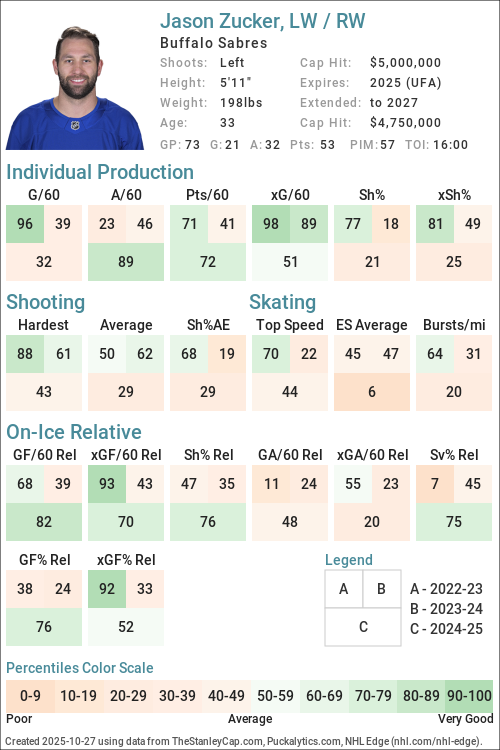
URL: https://thestanleycap.com/cdn/player_cards/20242025/jason-zucker-8475722.png
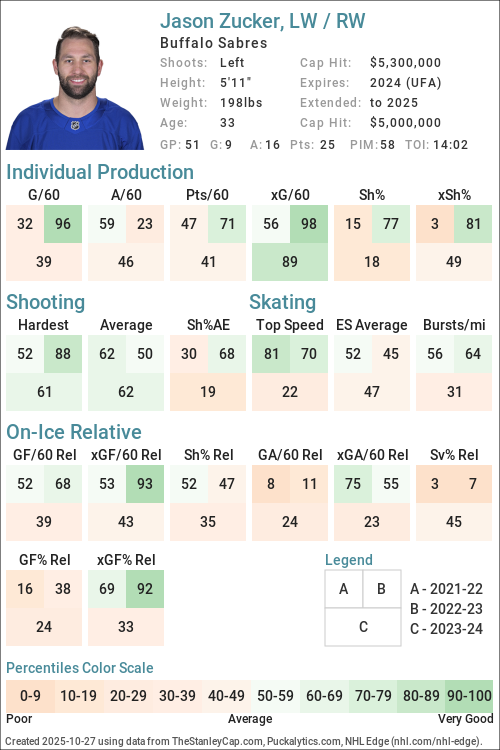
URL: https://thestanleycap.com/cdn/player_cards/20232024/jason-zucker-8475722.png
About Player Cards
Player cards present an infographic of a players performance using a series of Player Archetypes developed for Puckalytics.com and TheStanleyCap.com. The boxes in the rink image show the archetype ratings for the season specified in the card while the graphs to the right show the five-year trends for those archetypes.
Except for Faceoffs, the values shown are the players z-score (standard deviation from the mean) for the specific metric used to calculate the archetype values. When calculating z-scores forwards were compared to forwards and defensemen were compared to defensemen. Positive values indicate the player is above average and shaded in blue, while negative values indicate the player is below average and shaded in pink. The five year trend charts show a range of -4.0 to 4.0.
The value shown for Faceoffs is the faceoff winning percentage rather than their z-score with winning percentages below 50 in pink shades and above 50 in blue shades.
All archetypes are 5v5 except 5v4 TOI, 4v5 TOI, Skating (even strength) and Faceoffs (all situations). Archetypes use regular season data only.
Archetypes Summary
- Sniper - Measures the to score above the expected goal rate.
- Rebound - Measures the percent of a players shot attempts that come from rebounds (forwards only).
- 5v4 TOI - Powerplay ice time, calculated as the percentage of his teams 5v4 ice time that the player was on the ice for.
- Shooter - Measures whether a players points come from shots (goals or assists on rebounds from his shots).
- Producer - Measures a players ability to produce goals and assists, adjusted for quality of teammates.
- Playmaker - Measures whether a players points come from passes.
- Drive - Measures a players ability to drive puck possession and generate shot attempts for his team.
- Rush - Measures the percent of a players shot attempts that come from rush plays
- Possession - An indicator of a players ability to improve his teams puck possession game.
- Faceoffs - Faceoff Winning Percentage (min. 75 faceoffs taken).
- 5v5 TOI - The percentage of his teams 5v5 TOI that the player was on the ice for.
- Suppress - Measures a players ability to suppress opponent puck possession and shot attempts against.
- Skating - An indicator of a players skating ability, or speed bursts above 20mph per mile skated.
- Defend - An indicator of a players ability to suppress shot quality against.
- 4v5 TOI - Penalty Kill ice time, calculated as the percentage of his teams 4v5 ice time that the player was on the ice for.
Data Sources
- Salary data is from TheStanleyCap.com
- Skating data is from NHL Edge
- Other statistics are from Puckalytics.com and derived from data from NHL.com
Terms of Use
You are free to use include player cards in written articles, share on social media, or on other public websites under the following conditions:
- You credit TheStanleyCap.com as the source and provide a link back to TheStanleyCap.com or this player page.
- You do not mass copy/duplicate/publish dozens or hundreds of player cards. A few, or a handful for a written article is fine. Be reasonable. Fair use rules apply.
- If you are a high-traffic website you must download and host the image(s) on your site rather than overload TheStanleyCap servers with traffic.
Note: Player cards will update daily throughout the season so if you want to include snapshot then you must download the image.
If you have any questions, send an e-mail to the e-mail address at the top of this page.
Read Introducing Player Archetypes on HockeyAnalysis.com for more details on archetype calculations.
Core Archetypes
| Season | Team(s) | GP | TOI | Producer | Playmaker | Shooter | Sniper | Rebound | Rush | Skating | Defend |
|---|---|---|---|---|---|---|---|---|---|---|---|
| 2015-16 | MIN | 71 | -0.59 | -1.15 | 0.60 | -0.82 | 1.99 | 0.58 | - | -0.75 | |
| 2016-17 | MIN | 79 | 1.44 | 0.78 | 0.75 | 0.78 | 0.23 | 0.30 | - | 1.12 | |
| 2017-18 | MIN | 82 | 0.90 | -0.28 | 1.62 | 0.68 | 0.71 | 0.58 | - | -0.05 | |
| 2018-19 | MIN | 81 | -0.42 | -0.77 | 0.14 | -0.71 | -0.20 | 0.33 | - | 1.26 | |
| 2019-20 | MIN, PIT | 60 | 0.13 | 0.73 | -0.60 | 0.33 | -0.84 | 1.63 | - | -1.05 | |
| 2020-21 | PIT | 38 | -0.15 | -1.06 | 1.30 | 0.95 | -0.26 | 0.65 | - | -1.14 | |
| 2021-22 | PIT | 41 | -0.43 | 0.03 | -0.71 | -0.57 | -0.37 | -0.46 | -0.01 | -1.87 | |
| 2022-23 | PIT | 78 | 0.41 | -1.09 | 2.20 | 0.29 | 1.42 | -0.48 | 0.20 | -1.42 | |
| 2023-24 | ARI, NSH | 69 | -0.27 | -0.14 | -0.37 | -0.95 | -0.44 | 0.80 | -0.60 | -0.11 | |
| 2024-25 | BUF | 73 | 0.01 | 0.82 | -0.81 | -0.35 | -0.91 | -0.41 | -0.85 | 0.68 | |
| 2025-26 | BUF | 62 | 1.40 | 0.38 | 1.41 | 1.05 | 0.35 | 0.28 | -0.88 | -0.15 |
Situational and Secondary Archetypes
| Season | Team(s) | GP | TOI | 5v5 TOI | 5v4 TOI | 4v5 TOI | Possession | Drive | Suppress | Faceoffs |
|---|---|---|---|---|---|---|---|---|---|---|
| 2015-16 | MIN | 71 | 0.74 | -1.11 | -1.02 | 0.61 | -0.07 | 1.31 | - | |
| 2016-17 | MIN | 79 | 0.87 | -1.81 | -0.90 | 0.55 | 0.46 | 0.35 | - | |
| 2017-18 | MIN | 82 | 0.78 | 0.38 | -1.17 | 1.28 | 1.47 | -0.03 | - | |
| 2018-19 | MIN | 81 | 0.96 | 0.29 | -1.69 | 0.68 | 1.30 | -0.63 | - | |
| 2019-20 | MIN, PIT | 60 | 0.63 | 0.11 | -1.77 | -0.59 | -0.09 | -0.97 | - | |
| 2020-21 | PIT | 38 | 0.66 | -0.48 | -2.13 | -0.15 | -0.24 | 0.04 | - | |
| 2021-22 | PIT | 41 | 0.28 | -0.24 | -2.00 | 0.00 | -0.40 | 0.56 | - | |
| 2022-23 | PIT | 78 | 0.98 | -0.51 | -1.94 | 1.57 | 1.33 | 0.94 | - | |
| 2023-24 | ARI, NSH | 69 | -0.18 | -0.29 | -2.00 | -0.72 | -0.06 | -1.34 | - | |
| 2024-25 | BUF | 73 | 0.14 | 0.96 | -2.13 | 0.08 | 0.66 | -0.90 | 39.6 | |
| 2025-26 | BUF | 62 | -0.07 | 1.07 | -1.99 | -0.68 | -0.26 | -0.79 | 38.7 |
5v5 Individual Stats
| Season | Team(s) | GP | TOI | G/60 | A/60 | Pts/60 | xG/60 | GAE/60 | Sh% | xSh% | Sh%AE | %SA Rush | %SA Reb. |
|---|---|---|---|---|---|---|---|---|---|---|---|---|---|
| 2015-16 | MIN | 71 | 907:27 | 0.73 | 0.46 | 1.19 | 1.02 | -0.29 | 8.27 | 11.55 | -3.28 | 5.18 | 9.84 |
| 2016-17 | MIN | 79 | 1056:54 | 1.02 | 1.36 | 2.38 | 0.80 | 0.23 | 12.00 | 9.35 | 2.65 | 4.65 | 5.58 |
| 2017-18 | MIN | 82 | 1084:18 | 1.05 | 1.00 | 2.05 | 0.84 | 0.22 | 11.11 | 8.83 | 2.28 | 5.12 | 6.51 |
| 2018-19 | MIN | 81 | 1110:27 | 0.65 | 0.70 | 1.35 | 0.88 | -0.24 | 7.06 | 9.63 | -2.58 | 4.76 | 4.76 |
| 2019-20 | MIN | 45 | 546:12 | 0.55 | 0.99 | 1.54 | 0.48 | 0.07 | 9.43 | 8.24 | 1.20 | 8.33 | 1.39 |
| 2019-20 | PIT | 15 | 219:54 | 0.82 | 1.36 | 2.18 | 0.75 | 0.07 | 10.71 | 9.85 | 0.87 | 5.41 | 8.11 |
| 2019-20 | MIN, PIT | 60 | 766:06 | 0.63 | 1.10 | 1.72 | 0.56 | 0.07 | 9.88 | 8.79 | 1.08 | 7.34 | 3.67 |
| 2020-21 | PIT | 38 | 523:47 | 0.92 | 0.57 | 1.49 | 0.66 | 0.25 | 14.81 | 10.71 | 4.11 | 5.13 | 5.13 |
| 2021-22 | PIT | 41 | 532:32 | 0.56 | 1.01 | 1.58 | 0.75 | -0.19 | 6.33 | 8.44 | -2.12 | 3.12 | 5.21 |
| 2022-23 | PIT | 78 | 1060:53 | 1.30 | 0.68 | 1.98 | 1.25 | 0.05 | 13.14 | 12.64 | 0.50 | 2.83 | 11.74 |
| 2023-24 | ARI | 51 | 597:25 | 0.40 | 1.00 | 1.41 | 0.88 | -0.48 | 5.19 | 11.43 | -6.24 | 6.77 | 4.51 |
| 2023-24 | NSH | 18 | 205:19 | 1.17 | 0.58 | 1.75 | 0.96 | 0.21 | 10.00 | 8.23 | 1.77 | 2.13 | 12.77 |
| 2023-24 | ARI, NSH | 69 | 802:44 | 0.60 | 0.90 | 1.49 | 0.90 | -0.31 | 6.84 | 10.34 | -3.50 | 5.56 | 6.67 |
| 2024-25 | BUF | 73 | 905:28 | 0.53 | 1.33 | 1.86 | 0.63 | -0.10 | 7.69 | 9.11 | -1.42 | 1.81 | 4.82 |
| 2025-26 | BUF | 62 | 733:40 | 1.14 | 1.14 | 2.29 | 0.87 | 0.28 | 15.05 | 11.41 | 3.64 | 3.08 | 9.23 |
5v5 On Ice Stats
| Season | Team(s) | GP | TOI | SAF/60 | GF/60 | xGF/60 | SAA/60 | GA/60 | xGA/60 | GF% | xGF% | xGF Rel | xGA Rel | xGF% Rel |
|---|---|---|---|---|---|---|---|---|---|---|---|---|---|---|
| 2015-16 | MIN | 71 | 907:27 | 37.69 | 1.98 | 2.21 | 37.36 | 2.12 | 1.78 | 48.39 | 55.36 | 0.20 | -0.29 | 6.11 |
| 2016-17 | MIN | 79 | 1056:54 | 42.29 | 3.52 | 2.48 | 40.59 | 1.76 | 1.84 | 66.67 | 57.45 | 0.19 | -0.16 | 4.14 |
| 2017-18 | MIN | 82 | 1084:18 | 43.99 | 2.82 | 2.63 | 42.61 | 2.27 | 1.98 | 55.43 | 57.07 | 0.60 | -0.10 | 7.66 |
| 2018-19 | MIN | 81 | 1110:27 | 47.28 | 2.00 | 2.77 | 41.60 | 2.05 | 2.20 | 49.33 | 55.82 | 0.50 | 0.14 | 3.33 |
| 2019-20 | MIN | 45 | 546:12 | 37.35 | 2.53 | 2.10 | 43.28 | 3.19 | 2.19 | 44.23 | 48.98 | -0.14 | 0.24 | -4.50 |
| 2019-20 | PIT | 15 | 219:54 | 46.93 | 2.73 | 2.57 | 41.20 | 3.00 | 2.88 | 47.62 | 47.18 | 0.25 | 0.45 | -1.76 |
| 2019-20 | MIN, PIT | 60 | 766:06 | 40.10 | 2.58 | 2.23 | 42.68 | 3.13 | 2.39 | 45.21 | 48.37 | -0.02 | 0.32 | -3.89 |
| 2020-21 | PIT | 38 | 523:47 | 38.60 | 2.18 | 2.09 | 36.89 | 2.98 | 2.57 | 42.22 | 44.91 | -0.26 | 0.31 | -6.11 |
| 2021-22 | PIT | 41 | 532:32 | 43.60 | 2.70 | 2.83 | 38.98 | 2.70 | 2.27 | 50.00 | 55.53 | 0.04 | -0.10 | 1.44 |
| 2022-23 | PIT | 78 | 1060:53 | 51.13 | 2.94 | 3.49 | 40.66 | 3.05 | 2.73 | 49.06 | 56.06 | 0.66 | 0.05 | 4.80 |
| 2023-24 | ARI | 51 | 597:25 | 39.87 | 2.31 | 2.49 | 45.40 | 2.61 | 2.57 | 46.94 | 49.18 | 0.16 | 0.07 | 0.95 |
| 2023-24 | NSH | 18 | 205:19 | 47.34 | 2.34 | 2.82 | 46.46 | 2.92 | 2.41 | 44.44 | 53.92 | -0.31 | 0.16 | -4.28 |
| 2023-24 | ARI, NSH | 69 | 802:44 | 41.78 | 2.32 | 2.58 | 45.67 | 2.69 | 2.53 | 46.27 | 50.42 | 0.03 | 0.10 | -0.71 |
| 2024-25 | BUF | 73 | 905:28 | 43.07 | 3.25 | 2.44 | 44.13 | 2.72 | 2.65 | 54.44 | 47.98 | 0.19 | 0.19 | 0.12 |
| 2025-26 | BUF | 62 | 733:40 | 41.30 | 3.03 | 2.84 | 43.67 | 2.62 | 2.80 | 53.62 | 50.37 | 0.16 | 0.21 | -0.52 |
NHL Edge Stats
| Skating | Shooting | Zone Time | |||||||||||
|---|---|---|---|---|---|---|---|---|---|---|---|---|---|
| Season | GP | Top Speed | Bursts>20/mi | Avg. Speed | Top Speed | Avg. Speed | %Long Range | %Mid Range | %High Danger | ES DZ% | ES NZ% | ES OZ% | |
| This table is for Basic and Premium subscribers only. To view please login to and/or subscribe to one of our subscription plans. | |||||||||||||
Legend
| Percentile 0-25 | Percentile 25-50 | Percentile 50-75 | Percentile 75-100 |
5v5 Lines
| Season | Teammate | Teammate | Team | TOI | GF/60 | GA/60 | GF% | xGF/60 | xGA/60 | xGF% | xGF Rel | xGA Rel | xGF% Rel |
|---|
Glossary
| Type | Statistic | Definition |
|---|---|---|
| Individual | G/60 | Goals Against per 60 minutes. |
| Individual | A/60 | Assists per 60 minutes. |
| Individual | Pts/60 | Points per 60 minutes. |
| Individual | xG/60 | Expected Goals per 60 minutes. |
| Individual | GAE/60 | Goals Above Expected (G/60 - xG/60). |
| Individual | Sh% | Shooting Percentage. |
| Individual | xSh% | Expected Shooting Percentage. |
| Individual | Sh%AE | Shooting percentage above expected (Sh% - xSh%). |
| Individual | %SA Rush | Percentage of shot attempts determined to be on the rush. |
| Individual | %SA Reb. | Percentage of shot attempts determined to be from rebounds. |
| On Ice | SAF/60 | Shot Attempts For per 60 minutes. |
| On Ice | GF/60 | Goals For per 60 minutes. |
| On Ice | xGF/60 | Expected Goals For per 60 minutes. |
| On Ice | SAA/60 | Shot Attempts Against per 60 minutes (lower is better). |
| On Ice | GA/60 | Goals Against per 60 minutes (lower is better). |
| On Ice | xGA/60 | Expected Goals Against per 60 minutes (lower is better). |
| On Ice | GF% | Goals For Percentage = Goals For / (Goals For + Goals Against) |
| On Ice | xGF% | Expected Goals For Percentage = Expected Goals For / (Expected Goals For + Expected Goals Against) |
| On Ice | xGF Rel | xGF/60 when On Ice - xGF/60 when not On Ice. |
| On Ice | xGA Rel | xGA/60 when On Ice - xGA/60 when not On Ice (lower is better). |
| On Ice | xGF% Rel | xGF% when On Ice - xGF% when not On Ice. |
News and Opinions
-
Buffalo Sabres veteran added to Trade Board ahead of 2026 NHL Draft at Sabres Noise (Fri Jun 26, 2026)
-
Buffalo Sabres 2025-26 Player Grades: Jason Zucker at The Hockey Writers (Mon Jun 15, 2026)
-
3 Sabres Who Need to Step Up in the Second Round vs The Canadiens at The Hockey Writers (Wed May 6, 2026)
-
Mike Harrington: Sabres winger Jason Zucker waited 11 years to win another round, and he wants more at Sabres Space (Wed May 6, 2026)
-
Sabres notebook: Josh Norris, Jason Zucker, Tyson Kozak available for Game 5 against Boston at Sabres Space (Wed Apr 29, 2026)
-
Lindy Ruff faces tricky Josh Norris decision as Sabres try to eliminate Bruins at Sabres Noise (Mon Apr 27, 2026)
-
Buffalo Sabres Player of the Week 4/12 – Zucker brings veteran savvy at Die by the Blade (Mon Apr 13, 2026)
-
Jason Zucker’s third-period goal lifts the Sabres past the Rangers 5-3 at Sabres Space (Thu Apr 9, 2026)
-
Jason Zucker’s third-period goal lifts the Sabres past the Rangers at Yahoo Sports NHL (Wed Apr 8, 2026)
-
Jason Zucker’s third-period goal lifts the Sabres past the Rangers 5-3 at Yahoo Sports NHL (Wed Apr 8, 2026)
-
Zach Benson delivers a strong message about the Buffalo Sabres locker room at Sabres Noise (Thu Mar 26, 2026)
-
The Jaws of Defeat, Sharks Fall to Surging Sabres 6-3 at Die by the Blade (Wed Mar 11, 2026)
-
Lindy Ruff is on the verge of NHL history with the Buffalo Sabres at Sabres Noise (Mon Mar 9, 2026)
-
Lightning come back only to blow lead in 8-7 loss at Raw Charge (Sun Mar 8, 2026)
-
3 takeaways from the Buffalo Sabres 5-0 win over the New York Islanders at Sabres Noise (Sat Jan 24, 2026)
-
Why Jason Zucker is the perfect mentor for a young Buffalo Sabres' roster at Sabres Noise (Sat Jan 10, 2026)
-
‘I want him to be upset with not being in the lineup’: Why Jason Zucker itches to return to Sabres at Sabres Space (Tue Jan 6, 2026)
-
After win streak ends, Sabres to change lineup by inserting Jason Zucker at Sabres Space (Tue Jan 6, 2026)
-
After win streak ends, Sabres to change lineup by inserting Jason Zucker at Buffalo Hockey Beat (Mon Jan 5, 2026)
-
Sabres Week Ahead: Schedule & Storylines – Win Streak Snapped, Olympics, Zucker and More at The Hockey Writers (Mon Jan 5, 2026)
-
Buffalo Sabres power play needs changes beyond Jason Zucker to fix flaws at Sabres Noise (Mon Jan 5, 2026)
-
3 Buffalo Sabres who could lose their lineup spot with Jason Zucker set to return at Sabres Noise (Mon Dec 29, 2025)
-
Jason Zucker thrilled to see Sabres on hot streak, eyes return from injuries at Sabres Space (Sun Dec 28, 2025)
-
Jason Zucker thrilled to see Sabres on hot streak, eyes return from injuries at Buffalo Hockey Beat (Sat Dec 27, 2025)
-
Sabres veteran Jason Zucker sidelined with lower-body injury; Buffalo recalls prospect from Rochester at Sabres Space (Wed Dec 10, 2025)
-
Sabres Notes: Another Failed Road Test, Zucker Injured In Loss To Flames at Yahoo Sports NHL (Tue Dec 9, 2025)
-
Sabres veteran Jason Zucker sidelined with lower-body injury; Buffalo recalls prospect from Rochester at Buffalo Hockey Beat (Tue Dec 9, 2025)
-
Sabres veteran Jason Zucker sidelined with lower-body injury at Buffalo Hockey Beat (Tue Dec 9, 2025)
-
Pickups: Sam Bennett, Jason Zucker heating up in December at ESPN (Mon Dec 8, 2025)
-
Buffalo Sabres News: Noah Ostlund, Jason Zucker, Ukko-Pekka Luukkonen at Sabres Noise (Mon Dec 8, 2025)
-
3 Takeaways from the Sabres’ 9-3 Win Over the Blackhawks at The Hockey Writers (Sat Nov 22, 2025)
-
Buffalo Sabres News: Zach Benson, Alex Tuch, Jason Zucker at Sabres Noise (Sat Nov 22, 2025)
-
‘He’ll drag everyone into the fight’: How Jason Zucker’s return will impact Sabres lineup at Sabres Space (Sat Nov 22, 2025)
-
Take Your Whiskey HomeSabres 9, Blackhawks 3 at Second City Hockey (Sat Nov 22, 2025)
-
Blackhawks Down at Die by the Blade (Sat Nov 22, 2025)
-
Sabres notes: Zach Benson happy to be back after injury; Jason Zucker can play Friday following illness at Sabres Space (Thu Nov 20, 2025)
-
Sabres notes: Zach Benson happy to be back after injury; Jason Zucker can play Friday following illness at Buffalo Hockey Beat (Wed Nov 19, 2025)
-
Sabres notebook: Michael Kesselring out; Josh Norris, Jason Zucker skate with team ahead of game vs. Edmonton at Sabres Space (Tue Nov 18, 2025)
-
Sabres’ Josh Norris, Jason Zucker skate with teammates; Michael Kesselring out injured at Sabres Space (Tue Nov 18, 2025)
-
Sabres Notes: Kesselring Out, Zucker and Norris Making Progress at Yahoo Sports NHL (Mon Nov 17, 2025)
-
Sabres’ Josh Norris, Jason Zucker skate with teammates; Michael Kesselring out injured at Buffalo Hockey Beat (Mon Nov 17, 2025)
-
"Jason Zucker n'a pas mangé de nourriture solide depuis 9 jours" at HABSolument Fan (Wed Nov 12, 2025)
-
With Jiri Kulich and Jason Zucker sick, Sabres could make roster moves at Sabres Space (Tue Nov 4, 2025)
-
Jason Zucker And Jiri Kulich Absent From Sabres Practice at Yahoo Sports NHL (Mon Nov 3, 2025)
-
With Jiri Kulich and Jason Zucker sick, Sabres could make roster moves at Buffalo Hockey Beat (Mon Nov 3, 2025)
-
Red Wings-Sabres Tweetcap: Tough go for Detroit in Buffalo as Sabres double up Wings, 4-2 at The Malik Report (Wed Oct 22, 2025)
-
Buffalo Sabres lose key forward to injury against the Detroit Red Wings at Sabres Noise (Wed Oct 22, 2025)
-
Buffalo Sabres star benched by Lindy Ruff after game-changing mistake at Sabres Noise (Tue Oct 21, 2025)
-
Jason Zucker's start this season with the Buffalo Sabres deserves more attention at Sabres Noise (Mon Oct 20, 2025)
-
DAB Trade Series: Minnesota Wild at Devils Army (Wed May 1, 2019)
Current Contract
Jason Zucker signed a $9,500,000 2-year contract with the Buffalo Sabres and General Manager Kevyn Adams on March 7, 2025 with an AAV of $4,750,000. This contract will start in 2025-26 and end after the 2026-27 season. In the first season of the contract the cap hit was equivalent to 4.97% of the salary cap.
Standard Contract (UFA) ( ) (0 ratings)
Jason Zucker signed a $5,000,000 1-year contract with the Buffalo Sabres and General Manager Kevyn Adams on July 1, 2024 with an AAV of $5,000,000. This contract will start in 2024-25 and end after the 2024-25 season. In the first season of the contract the cap hit was equivalent to 5.68% of the salary cap.
Standard Contract (UFA) ( ) (0 ratings)
| Season | Age* | Clause | Cap Hit | AAV | Perf. Bonus | Sign. Bonus | Salary | Compensation | Minors Salary | Status | |
|---|---|---|---|---|---|---|---|---|---|---|---|
| 2024-25 | 32 | $5,000,000 | $5,000,000 | - | $1,000,000 | $4,000,000 | $5,000,000 | $5,000,000 | UFA | ||
| Total | - | $1,000,000 | $4,000,000 | $5,000,000 | $5,000,000 |
Jason Zucker signed a $5,300,000 1-year contract with the Arizona Coyotes and General Manager Bill Armstrong on July 1, 2023 with an AAV of $5,300,000. This contract will start in 2023-24 and end after the 2023-24 season. In the first season of the contract the cap hit was equivalent to 6.35% of the salary cap.
Standard Contract (UFA) ( ) (0 ratings)
| Season | Age* | Clause | Cap Hit | AAV | Perf. Bonus | Sign. Bonus | Salary | Compensation | Minors Salary | Status | |
|---|---|---|---|---|---|---|---|---|---|---|---|
| 2023-24 | 31 | $5,300,000 | $5,300,000 | - | - | $5,300,000 | $5,300,000 | $5,300,000 | UFA | ||
| Total | - | - | $5,300,000 | $5,300,000 | $5,300,000 |
Jason Zucker signed a $27,500,000 5-year contract with the Minnesota Wild and General Manager Paul Fenton on July 25, 2018 with an AAV of $5,500,000. This contract will start in 2018-19 and end after the 2022-23 season. In the first season of the contract the cap hit was equivalent to 6.92% of the salary cap.
Standard Contract (RFA) ( ) (0 ratings)
| Season | Age* | Clause | Cap Hit | AAV | Perf. Bonus | Sign. Bonus | Salary | Compensation | Minors Salary | Status | |
|---|---|---|---|---|---|---|---|---|---|---|---|
| 2018-19 | 26 | $5,500,000 | $5,500,000 | - | - | $5,000,000 | $5,000,000 | $5,000,000 | RFA-arb | ||
| 2019-20 | 27 | M-NTC | $5,500,000 | $5,500,000 | - | - | $6,250,000 | $6,250,000 | $6,250,000 | UFA | |
| 2020-21 | 28 | M-NTC | $5,500,000 | $5,500,000 | - | - | $4,800,000 | $4,800,000 | $4,800,000 | UFA | |
| 2021-22 | 29 | M-NTC | $5,500,000 | $5,500,000 | - | - | $6,250,000 | $6,250,000 | $6,250,000 | UFA | |
| 2022-23 | 30 | M-NTC | $5,500,000 | $5,500,000 | - | - | $5,200,000 | $5,200,000 | $5,200,000 | UFA | |
| Total | - | - | $27,500,000 | $27,500,000 | $27,500,000 |
Jason Zucker signed a $1,800,500 2-year contract with the Minnesota Wild and General Manager Chuck Fletcher on July 15, 2014 with an AAV of $900,250. This contract will start in 2014-15 and end after the 2015-16 season. In the first season of the contract the cap hit was equivalent to 1.30% of the salary cap.
Standard Contract (RFA) ( ) (0 ratings)
| Season | Age* | Clause | Cap Hit | AAV | Perf. Bonus | Sign. Bonus | Salary | Compensation | Minors Salary | Status | |
|---|---|---|---|---|---|---|---|---|---|---|---|
| 2014-15 | 22 | $900,250 | $900,250 | - | - | $850,500 | $850,500 | $67,500 | RFA | ||
| 2015-16 | 23 | $900,250 | $900,250 | - | - | $950,000 | $950,000 | $950,000 | RFA-arb | ||
| Total | - | - | $1,800,500 | $1,800,500 | $1,017,500 |
Jason Zucker signed a $2,315,000 3-year contract with the Minnesota Wild and General Manager Chuck Fletcher on March 27, 2012 with an AAV of $771,667. This contract will start in 2011-12 and end after the 2013-14 season. In the first season of the contract the cap hit was equivalent to 1.20% of the salary cap.
Entry Level Contract ( ) (0 ratings)
| Season | Age* | Clause | Cap Hit | AAV | Perf. Bonus | Sign. Bonus | Salary | Compensation | Minors Salary | Status | |
|---|---|---|---|---|---|---|---|---|---|---|---|
| 2011-12 | 19 | $771,667 | $833,333 | - | - | $700,000 | $700,000 | $67,500 | ELC | ||
| 2012-13 | 20 | $771,667 | $833,333 | $185,000 | - | $715,000 | $715,000 | $67,500 | ELC | ||
| 2013-14 | 21 | $771,667 | $833,333 | - | - | $900,000 | $900,000 | $67,500 | ELC | ||
| Total | $185,000 | - | $2,315,000 | $2,315,000 | $202,500 |
Career Statistics
| Regular Season | Playoffs | |||||||||||||||||||
|---|---|---|---|---|---|---|---|---|---|---|---|---|---|---|---|---|---|---|---|---|
| Season | League | Team | GP | G | A | Pts | +/- | PIM | Shots | Sh% | TOI/G | GP | G | A | Pts | +/- | PIM | Shots | Sh% | TOI/G |
| 2007-08 | Minor-MI | Det. Compuware | 42 | 29 | 35 | 64 | ||||||||||||||
| 2007-08 | MWEHL | Det. Compuware | 30 | 17 | 21 | 38 | 30 | |||||||||||||
| 2008-09 | NAHL | USNTDP | 36 | 11 | 5 | 16 | 55 | |||||||||||||
| 2008-09 | U-18 | USNTDP | 16 | 2 | 6 | 8 | 8 | |||||||||||||
| 2008-09 | U-17 | USNTDP | 12 | 8 | 6 | 14 | ||||||||||||||
| 2008-09 | WJ18-A | USA | 7 | 1 | 5 | 6 | ||||||||||||||
| 2009-10 | U-18 | USNTDP | 38 | 18 | 17 | 35 | 24 | |||||||||||||
| 2009-10 | USHL | USNTDP | 22 | 11 | 7 | 18 | 23 | |||||||||||||
| 2009-10 | WJ18-A | USA | 7 | 4 | 3 | 7 | 2 | |||||||||||||
| 2009-10 | WJC-A | USA | 7 | 2 | 0 | 2 | 2 | |||||||||||||
| 2010-11 | WCHA | U. of Denver | 40 | 23 | 22 | 45 | 59 | |||||||||||||
| 2010-11 | WJC-A | USA | 4 | 1 | 0 | 1 | ||||||||||||||
| 2011-12 | WCHA | U. of Denver | 38 | 22 | 24 | 46 | 38 | |||||||||||||
| 2011-12 | NHL | Minnesota Wild | 6 | 0 | 2 | 2 | -2 | 2 | 10 | 0.0 | 11:02 | |||||||||
| 2011-12 | WJC-A | USA | 6 | 3 | 4 | 7 | +1 | 2 | ||||||||||||
| 2012-13 | NHL | Minnesota Wild | 20 | 4 | 1 | 5 | +4 | 8 | 34 | 11.8 | 11:16 | 5 | 1 | 1 | 2 | +1 | 11 | 9.1 | 13:29 | |
| 2012-13 | AHL | Houston | 55 | 24 | 26 | 50 | -6 | 43 | 205 | 1,171.0 | 1 | 4 | 1 | 0.0 | ||||||
| 2013-14 | AHL | Iowa | 22 | 8 | 5 | 13 | -8 | 55 | 80 | 1,000.0 | ||||||||||
| 2013-14 | NHL | Minnesota Wild | 21 | 4 | 1 | 5 | +2 | 2 | 40 | 10.0 | 12:59 | |||||||||
| 2014-15 | NHL | Minnesota Wild | 51 | 21 | 5 | 26 | -9 | 18 | 124 | 16.9 | 15:04 | 10 | 2 | 1 | 3 | -1 | 2 | 21 | 9.5 | 14:11 |
| 2015-16 | NHL | Minnesota Wild | 71 | 13 | 10 | 23 | -4 | 20 | 158 | 8.2 | 15:35 | 6 | 2 | 2 | -4 | 2 | 3 | 0.0 | 13:56 | |
| 2016-17 | NHL | Minnesota Wild | 79 | 22 | 25 | 47 | +34 | 30 | 172 | 12.8 | 15:17 | 5 | 1 | 1 | -1 | 2 | 20 | 5.0 | 17:15 | |
| 2017-18 | NHL | Minnesota Wild | 82 | 33 | 31 | 64 | +8 | 44 | 222 | 14.9 | 16:58 | 5 | -4 | 8 | 0.0 | 16:27 | ||||
| 2018-19 | NHL | Minnesota Wild | 81 | 21 | 21 | 42 | -9 | 28 | 214 | 9.8 | 17:05 | |||||||||
| 2019-20 | NHL | Minnesota Wild | 45 | 14 | 15 | 29 | -3 | 19 | 75 | 18.7 | 15:54 | |||||||||
| 2019-20 | NHL | Pittsburgh Penguins | 15 | 6 | 6 | 12 | -1 | 2 | 36 | 16.7 | 17:40 | 4 | 2 | 2 | 12 | 16.7 | 17:14 | |||
| 2020-21 | NHL | Pittsburgh Penguins | 38 | 9 | 9 | 18 | -8 | 21 | 67 | 13.4 | 15:41 | 6 | 2 | 1 | 3 | -1 | 2 | 12 | 16.7 | 15:25 |
| 2021-22 | NHL | Pittsburgh Penguins | 41 | 8 | 9 | 17 | -2 | 15 | 102 | 7.8 | 14:49 | 5 | 2 | 2 | -3 | 2 | 9 | 0.0 | 13:45 | |
| 2022-23 | NHL | Pittsburgh Penguins | 78 | 27 | 21 | 48 | -4 | 47 | 197 | 13.7 | 15:39 | |||||||||
| 2023-24 | NHL | Arizona Coyotes | 51 | 9 | 16 | 25 | -5 | 58 | 104 | 8.7 | 14:02 | |||||||||
| 2023-24 | NHL | Nashville Predators | 18 | 5 | 2 | 7 | -4 | 23 | 46 | 10.9 | 13:13 | 6 | 1 | 2 | 3 | +4 | 2 | 17 | 5.9 | 14:18 |
| 2024-25 | NHL | Buffalo Sabres | 73 | 21 | 32 | 53 | +4 | 57 | 143 | 14.7 | 16:00 | |||||||||
| 2025-26 | NHL | Buffalo Sabres | 62 | 24 | 21 | 45 | -5 | 23 | 128 | 18.8 | 15:37 | 13 | 2 | 2 | 4 | -4 | 4 | 18 | 11.1 | 14:33 |
| NHL Career | 832 | 241 | 227 | 468 | -4 | 417 | 1872 | 12.9 | 15:31 | 65 | 11 | 11 | 22 | -13 | 16 | 131 | 8.4 | 14:52 | ||