
 David Pastrnak
| Position | Right Wing | Current Team | Boston Bruins |
| Shoots | Right | Current Contract | 8 years ($11.2M CapHit) |
| Height | 6'0" | Expires | 2030-31 |
| Weight (lbs) | 199 | Expiry Age (Jun 30) | 35 |
| Age (DOB) | 30 (May 25, 1996) | Expiry Status | UFA |
| Drafted | 2014, Round 1, Overall 25 (BOS) |
| Date | Team | Transaction | |
|---|---|---|---|
| Mar 2, 2023 | Boston Bruins | Signed 8 years @ $11.250M AAV starting in 2023-24 | |
| Sep 14, 2017 | Boston Bruins | Signed 6 years @ $6.667M AAV starting in 2017-18 | |
| Jul 15, 2014 | Boston Bruins | Signed to an entry level contract. |
Player Card(s)
URL: https://thestanleycap.com/cdn/player_cards/20252026/david-pastrnak-8477956.png
URL: https://thestanleycap.com/cdn/player_cards/20242025/david-pastrnak-8477956.png
URL: https://thestanleycap.com/cdn/player_cards/20232024/david-pastrnak-8477956.png
About Player Cards
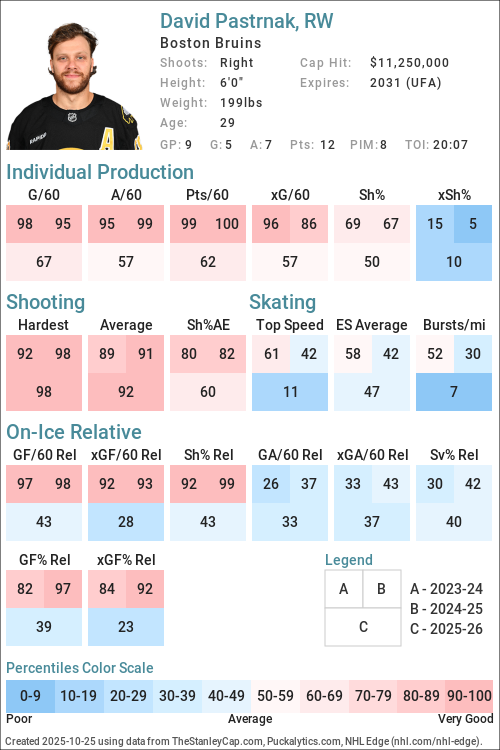
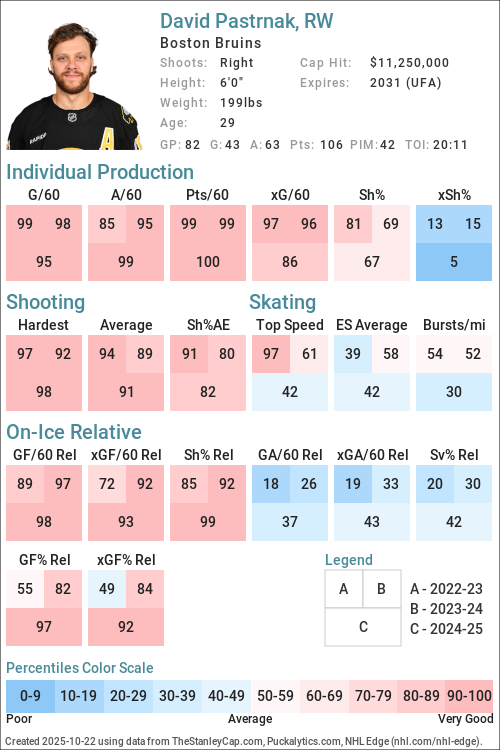
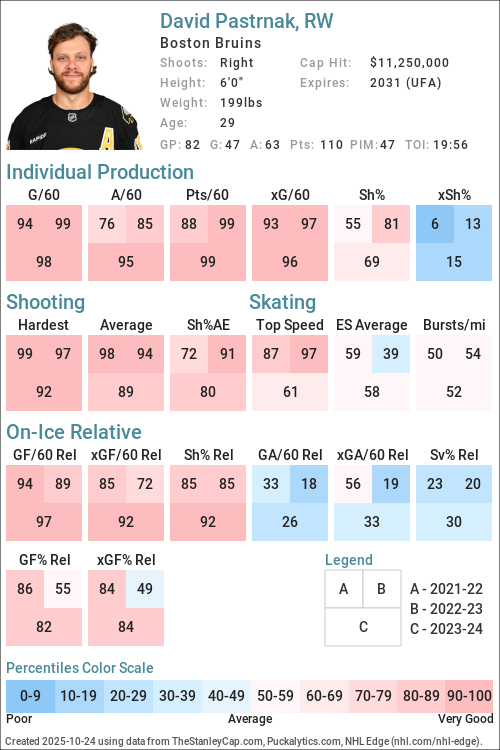
Player cards present an infographic of a players performance using a series of Player Archetypes developed for Puckalytics.com and TheStanleyCap.com. The boxes in the rink image show the archetype ratings for the season specified in the card while the graphs to the right show the five-year trends for those archetypes.
Except for Faceoffs, the values shown are the players z-score (standard deviation from the mean) for the specific metric used to calculate the archetype values. When calculating z-scores forwards were compared to forwards and defensemen were compared to defensemen. Positive values indicate the player is above average and shaded in blue, while negative values indicate the player is below average and shaded in pink. The five year trend charts show a range of -4.0 to 4.0.
The value shown for Faceoffs is the faceoff winning percentage rather than their z-score with winning percentages below 50 in pink shades and above 50 in blue shades.
All archetypes are 5v5 except 5v4 TOI, 4v5 TOI, Skating (even strength) and Faceoffs (all situations). Archetypes use regular season data only.
Archetypes Summary
- Sniper - Measures the to score above the expected goal rate.
- Rebound - Measures the percent of a players shot attempts that come from rebounds (forwards only).
- 5v4 TOI - Powerplay ice time, calculated as the percentage of his teams 5v4 ice time that the player was on the ice for.
- Shooter - Measures whether a players points come from shots (goals or assists on rebounds from his shots).
- Producer - Measures a players ability to produce goals and assists, adjusted for quality of teammates.
- Playmaker - Measures whether a players points come from passes.
- Drive - Measures a players ability to drive puck possession and generate shot attempts for his team.
- Rush - Measures the percent of a players shot attempts that come from rush plays
- Possession - An indicator of a players ability to improve his teams puck possession game.
- Faceoffs - Faceoff Winning Percentage (min. 75 faceoffs taken).
- 5v5 TOI - The percentage of his teams 5v5 TOI that the player was on the ice for.
- Suppress - Measures a players ability to suppress opponent puck possession and shot attempts against.
- Skating - An indicator of a players skating ability, or speed bursts above 20mph per mile skated.
- Defend - An indicator of a players ability to suppress shot quality against.
- 4v5 TOI - Penalty Kill ice time, calculated as the percentage of his teams 4v5 ice time that the player was on the ice for.
Data Sources
- Salary data is from TheStanleyCap.com
- Skating data is from NHL Edge
- Other statistics are from Puckalytics.com and derived from data from NHL.com
Terms of Use
You are free to use include player cards in written articles, share on social media, or on other public websites under the following conditions:
- You credit TheStanleyCap.com as the source and provide a link back to TheStanleyCap.com or this player page.
- You do not mass copy/duplicate/publish dozens or hundreds of player cards. A few, or a handful for a written article is fine. Be reasonable. Fair use rules apply.
- If you are a high-traffic website you must download and host the image(s) on your site rather than overload TheStanleyCap servers with traffic.
Note: Player cards will update daily throughout the season so if you want to include snapshot then you must download the image.
If you have any questions, send an e-mail to the e-mail address at the top of this page.
Read Introducing Player Archetypes on HockeyAnalysis.com for more details on archetype calculations.
Core Archetypes
| Season | Team(s) | GP | TOI | Producer | Playmaker | Shooter | Sniper | Rebound | Rush | Skating | Defend |
|---|---|---|---|---|---|---|---|---|---|---|---|
| 2015-16 | BOS | 51 | 1.21 | -0.68 | 2.86 | 2.06 | -1.04 | -0.33 | - | 1.08 | |
| 2016-17 | BOS | 75 | 1.15 | -0.30 | 1.62 | 0.59 | -1.15 | 0.27 | - | 0.11 | |
| 2017-18 | BOS | 82 | 1.96 | 1.25 | 1.15 | 0.99 | -0.04 | -0.29 | - | 0.92 | |
| 2018-19 | BOS | 66 | 1.47 | -0.39 | 2.52 | 1.31 | -1.41 | 2.07 | - | -1.88 | |
| 2019-20 | BOS | 70 | 2.30 | 0.20 | 2.79 | 1.12 | -1.35 | 0.39 | - | -0.43 | |
| 2020-21 | BOS | 48 | 1.54 | -0.13 | 2.11 | 0.56 | -0.88 | 0.84 | - | -1.27 | |
| 2021-22 | BOS | 72 | 1.09 | -0.35 | 1.96 | 0.57 | -1.08 | 0.21 | -0.17 | -0.72 | |
| 2022-23 | BOS | 82 | 3.05 | 0.20 | 4.00 | 1.33 | -1.32 | 0.88 | -0.09 | -0.80 | |
| 2023-24 | BOS | 82 | 2.78 | 0.60 | 2.93 | 0.76 | -0.65 | 1.16 | -0.12 | -0.45 | |
| 2024-25 | BOS | 82 | 4.15 | 2.89 | 2.18 | 0.83 | -1.57 | 1.07 | -0.61 | -0.17 | |
| 2025-26 | BOS | 77 | 2.54 | 3.15 | 0.29 | 0.01 | -0.74 | -0.37 | -0.97 | -1.14 |
Situational and Secondary Archetypes
| Season | Team(s) | GP | TOI | 5v5 TOI | 5v4 TOI | 4v5 TOI | Possession | Drive | Suppress | Faceoffs |
|---|---|---|---|---|---|---|---|---|---|---|
| 2015-16 | BOS | 51 | 0.55 | -1.53 | -1.96 | -0.06 | 0.19 | -0.49 | - | |
| 2016-17 | BOS | 75 | 1.26 | 0.90 | -2.01 | 1.05 | 1.57 | -0.09 | - | |
| 2017-18 | BOS | 82 | 1.02 | 1.11 | -2.00 | -0.11 | 0.22 | -0.50 | - | |
| 2018-19 | BOS | 66 | 1.05 | 1.34 | -1.95 | 0.95 | 1.01 | 0.17 | - | |
| 2019-20 | BOS | 70 | 1.26 | 1.56 | -1.92 | 1.10 | 0.95 | 0.58 | - | |
| 2020-21 | BOS | 48 | 1.29 | 1.53 | -2.18 | 2.36 | 2.12 | 1.85 | - | |
| 2021-22 | BOS | 72 | 1.01 | 1.66 | -1.98 | 1.46 | 1.43 | 0.72 | - | |
| 2022-23 | BOS | 82 | 1.53 | 1.39 | -1.86 | 0.28 | 0.49 | -0.23 | - | |
| 2023-24 | BOS | 82 | 1.41 | 1.71 | -1.97 | 1.37 | 1.59 | -0.12 | - | |
| 2024-25 | BOS | 82 | 1.80 | 1.34 | -2.11 | 1.22 | 1.17 | 0.21 | - | |
| 2025-26 | BOS | 77 | 1.96 | 1.53 | -1.95 | -0.50 | -0.60 | 0.00 | - |
5v5 Individual Stats
| Season | Team(s) | GP | TOI | G/60 | A/60 | Pts/60 | xG/60 | GAE/60 | Sh% | xSh% | Sh%AE | %SA Rush | %SA Reb. |
|---|---|---|---|---|---|---|---|---|---|---|---|---|---|
| 2015-16 | BOS | 51 | 659:15 | 1.18 | 0.73 | 1.91 | 0.60 | 0.58 | 13.98 | 7.12 | 6.86 | 3.39 | 2.54 |
| 2016-17 | BOS | 75 | 1060:53 | 1.02 | 1.07 | 2.09 | 0.83 | 0.19 | 10.53 | 8.56 | 1.97 | 4.58 | 2.50 |
| 2017-18 | BOS | 82 | 1124:32 | 1.01 | 1.49 | 2.51 | 0.75 | 0.27 | 12.75 | 9.41 | 3.35 | 3.40 | 4.85 |
| 2018-19 | BOS | 66 | 929:34 | 1.29 | 1.16 | 2.45 | 0.90 | 0.39 | 13.99 | 9.71 | 4.28 | 8.29 | 1.95 |
| 2019-20 | BOS | 70 | 979:07 | 1.41 | 1.41 | 2.82 | 0.98 | 0.43 | 12.92 | 9.02 | 3.91 | 4.68 | 2.13 |
| 2020-21 | BOS | 48 | 671:43 | 1.25 | 1.34 | 2.59 | 0.97 | 0.28 | 11.02 | 8.54 | 2.49 | 5.52 | 3.31 |
| 2021-22 | BOS | 72 | 986:44 | 1.28 | 1.22 | 2.49 | 1.04 | 0.24 | 10.61 | 8.61 | 2.00 | 4.44 | 3.33 |
| 2022-23 | BOS | 82 | 1168:25 | 1.75 | 1.39 | 3.13 | 1.19 | 0.55 | 13.55 | 9.25 | 4.29 | 5.52 | 3.07 |
| 2023-24 | BOS | 82 | 1197:32 | 1.40 | 1.55 | 2.96 | 1.05 | 0.35 | 11.76 | 8.81 | 2.95 | 6.31 | 6.01 |
| 2024-25 | BOS | 82 | 1258:40 | 1.19 | 1.95 | 3.15 | 0.90 | 0.29 | 12.20 | 9.22 | 2.98 | 4.06 | 2.95 |
| 2025-26 | BOS | 77 | 1179:04 | 0.81 | 1.88 | 2.70 | 0.87 | -0.05 | 9.47 | 10.09 | -0.62 | 2.06 | 5.76 |
5v5 On Ice Stats
| Season | Team(s) | GP | TOI | SAF/60 | GF/60 | xGF/60 | SAA/60 | GA/60 | xGA/60 | GF% | xGF% | xGF Rel | xGA Rel | xGF% Rel |
|---|---|---|---|---|---|---|---|---|---|---|---|---|---|---|
| 2015-16 | BOS | 51 | 659:15 | 41.32 | 2.46 | 1.97 | 43.96 | 2.00 | 2.32 | 55.10 | 45.93 | -0.16 | 0.18 | -4.01 |
| 2016-17 | BOS | 75 | 1060:53 | 50.34 | 2.94 | 2.74 | 36.99 | 2.32 | 2.12 | 55.91 | 56.33 | 0.60 | 0.19 | 3.77 |
| 2017-18 | BOS | 82 | 1124:32 | 45.62 | 3.20 | 2.65 | 39.54 | 1.92 | 2.19 | 62.50 | 54.84 | 0.24 | 0.21 | -0.12 |
| 2018-19 | BOS | 66 | 929:34 | 47.64 | 3.36 | 2.83 | 38.21 | 2.45 | 2.33 | 57.78 | 54.86 | 0.54 | 0.14 | 3.72 |
| 2019-20 | BOS | 70 | 979:07 | 45.04 | 3.62 | 2.62 | 38.67 | 1.96 | 2.26 | 64.84 | 53.68 | 0.39 | 0.21 | 1.56 |
| 2020-21 | BOS | 48 | 671:43 | 52.61 | 3.57 | 2.80 | 32.69 | 2.32 | 1.86 | 60.61 | 60.06 | 0.56 | -0.30 | 9.14 |
| 2021-22 | BOS | 72 | 986:44 | 51.93 | 3.65 | 3.06 | 35.94 | 2.31 | 2.09 | 61.22 | 59.37 | 0.52 | 0.03 | 4.25 |
| 2022-23 | BOS | 82 | 1168:25 | 45.14 | 3.80 | 3.03 | 40.82 | 2.11 | 2.57 | 64.35 | 54.10 | 0.25 | 0.20 | 0.14 |
| 2023-24 | BOS | 82 | 1197:32 | 45.14 | 3.66 | 2.80 | 43.49 | 2.30 | 2.55 | 61.34 | 52.27 | 0.57 | 0.20 | 3.62 |
| 2024-25 | BOS | 82 | 1258:40 | 41.33 | 3.43 | 2.72 | 40.85 | 2.53 | 2.51 | 57.60 | 52.07 | 0.69 | 0.19 | 5.38 |
| 2025-26 | BOS | 77 | 1179:04 | 38.88 | 3.21 | 2.65 | 41.07 | 2.60 | 2.75 | 55.26 | 49.07 | 0.25 | 0.14 | 1.08 |
NHL Edge Stats
| Skating | Shooting | Zone Time | |||||||||||
|---|---|---|---|---|---|---|---|---|---|---|---|---|---|
| Season | GP | Top Speed | Bursts>20/mi | Avg. Speed | Top Speed | Avg. Speed | %Long Range | %Mid Range | %High Danger | ES DZ% | ES NZ% | ES OZ% | |
| This table is for Basic and Premium subscribers only. To view please login to and/or subscribe to one of our subscription plans. | |||||||||||||
Legend
| Percentile 0-25 | Percentile 25-50 | Percentile 50-75 | Percentile 75-100 |
5v5 Lines
| Season | Teammate | Teammate | Team | TOI | GF/60 | GA/60 | GF% | xGF/60 | xGA/60 | xGF% | xGF Rel | xGA Rel | xGF% Rel |
|---|
Glossary
| Type | Statistic | Definition |
|---|---|---|
| Individual | G/60 | Goals Against per 60 minutes. |
| Individual | A/60 | Assists per 60 minutes. |
| Individual | Pts/60 | Points per 60 minutes. |
| Individual | xG/60 | Expected Goals per 60 minutes. |
| Individual | GAE/60 | Goals Above Expected (G/60 - xG/60). |
| Individual | Sh% | Shooting Percentage. |
| Individual | xSh% | Expected Shooting Percentage. |
| Individual | Sh%AE | Shooting percentage above expected (Sh% - xSh%). |
| Individual | %SA Rush | Percentage of shot attempts determined to be on the rush. |
| Individual | %SA Reb. | Percentage of shot attempts determined to be from rebounds. |
| On Ice | SAF/60 | Shot Attempts For per 60 minutes. |
| On Ice | GF/60 | Goals For per 60 minutes. |
| On Ice | xGF/60 | Expected Goals For per 60 minutes. |
| On Ice | SAA/60 | Shot Attempts Against per 60 minutes (lower is better). |
| On Ice | GA/60 | Goals Against per 60 minutes (lower is better). |
| On Ice | xGA/60 | Expected Goals Against per 60 minutes (lower is better). |
| On Ice | GF% | Goals For Percentage = Goals For / (Goals For + Goals Against) |
| On Ice | xGF% | Expected Goals For Percentage = Expected Goals For / (Expected Goals For + Expected Goals Against) |
| On Ice | xGF Rel | xGF/60 when On Ice - xGF/60 when not On Ice. |
| On Ice | xGA Rel | xGA/60 when On Ice - xGA/60 when not On Ice (lower is better). |
| On Ice | xGF% Rel | xGF% when On Ice - xGF% when not On Ice. |
News and Opinions
-
2026-27 Bruins lineup 1.0: Predicting Boston’s lines, D pairs after start to offseason at Boston.com (Thu Jul 16, 2026)
-
What if the Bruins pick David Pastrnak as the 2026-27 captain? at Causway Crowd (Wed Jul 15, 2026)
-
Hurricanes Stanley Cup win puts Bruins' front office on the clock following superstars' quote at Causway Crowd (Tue Jun 16, 2026)
-
Bruins Report Card: Two Stars Shine, One Question Remains at Boston Hockey Now (Mon Jun 15, 2026)
-
One stat proves that David Pastrnak deserved the Hart Trophy more than Nikita Kucherov at Causway Crowd (Sun Jun 14, 2026)
-
David Pastrnak adds another award to his illustrious career at Causway Crowd (Sun Jun 14, 2026)
-
Daily Bean: All-Star, All-Rookie Teams; Contract Negotiations, Darnell Nurse Targets at Boston Hockey Now (Sat Jun 13, 2026)
-
Hart Trophy voting revealed an unexpected Bruins standout beyond David Pastrnak at Causway Crowd (Fri Jun 12, 2026)
-
Pastrnak and Swayman Earn Hart Trophy Votes at The Hockey Writers (Fri Jun 12, 2026)
-
David Pastrnak powered the Bruins in one area that fans never expected in 2025-26 at Causway Crowd (Mon Jun 1, 2026)
-
History of the Bruins’ 7th Player Award at The Hockey Writers (Mon May 25, 2026)
-
Boston Bruins News: Alex Steeves, David Pastrnak, decision on NHL front office lurking at Causway Crowd (Mon May 11, 2026)
-
VIDÉO : David Pastrnak démolit son équipe dans le vestiaire pendant un match at Dans Les Coulisses (Fri May 8, 2026)
-
7 takeaways from Bruins’ end-of-season press conference at Boston.com (Wed May 6, 2026)
-
2026 Elimination Eval: Boston Bruins at Blue Shirt Banter (Mon May 4, 2026)
-
Bruins' David Pastrnak praises Sabres after Buffalo advances in 2026 NHL Playoffs at Sabres Noise (Sat May 2, 2026)
-
That’s It: Breaking Apart Bruins Season-Ending Loss at Boston Hockey Now (Sat May 2, 2026)
-
Bruins Need Someone to Step Up in Order to Win Game 6 at The Hockey Writers (Thu Apr 30, 2026)
-
David Pastrnak’s heartfelt moment with Bruce Cassidy steals post-Game 5 spotlight at Causway Crowd (Thu Apr 30, 2026)
-
Boston Bruins News: Bad injury updates, NHL captain addresses future, David Pastrnak at Causway Crowd (Thu Apr 30, 2026)
-
Bruins’ Marat Khusnutdinov has 0 points this postseason. It hasn’t stopped him from playing winning hockey. at Boston.com (Wed Apr 29, 2026)
-
Former Bruins coach Bruce Cassidy predicted David Pastrnak’s OT goal on TNT at Boston.com (Wed Apr 29, 2026)
-
David Pastrnak scores 9:14 into OT and Bruins avoid elimination with 2-1 win over Sabres at NBC Sports (Wed Apr 29, 2026)
-
David Pastrnak scores 9:14 into OT and Bruins avoid elimination with 2-1 win over Sabres at Yahoo Sports NHL (Wed Apr 29, 2026)
-
Recap: Pastrnak’s OT winner extends series at Yahoo Sports NHL (Wed Apr 29, 2026)
-
With Bruins’ season on the line, David Pastrnak and Boston’s big guns finally delivered in Game 5 at Boston.com (Wed Apr 29, 2026)
-
Game 5 proves why Bruins cannot and will not trade David Pastrnak at Causway Crowd (Wed Apr 29, 2026)
-
David Pastrnak sends clear message to fans after Bruins Game 5 overtime win over Sabres at Causway Crowd (Wed Apr 29, 2026)
-
Pastrnak scores 9:14 into OT and Boston Bruins avoid elimination with win over Buffalo Sabres at Yahoo Sports NHL (Wed Apr 29, 2026)
-
SÉRIES 2026: David Pastrnak donne la victoire aux Bruins et s'engueule avec un partisan at HABSolument Fan (Wed Apr 29, 2026)
-
Watch: David Pastrnak keeps Bruins’ season alive with OT goal in Game 5 vs. Buffalo at Boston.com (Wed Apr 29, 2026)
-
Pastrnak, Swayman come up clutch as Bruins beat Sabres to extend series at Yahoo Sports NHL (Tue Apr 28, 2026)
-
Radio host raises stakes for David Pastrnak, Charlie McAvoy in must-deliver Game 5 at Causway Crowd (Tue Apr 28, 2026)
-
Why Bruins fans better hope David Pastrnak wasn’t being honest after Game 4 at Causway Crowd (Mon Apr 27, 2026)
-
Bruins-Sabres Game 4 takeaways: B's need much more from David Pastrnak at Yahoo Sports NHL (Sun Apr 26, 2026)
-
NHL Player Props & Best Bets for Today, April 26: Don't Drai This at Home at Yahoo Sports NHL (Sun Apr 26, 2026)
-
3 possible lineup tweaks for Bruins entering Game 4 vs. Sabres at Boston.com (Fri Apr 24, 2026)
-
David Pastrnak said what every Bruins fan knew after frustrating Game 3 loss to Sabres at Causway Crowd (Fri Apr 24, 2026)
-
Bruins insider gives insight on naming of captain at Causway Crowd (Fri Apr 17, 2026)
-
Boston Bruins News: David Pastrnak, James Hagens, NHL coach snaps after loss at Causway Crowd (Thu Apr 16, 2026)
-
Pastrnak’s Bruins Legacy Grows with Latest 100-Point Season at The Hockey Writers (Wed Apr 15, 2026)
-
Bruins still have lineup questions to sort out before playoffs — starting with their top line at Boston.com (Mon Apr 13, 2026)
-
David Pastrnak will pay it forward with mentorship of James Hagens at Causway Crowd (Fri Apr 10, 2026)
-
Hurricanes overcome Geekie's hat trick, top Bruins in OT to claim the Metropolitan Division title at Yahoo Sports NHL (Tue Apr 7, 2026)
-
Boston Bruins News: General Manager fired, Marco Sturm, Morgan Geekie, David Pastrnak at Causway Crowd (Tue Apr 7, 2026)
-
Takeaways: Porter Martone scores his first in OT, Flyers move into playoff spot beating Bruins 2-1 at Broad Street Hockey (Sun Apr 5, 2026)
-
Bruins' Pastrnak had a 12 game point streak which is vital for the playoffs at Causway Crowd (Mon Mar 30, 2026)
-
Is David Pastrnak a true Hart Trophy contender? Elliotte Friedman thinks so at Causway Crowd (Fri Mar 27, 2026)
-
Bruins Rally Late for Massive Road Win at Boston Hockey Now (Thu Mar 26, 2026)
-
Bruins Beat Red Wings, Pick Up Big Win in Playoff Push at Boston Hockey Now (Sun Mar 22, 2026)
-
Red Wings-Bruins Tweetcap: Boston holds Sway in Detroit at The Malik Report (Sat Mar 21, 2026)
-
Pastrnak, Reichel, Four More Lift Bruins to Five-Goal Win Over Jets at Boston Hockey Now (Thu Mar 19, 2026)
-
Daily Bean: Bruins Lose, Another Gameday, World Cup Hosts Announced at Boston Hockey Now (Tue Mar 17, 2026)
-
Bruins superstar David Pastrnak's latest honor shows how NHL views him as a player at Causway Crowd (Tue Mar 17, 2026)
-
Canadiens vs. Bruins: Game preview, start time, Tale of the Tape, and how to watch at Habs Eyes on the Prize (Tue Mar 17, 2026)
-
Second Period Collapse: Breaking Apart Bruins’ OT Loss to Devils at Boston Hockey Now (Tue Mar 17, 2026)
-
Boston Bruins News: David Pastrnak, Marco Sturm, former forward recalled at Causway Crowd (Sat Mar 14, 2026)
-
With ‘top guys’ struggling, a lineup reshuffle might be needed for Bruins at Boston.com (Fri Mar 13, 2026)
-
The Bruins might be finding out who Elias Lindholm really is after recent stretch at Causway Crowd (Fri Mar 13, 2026)
-
James Hagens’ potential signing could shake up three struggling Bruins lines at Causway Crowd (Wed Mar 11, 2026)
-
Boston Bruins News: David Pastrnak, Brad Marchand, standings help, more at Causway Crowd (Tue Mar 10, 2026)
-
Bruins' David Pastrnak broke his scoring drought at just the right time at Causway Crowd (Mon Mar 9, 2026)
-
Blown Lead, Road Loss: Breaking Apart the Bruins’ Loss in Pittsburgh at Boston Hockey Now (Mon Mar 9, 2026)
-
Blown Lead, Road Loss: Breaking Apart the Bruins’ Loss in Pittsburgh at Boston Hockey Now (Mon Mar 9, 2026)
-
Capitals vs Bruins Prediction, Picks & Odds for Today’s NHL Game at Yahoo Sports NHL (Sat Mar 7, 2026)
-
Why David Pastrnak's Olympic performance wasn't as bad as some would think at Causway Crowd (Sun Feb 22, 2026)
-
Bruins’ Pastrnak Scores; Four Players Still Competing for Gold at Boston Hockey Now (Thu Feb 19, 2026)
-
Boston Bruins News: David Pastrnak, Michael DiPietro, Olympics, prospects in Boston at Causway Crowd (Wed Feb 18, 2026)
-
Bruins David Pastrnak says the quiet part out loud about Team Canada in the Olympics at Causway Crowd (Tue Feb 17, 2026)
-
Bruins’ Pastrnak Says He Needs to Be Better as Czechia Enters Playoffs at Boston Hockey Now (Tue Feb 17, 2026)
-
Czechia looking for Pastrnak to step up in do-or-die game at Causway Crowd (Tue Feb 17, 2026)
-
David Pastrnak vs. the World: Czechia's hopes rest on Bruins superstar at Causway Crowd (Mon Feb 16, 2026)
-
Daily Bean: USA Men’s Gameday, Swayman Starts; Fiala to Miss Rest of Season at Boston Hockey Now (Sat Feb 14, 2026)
-
Olympic Hockey Recap: Canucks’ Hronek & Kämpf find scoresheet in Czechia’s 6-3 win; Celebrini scores in Canada’s 5-1 victory at Canucks Army (Fri Feb 13, 2026)
-
Bruins’ Pastrnak Scores First Olympic Goal, Adds Assist in Czechia Win at Boston Hockey Now (Fri Feb 13, 2026)
-
Boston Bruins News: David Pastrnak, Jaromir Jagr, Charlie McAvoy, Sandis Vilmanis at Causway Crowd (Wed Feb 11, 2026)
-
Bruins’ Pastrnak and McAvoy Named Alternate Captain At Olympics at Boston Hockey Now (Sun Feb 8, 2026)
-
Boston Bruins News: David Pastrnak, NHL disciplinary action taken, Olympics at Causway Crowd (Sat Feb 7, 2026)
-
Boston Bruins News: David Pastrnak, Brad Marchand, Mikey Eyssimont, Olympics at Causway Crowd (Thu Feb 5, 2026)
-
David Pastrnak will be a flag-bearer for Czechia at Winter Olympics opening ceremony at Boston.com (Thu Feb 5, 2026)
-
David Pastrnak echoed every Bruins' fan thoughts after bizarre loss to Lighting at Causway Crowd (Mon Feb 2, 2026)
-
‘It’s a joke’: David Pastrnak, Bruins vent after controversial OT call in Stadium Series at Boston.com (Mon Feb 2, 2026)
-
11 takeaways from Bruins’ wild shootout loss to Lightning in Stadium Series at Boston.com (Mon Feb 2, 2026)
-
‘That Hurts A Lot:’ Bruins Blow Four-Goal Lead, Lose in Stadium Series at Boston Hockey Now (Mon Feb 2, 2026)
-
Bruins young star Fraser Minten just confirmed what fans knew about David Pastrnak at Causway Crowd (Sun Feb 1, 2026)
-
An eventful day for Bruins started with a 4-hour bus ride and ended with an OT win at Boston.com (Wed Jan 28, 2026)
-
David Pastrnak’s Hart Trophy case is being criminally overlooked at Causway Crowd (Tue Jan 27, 2026)
-
Boston Bruins News: Morgan Geekie, David Pastrnak, Marco Sturm, New York Rangers at Causway Crowd (Mon Jan 26, 2026)
-
David Pastrnak continues to create magic for Bruins teammates at Boston.com (Sun Jan 25, 2026)
-
Boston Bruins News: Trade rumors, David Pastrnak, Montreal Canadiens at Causway Crowd (Sat Jan 24, 2026)
-
Blackhawks look for a banner effort against streaking Bruins at Blackhawk Up (Sat Jan 17, 2026)
-
Blackhawks vs. Bruins: Banner Years Celly, Preview, Lineups, & How To Watch Game 48 at Chicago Hockey Now (Sat Jan 17, 2026)
-
David Pastrnak's climb into Bruins greatness is just getting started at Causway Crowd (Wed Jan 14, 2026)
-
Pastrnak Continues Climbing Bruins’ Milestone Rankings at The Hockey Writers (Wed Jan 14, 2026)
-
10! Breaking Apart the Bruins’ Ten-Goal Showing Against the Rangers at Boston Hockey Now (Sun Jan 11, 2026)
-
Bruins make history as Pavel Zacha, Marat Khusnutdinov both score hat tricks at Boston.com (Sat Jan 10, 2026)
-
TEN Goals, Two Hat Tricks Lead Bruins to Dismantle Rangers at Boston Hockey Now (Sat Jan 10, 2026)
-
Recap: Rangers Routed 10-2 as Two Bruins Score Hat Tricks, Pastrnak Adds 6 Assists at Blue Shirt Banter (Sat Jan 10, 2026)
-
Boston Bruins News: David Pastrnak, soaring prospect, former Bruins forward scoring at Causway Crowd (Tue Jan 6, 2026)
-
Boston Bruins News: David Pastrnak, Marco Sturm, James Hagens, Will Zellers at Causway Crowd (Fri Jan 2, 2026)
-
12 bold Boston sports predictions for 2026 at Boston.com (Thu Jan 1, 2026)
-
It’s Over! Bruins Ring in New Year; Snap Losing Streak at Boston Hockey Now (Thu Jan 1, 2026)
-
Breaking Apart the Bruins Loss to the Canadiens at Boston Hockey Now (Wed Dec 24, 2025)
-
David Pastrnak labels Tuesday’s game vs. Montreal as ‘must-win’ at Boston.com (Mon Dec 22, 2025)
-
Can Bruins' David Pastrnak Carry Czechia To The Olympic Podium? at The Hockey News (Wed Dec 17, 2025)
-
Bruins' Casey Mittlestadt and David Pastrnak said what no teams want to hear at Causway Crowd (Wed Dec 17, 2025)
-
Bruins’ Holiday Wish List for 2026 at The Hockey Writers (Tue Dec 16, 2025)
-
Who's Hot And Cold In The NHL: Bruins' Pastrnak Is At It Again at The Hockey News (Mon Dec 15, 2025)
-
NHL Hat Tricks History & Fun Facts at The Hockey Writers (Fri Dec 12, 2025)
-
Marco Sturm says out loud what all Bruins fans are thinking about David Pastrnak at Causway Crowd (Fri Dec 12, 2025)
-
The Bruins’ biggest surprise this year? An ‘opportunistic’ and effective scoring punch at Boston.com (Fri Dec 12, 2025)
-
Pastrnak hits Bruins milestone as win streak reaches four games at Yahoo Sports NHL (Fri Dec 12, 2025)
-
Pastrnak nets 4 points as the Bruins beat the Jets 6-3 at Boston.com (Fri Dec 12, 2025)
-
Bruins' third-liner David Pastrnak adds to Hart Trophy campaign in return to lineup at Causway Crowd (Wed Dec 10, 2025)
-
How Marco Sturm’s lineup reshuffle paid off in Bruins’ third-straight win at Boston.com (Wed Dec 10, 2025)
-
Bruins get massive David Pastrnak injury update ahead of Blues rematch at Causway Crowd (Tue Dec 9, 2025)
-
Bruins Stepping Up and Scoring in Pastrnak’s Absence at The Hockey Writers (Tue Dec 9, 2025)
-
Boston Bruins News: David Pastrnak update, brutal snub, road warriors at Causway Crowd (Tue Dec 9, 2025)
-
4 reasons why the Bruins stayed afloat despite Pastrnak, McAvoy injuries at Boston.com (Tue Dec 9, 2025)
-
Bruins injury updates: Charlie McAvoy, David Pastrnak both expected to play on road trip at Boston.com (Mon Dec 8, 2025)
-
Boston Bruins News: Brad Marchand trolls, positive David Pastrnak update at Causway Crowd (Sun Dec 7, 2025)
-
3 Bruins Who Will Represent Their Countries at the 2026 Winter Olympics at The Hockey Writers (Sat Dec 6, 2025)
-
Boston Bruins News: Charlie McAvoy and David Pastrnak injury updates at Causway Crowd (Sat Dec 6, 2025)
-
Can the Bruins Tread Water Until the Cavalry Returns? at The Hockey Writers (Fri Dec 5, 2025)
-
Alex Steeves becomes second Bruins rookie since David Pastrnak with multi-goal game at Causway Crowd (Fri Dec 5, 2025)
-
Boston Bruins News: Jeremy Swayman, David Pastrnak, injury update, prospect demotion at Causway Crowd (Thu Dec 4, 2025)
-
David Pastrnak's injury uncertainty leaves career-changing path for Bruins' prospect at Causway Crowd (Wed Dec 3, 2025)
-
Is it time to start getting worried about David Pastrnak's injury? at Causway Crowd (Wed Dec 3, 2025)
-
Bruins Expect David Pastrnak To Be Out For Rest Of The Week at Boston Hockey Now (Tue Dec 2, 2025)
-
Bruins injury updates: David Pastrnak still sidelined, Arvidsson set to return at Boston.com (Mon Dec 1, 2025)
-
Bruins Practice Report: Pastrnak Not Traveling; Arvidsson Ready To Return at Boston Hockey Now (Mon Dec 1, 2025)
-
David Pastrnak day-to-day with injury as Bruins lineup takes another hit at Boston.com (Fri Nov 28, 2025)
-
Injury Bug Bites Bruins Again; Pastrnak, Zacha Out Versus Rangers at Boston Hockey Now (Fri Nov 28, 2025)
-
Boston Bruins News: Surprising decision works, David Pastrnak comparison, more at Causway Crowd (Fri Nov 28, 2025)
-
Boston Bruins superstar doesn't hide his frustration after disappointing loss to Sharks at Causway Crowd (Mon Nov 24, 2025)
-
Boston Bruins News: Big injury development, apology accepted, Pastrnak's expectations at Causway Crowd (Sun Nov 23, 2025)
-
Darcy Kuemper tries to trip David Pastrnak after Morgan Geekie scores overtime winner on him at Russian Machine Never Breaks (Sat Nov 22, 2025)
-
NHL Insider delivers an incredibly outlandish take on David Pastrnak's Bruins future at Causway Crowd (Wed Nov 12, 2025)
-
Bruins rake up Maple Leafs for seventh straight win as David Pastrnak pots milestone at Causway Crowd (Wed Nov 12, 2025)
-
Boston Bruins empty bench, celebrate David Pastrnak’s 400th goal like Capitals did for Alex Ovechkin’s 900th at Russian Machine Never Breaks (Wed Nov 12, 2025)
-
David Pastrnak’s 400th career goal with Bruins was fitting — for several reasons at Boston.com (Wed Nov 12, 2025)
-
Recap: Bruins power up in 5-3 win over Maple Leafs at Stanley Cup of Chowder (Wed Nov 12, 2025)
-
Pastrnak Scores Twice to Help Lead Bruins Over Maple Leafs 5-3. at The Hockey Writers (Wed Nov 12, 2025)
-
Pastrnak scores twice, hits 400-goal milestone as Bruins beat Maple Leafs at Boston.com (Wed Nov 12, 2025)
-
Milestone Night From David Pastrnak Leads Bruins Over Leafs For Seventh Straight Win at Boston Hockey Now (Tue Nov 11, 2025)
-
David Pastrnak Reaches Milestone 400th Career Goal at Boston Hockey Now (Tue Nov 11, 2025)
-
Boston Bruins star David Pastrnak buries milestone goal against Maple Leafs at Causway Crowd (Tue Nov 11, 2025)
-
‘He has everything to score 50’: Morgan Geekie is evolving into an elite goal scorer for Bruins at Boston.com (Fri Oct 31, 2025)
-
Slow start, but Bruins get a much-needed win over the Islanders at Boston.com (Wed Oct 29, 2025)
-
Pastrnak and Lindholm star as the Bruins rally past the Islanders 5-2 at Boston.com (Tue Oct 28, 2025)
Current Contract
David Pastrnak signed an $90,000,000 8-year contract with the Boston Bruins and General Manager Don Sweeney on March 2, 2023 with an AAV of $11,250,000. This contract will start in 2023-24 and end after the 2030-31 season. In the first season of the contract the cap hit was equivalent to 13.47% of the salary cap.
Standard Contract (UFA) 4.0 ( ) (1 rating)
David Pastrnak signed a $40,000,000 6-year contract with the Boston Bruins and General Manager Don Sweeney on September 14, 2017 with an AAV of $6,666,667. This contract will start in 2017-18 and end after the 2022-23 season. In the first season of the contract the cap hit was equivalent to 8.89% of the salary cap.
Standard Contract (RFA) ( ) (0 ratings)
| Season | Age* | Clause | Cap Hit | AAV | Perf. Bonus | Sign. Bonus | Salary | Compensation | Minors Salary | Status | |
|---|---|---|---|---|---|---|---|---|---|---|---|
| 2017-18 | 21 | $6,666,667 | $6,666,667 | - | $4,000,000 | $4,000,000 | $8,000,000 | $8,000,000 | RFA | ||
| 2018-19 | 22 | $6,666,667 | $6,666,667 | - | - | $8,000,000 | $8,000,000 | $8,000,000 | RFA-arb | ||
| 2019-20 | 23 | $6,666,667 | $6,666,667 | - | - | $6,800,000 | $6,800,000 | $6,800,000 | RFA-arb | ||
| 2020-21 | 24 | $6,666,667 | $6,666,667 | - | $1,000,000 | $3,000,000 | $4,000,000 | $4,000,000 | RFA-arb | ||
| 2021-22 | 25 | NMC M-NTC | $6,666,667 | $6,666,667 | - | - | $6,800,000 | $6,800,000 | $6,800,000 | UFA | |
| 2022-23 | 26 | NMC M-NTC | $6,666,667 | $6,666,667 | - | $2,000,000 | $4,400,000 | $6,400,000 | $6,400,000 | UFA | |
| Total | - | $7,000,000 | $33,000,000 | $40,000,000 | $40,000,000 |
David Pastrnak signed a $2,775,000 3-year contract with the Boston Bruins and General Manager Peter Chiarelli on July 15, 2014 with an AAV of $925,000. This contract will start in 2014-15 and end after the 2016-17 season. In the first season of the contract the cap hit was equivalent to 1.34% of the salary cap.
Entry Level Contract ( ) (0 ratings)
| Season | Age* | Clause | Cap Hit | AAV | Perf. Bonus | Sign. Bonus | Salary | Compensation | Minors Salary | Status | |
|---|---|---|---|---|---|---|---|---|---|---|---|
| 2014-15 | 18 | $925,000 | $925,000 | - | $92,500 | $832,500 | $925,000 | $70,000 | ELC | ||
| 2015-16 | 19 | $925,000 | $925,000 | - | $92,500 | $832,500 | $925,000 | $70,000 | ELC | ||
| 2016-17 | 20 | $925,000 | $925,000 | - | $92,500 | $832,500 | $925,000 | $70,000 | ELC | ||
| Total | - | $277,500 | $2,497,500 | $2,775,000 | $210,000 |
Career Statistics
| Regular Season | Playoffs | |||||||||||||||||||
|---|---|---|---|---|---|---|---|---|---|---|---|---|---|---|---|---|---|---|---|---|
| Season | League | Team | GP | G | A | Pts | +/- | PIM | Shots | Sh% | TOI/G | GP | G | A | Pts | +/- | PIM | Shots | Sh% | TOI/G |
| 2009-10 | Czech U16 | HC Havirov U16 | 30 | 28 | 24 | 52 | +32 | 8 | ||||||||||||
| 2010-11 | CzR-U18 | Havirov U18 | 16 | 7 | 12 | 19 | 4 | 1 | ||||||||||||
| 2011-12 | CzR-U18 | Trinec U18 | 31 | 33 | 14 | 47 | 6 | |||||||||||||
| 2011-12 | CzR-U18 | Havirov U18 | 17 | 18 | 22 | 40 | 28 | |||||||||||||
| 2011-12 | CzRep-Jr. | AZ Havirov Jr. | 3 | 0 | 1 | 1 | 2 | |||||||||||||
| 2011-12 | CzRep-3 | AZ Havirov | 2 | 0 | 0 | 0 | 4 | |||||||||||||
| 2012-13 | Sweden-2 | Sodertalje | 16 | 2 | 1 | 3 | ||||||||||||||
| 2012-13 | Swe-U18 | Sodertalje U18 | 7 | 6 | 8 | 14 | 4 | |||||||||||||
| 2012-13 | Swe-Jr. | Sodertalje Jr. | 36 | 12 | 17 | 29 | 67 | 4 | 2 | 2 | 4 | 10 | ||||||||
| 2013-14 | Sweden-2 | Sodertalje | 36 | 8 | 16 | 24 | 24 | |||||||||||||
| 2013-14 | WJ18-A | Czech Republic | 7 | 0 | 5 | 5 | +1 | 2 | 22 | |||||||||||
| 2013-14 | Swe-Jr. | Sodertalje Jr. | 1 | 1 | 1 | 2 | 2 | |||||||||||||
| 2014-15 | NHL | Boston Bruins | 46 | 10 | 17 | 27 | +12 | 8 | 93 | 10.8 | 13:58 | |||||||||
| 2014-15 | WJC-A | Czech Republic | 5 | 1 | 6 | 7 | 4 | 12 | ||||||||||||
| 2014-15 | AHL | Providence | 25 | 11 | 17 | 28 | +15 | 12 | 76 | 1,450.0 | 3 | 4 | 0.0 | |||||||
| 2015-16 | NHL | Boston Bruins | 51 | 15 | 11 | 26 | +3 | 20 | 108 | 13.9 | 13:57 | |||||||||
| 2015-16 | WC | Czechia | 8 | 1 | 5 | 6 | +4 | 4 | ||||||||||||
| 2015-16 | WJC-20 | Czechia U20 | 4 | 1 | 3 | 4 | +1 | |||||||||||||
| 2015-16 | AHL | Providence | 3 | 1 | 3 | 4 | +1 | 2 | 3 | 3,330.0 | ||||||||||
| 2015-16 | EHT | Czechia | 2 | 1 | 0 | 1 | +1 | 6 | ||||||||||||
| 2016-17 | WC | Czechia | 8 | 1 | 6 | 7 | +1 | 4 | ||||||||||||
| 2016-17 | WCup | Czechia | 3 | 0 | 0 | 0 | -1 | |||||||||||||
| 2016-17 | NHL | Boston Bruins | 75 | 34 | 36 | 70 | +11 | 34 | 262 | 13.0 | 17:59 | 6 | 2 | 2 | 4 | +1 | 6 | 10 | 20.0 | 21:04 |
| 2017-18 | WC | Czechia | 5 | 4 | 2 | 6 | +6 | |||||||||||||
| 2017-18 | NHL | Boston Bruins | 82 | 35 | 45 | 80 | +10 | 37 | 246 | 14.2 | 17:58 | 12 | 6 | 14 | 20 | +2 | 8 | 44 | 13.6 | 19:17 |
| 2018-19 | NHL | Boston Bruins | 66 | 38 | 43 | 81 | +6 | 32 | 235 | 16.2 | 18:45 | 24 | 9 | 10 | 19 | 4 | 82 | 11.0 | 17:34 | |
| 2019-20 | NHL | Boston Bruins | 70 | 48 | 47 | 95 | +21 | 40 | 279 | 17.2 | 18:58 | 10 | 3 | 7 | 10 | -3 | 2 | 40 | 7.5 | 21:38 |
| 2020-21 | NHL | Boston Bruins | 48 | 20 | 28 | 48 | +10 | 24 | 176 | 11.4 | 18:37 | 11 | 7 | 8 | 15 | +3 | 8 | 52 | 13.5 | 19:44 |
| 2021-22 | WC | Czechia | 7 | 7 | 3 | 10 | +3 | 2 | ||||||||||||
| 2021-22 | NHL | Boston Bruins | 72 | 40 | 37 | 77 | +13 | 20 | 312 | 12.8 | 18:36 | 7 | 3 | 3 | 6 | +1 | 2 | 39 | 7.7 | 19:27 |
| 2022-23 | NHL | Boston Bruins | 82 | 61 | 52 | 113 | +34 | 38 | 407 | 15.0 | 19:34 | 7 | 5 | 5 | -2 | 2 | 34 | 14.7 | 20:33 | |
| 2023-24 | NHL | Boston Bruins | 82 | 47 | 63 | 110 | +21 | 47 | 382 | 12.3 | 19:56 | 13 | 4 | 4 | 8 | 25 | 41 | 9.8 | 19:39 | |
| 2024-25 | NHL | Boston Bruins | 82 | 43 | 63 | 106 | 42 | 319 | 13.5 | 20:11 | ||||||||||
| 2024-25 | WC | Czechia | 8 | 6 | 9 | 15 | +7 | 4 | ||||||||||||
| 2025-26 | OG | Czechia | 5 | 2 | 3 | 5 | +1 | 16 | 13.0 | 20:27 | ||||||||||
| 2025-26 | NHL | Boston Bruins | 77 | 29 | 71 | 100 | +4 | 72 | 261 | 11.1 | 20:39 | 6 | 3 | 4 | 7 | -7 | 8 | 22 | 13.6 | 20:58 |
| NHL Career | 833 | 420 | 513 | 933 | +145 | 414 | 3080 | 13.6 | 18:33 | 96 | 42 | 52 | 94 | -5 | 65 | 364 | 11.5 | 19:31 | ||