
 Zach Bogosian
| Position | Right Defense | Current Team | Minnesota Wild |
| Shoots | Right | Current Contract | 1 year ($1.2M CapHit) |
| Height | 6'3" | Expires | 2026-27 |
| Weight (lbs) | 231 | Expiry Age (Jun 30) | 36 |
| Age (DOB) | 36 (July 15, 1990) | Expiry Status | UFA |
| Drafted | 2008, Round 1, Overall 3 (ATL) |
| Date | Team | Transaction | |
|---|---|---|---|
| Jul 1, 2026 | Minnesota Wild | Signed 1 year @ $1.350M AAV starting in 2026-27 | |
| Feb 2, 2026 | Minnesota Wild | Activated from IR | |
| Jan 10, 2026 | Minnesota Wild | Placed on IR | |
| Dec 23, 2025 | Minnesota Wild | Activated from IR | |
| Dec 20, 2025 | Minnesota Wild | Placed on IR | |
| Nov 21, 2025 | Minnesota Wild | Activated from IR | |
| Oct 21, 2025 | Minnesota Wild | Placed on IR | |
| Mar 5, 2024 | Minnesota Wild | Signed 2 years @ $1.250M AAV starting in 2024-25 | |
| Jul 28, 2021 | Tampa Bay Lightning | Signed 3 years @ $850K AAV starting in 2021-22 | |
| Oct 10, 2020 | Toronto Maple Leafs | Signed 1 year @ $1.000M AAV starting in 2020-21 | |
| Feb 24, 2020 | Tampa Bay Lightning | Signed 1 year @ $1.300M AAV starting in 2019-20 | |
| Jul 29, 2013 | Winnipeg Jets | Signed 7 years @ $5.143M AAV starting in 2013-14 | |
| Sep 14, 2011 | Winnipeg Jets | Signed 2 years @ $2.500M AAV starting in 2011-12 | |
| Sep 4, 2008 | Atlanta Thrashers | Signed to an entry level contract. |
Player Card(s)
URL: https://thestanleycap.com/cdn/player_cards/20252026/zach-bogosian-8474567.png
URL: https://thestanleycap.com/cdn/player_cards/20242025/zach-bogosian-8474567.png
URL: https://thestanleycap.com/cdn/player_cards/20232024/zach-bogosian-8474567.png
About Player Cards
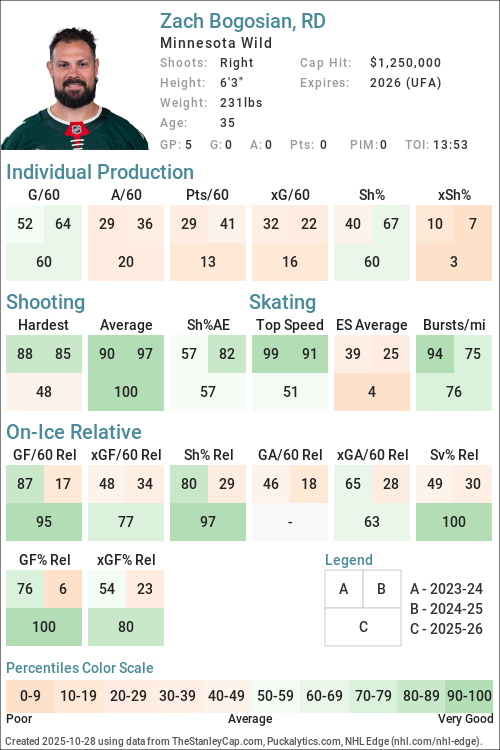
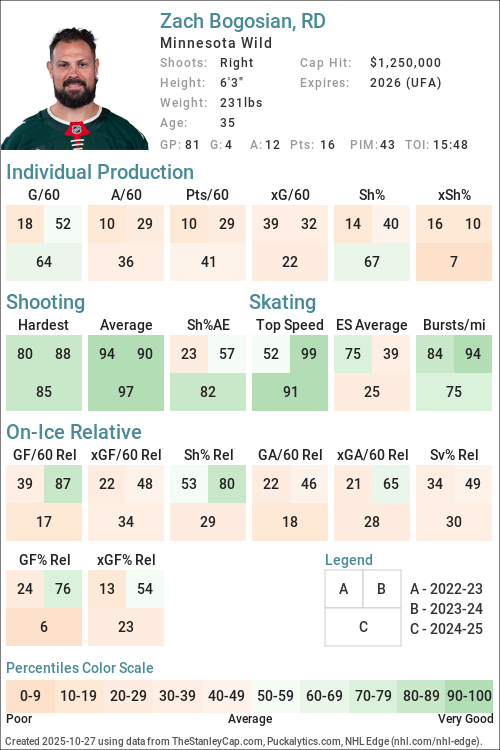
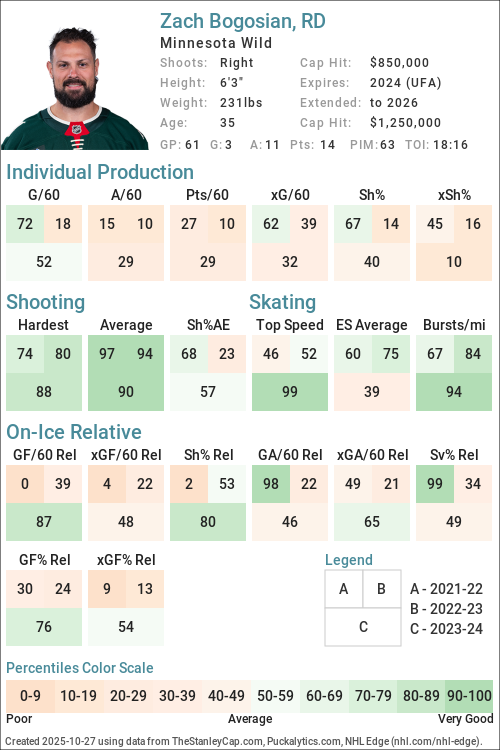
Player cards present an infographic of a players performance using a series of Player Archetypes developed for Puckalytics.com and TheStanleyCap.com. The boxes in the rink image show the archetype ratings for the season specified in the card while the graphs to the right show the five-year trends for those archetypes.
Except for Faceoffs, the values shown are the players z-score (standard deviation from the mean) for the specific metric used to calculate the archetype values. When calculating z-scores forwards were compared to forwards and defensemen were compared to defensemen. Positive values indicate the player is above average and shaded in blue, while negative values indicate the player is below average and shaded in pink. The five year trend charts show a range of -4.0 to 4.0.
The value shown for Faceoffs is the faceoff winning percentage rather than their z-score with winning percentages below 50 in pink shades and above 50 in blue shades.
All archetypes are 5v5 except 5v4 TOI, 4v5 TOI, Skating (even strength) and Faceoffs (all situations). Archetypes use regular season data only.
Archetypes Summary
- Sniper - Measures the to score above the expected goal rate.
- Rebound - Measures the percent of a players shot attempts that come from rebounds (forwards only).
- 5v4 TOI - Powerplay ice time, calculated as the percentage of his teams 5v4 ice time that the player was on the ice for.
- Shooter - Measures whether a players points come from shots (goals or assists on rebounds from his shots).
- Producer - Measures a players ability to produce goals and assists, adjusted for quality of teammates.
- Playmaker - Measures whether a players points come from passes.
- Drive - Measures a players ability to drive puck possession and generate shot attempts for his team.
- Rush - Measures the percent of a players shot attempts that come from rush plays
- Possession - An indicator of a players ability to improve his teams puck possession game.
- Faceoffs - Faceoff Winning Percentage (min. 75 faceoffs taken).
- 5v5 TOI - The percentage of his teams 5v5 TOI that the player was on the ice for.
- Suppress - Measures a players ability to suppress opponent puck possession and shot attempts against.
- Skating - An indicator of a players skating ability, or speed bursts above 20mph per mile skated.
- Defend - An indicator of a players ability to suppress shot quality against.
- 4v5 TOI - Penalty Kill ice time, calculated as the percentage of his teams 4v5 ice time that the player was on the ice for.
Data Sources
- Salary data is from TheStanleyCap.com
- Skating data is from NHL Edge
- Other statistics are from Puckalytics.com and derived from data from NHL.com
Terms of Use
You are free to use include player cards in written articles, share on social media, or on other public websites under the following conditions:
- You credit TheStanleyCap.com as the source and provide a link back to TheStanleyCap.com or this player page.
- You do not mass copy/duplicate/publish dozens or hundreds of player cards. A few, or a handful for a written article is fine. Be reasonable. Fair use rules apply.
- If you are a high-traffic website you must download and host the image(s) on your site rather than overload TheStanleyCap servers with traffic.
Note: Player cards will update daily throughout the season so if you want to include snapshot then you must download the image.
If you have any questions, send an e-mail to the e-mail address at the top of this page.
Read Introducing Player Archetypes on HockeyAnalysis.com for more details on archetype calculations.
Core Archetypes
| Season | Team(s) | GP | TOI | Producer | Playmaker | Shooter | Sniper | Rebound | Rush | Skating | Defend |
|---|---|---|---|---|---|---|---|---|---|---|---|
| 2015-16 | BUF | 64 | -0.49 | -0.28 | -0.56 | -0.29 | - | -0.04 | - | -0.82 | |
| 2016-17 | BUF | 56 | -0.60 | -0.41 | -0.59 | -0.76 | - | -0.96 | - | -1.51 | |
| 2017-18 | BUF | 18 | -1.45 | -0.99 | -1.02 | -1.66 | - | -1.06 | - | -0.12 | |
| 2018-19 | BUF | 65 | -0.16 | 0.23 | -0.64 | -0.43 | - | 0.61 | - | 0.18 | |
| 2019-20 | BUF, TBL | 27 | 0.49 | 0.60 | -0.19 | -0.17 | - | -0.88 | - | -2.43 | |
| 2020-21 | TOR | 45 | -1.28 | -0.83 | -0.83 | -2.23 | - | -0.81 | - | -0.12 | |
| 2021-22 | TBL | 48 | -0.37 | -0.71 | 0.23 | 0.48 | - | -1.07 | 0.27 | 2.18 | |
| 2022-23 | TBL | 46 | -1.12 | -1.12 | -0.70 | -0.66 | - | -0.89 | 0.91 | -0.31 | |
| 2023-24 | MIN, TBL | 65 | -0.75 | -0.77 | -0.45 | -0.09 | - | -0.17 | 1.83 | -0.01 | |
| 2024-25 | MIN | 81 | 0.03 | -0.03 | -0.02 | 0.81 | - | -0.68 | 0.48 | -0.48 | |
| 2025-26 | MIN | 41 | -0.81 | -0.92 | -0.32 | 0.85 | - | -0.70 | -0.33 | 0.98 |
Situational and Secondary Archetypes
| Season | Team(s) | GP | TOI | 5v5 TOI | 5v4 TOI | 4v5 TOI | Possession | Drive | Suppress | Faceoffs |
|---|---|---|---|---|---|---|---|---|---|---|
| 2015-16 | BUF | 64 | 1.06 | -0.21 | -0.32 | 0.01 | 0.32 | -0.34 | - | |
| 2016-17 | BUF | 56 | 0.62 | -1.52 | -0.08 | 0.87 | 0.58 | 0.77 | - | |
| 2017-18 | BUF | 18 | 0.53 | -0.82 | -1.07 | 1.16 | 0.40 | 1.45 | - | |
| 2018-19 | BUF | 65 | 0.71 | -1.51 | 1.29 | -0.09 | 0.31 | -0.53 | - | |
| 2019-20 | BUF, TBL | 27 | -1.04 | -1.69 | 0.24 | -0.75 | -0.46 | -0.61 | - | |
| 2020-21 | TOR | 45 | -1.79 | -1.59 | -0.20 | 0.02 | 0.26 | -0.21 | - | |
| 2021-22 | TBL | 48 | -0.77 | -1.52 | -1.80 | -1.65 | -1.48 | -0.99 | - | |
| 2022-23 | TBL | 46 | -1.02 | -1.40 | -1.36 | -0.75 | -0.17 | -1.10 | - | |
| 2023-24 | MIN, TBL | 65 | 0.00 | -1.40 | -0.49 | 0.56 | 0.77 | -0.05 | - | |
| 2024-25 | MIN | 81 | -1.66 | -1.47 | 0.43 | -0.99 | -0.39 | -1.22 | - | |
| 2025-26 | MIN | 41 | -1.60 | -1.48 | -1.08 | -1.02 | -0.93 | -0.70 | - |
5v5 Individual Stats
| Season | Team(s) | GP | TOI | G/60 | A/60 | Pts/60 | xG/60 | GAE/60 | Sh% | xSh% | Sh%AE | %SA Rush | %SA Reb. |
|---|---|---|---|---|---|---|---|---|---|---|---|---|---|
| 2015-16 | BUF | 64 | 1138:01 | 0.11 | 0.47 | 0.58 | 0.14 | -0.04 | 2.33 | 3.17 | -0.85 | 0.88 | 0.00 |
| 2016-17 | BUF | 56 | 984:32 | 0.06 | 0.49 | 0.55 | 0.13 | -0.07 | 1.56 | 3.34 | -1.78 | 0.00 | 3.37 |
| 2017-18 | BUF | 18 | 290:44 | 0.00 | 0.21 | 0.21 | 0.20 | -0.20 | 0.00 | 3.90 | -3.90 | 0.00 | 6.67 |
| 2018-19 | BUF | 65 | 1147:53 | 0.10 | 0.73 | 0.84 | 0.16 | -0.05 | 2.47 | 3.66 | -1.19 | 1.82 | 0.91 |
| 2019-20 | TBL | 8 | 101:40 | 0.00 | 0.59 | 0.59 | 0.20 | -0.20 | 0.00 | 3.86 | -3.86 | 0.00 | 0.00 |
| 2019-20 | BUF | 19 | 268:17 | 0.22 | 0.89 | 1.12 | 0.17 | 0.05 | 5.56 | 4.24 | 1.32 | 0.00 | 4.00 |
| 2019-20 | BUF, TBL | 27 | 369:57 | 0.16 | 0.81 | 0.97 | 0.18 | -0.02 | 3.70 | 4.11 | -0.41 | 0.00 | 2.78 |
| 2020-21 | TOR | 45 | 575:40 | 0.00 | 0.42 | 0.42 | 0.18 | -0.18 | 0.00 | 5.53 | -5.53 | 0.00 | 1.82 |
| 2021-22 | TBL | 48 | 694:59 | 0.26 | 0.43 | 0.69 | 0.21 | 0.05 | 5.17 | 4.16 | 1.01 | 0.00 | 2.74 |
| 2022-23 | TBL | 46 | 651:31 | 0.09 | 0.37 | 0.46 | 0.18 | -0.09 | 1.92 | 3.76 | -1.84 | 0.00 | 1.41 |
| 2023-24 | MIN | 61 | 968:29 | 0.19 | 0.56 | 0.74 | 0.17 | 0.02 | 4.17 | 3.82 | 0.35 | 0.98 | 0.98 |
| 2023-24 | TBL | 4 | 41:09 | 0.00 | 0.00 | 0.00 | 0.20 | -0.20 | 0.00 | 2.74 | -2.74 | 0.00 | 0.00 |
| 2023-24 | MIN, TBL | 65 | 1009:38 | 0.18 | 0.53 | 0.71 | 0.17 | 0.01 | 3.90 | 3.75 | 0.15 | 0.93 | 0.93 |
| 2024-25 | MIN | 81 | 1110:04 | 0.22 | 0.54 | 0.76 | 0.15 | 0.07 | 5.56 | 3.77 | 1.79 | 0.00 | 2.70 |
| 2025-26 | MIN | 41 | 545:18 | 0.22 | 0.44 | 0.66 | 0.13 | 0.09 | 6.90 | 4.06 | 2.84 | 0.00 | 0.00 |
5v5 On Ice Stats
| Season | Team(s) | GP | TOI | SAF/60 | GF/60 | xGF/60 | SAA/60 | GA/60 | xGA/60 | GF% | xGF% | xGF Rel | xGA Rel | xGF% Rel |
|---|---|---|---|---|---|---|---|---|---|---|---|---|---|---|
| 2015-16 | BUF | 64 | 1138:01 | 38.07 | 2.16 | 1.88 | 43.34 | 2.48 | 2.32 | 46.59 | 44.65 | 0.06 | 0.19 | -1.40 |
| 2016-17 | BUF | 56 | 984:32 | 41.20 | 1.83 | 2.23 | 42.78 | 2.93 | 2.40 | 38.46 | 48.16 | 0.17 | 0.05 | 1.42 |
| 2017-18 | BUF | 18 | 290:44 | 41.07 | 1.03 | 2.17 | 40.86 | 2.48 | 1.99 | 29.41 | 52.21 | 0.24 | -0.59 | 9.31 |
| 2018-19 | BUF | 65 | 1147:53 | 43.70 | 2.61 | 2.47 | 45.84 | 2.82 | 2.74 | 48.08 | 47.40 | 0.17 | 0.13 | 0.55 |
| 2019-20 | TBL | 8 | 101:40 | 36.00 | 2.36 | 2.28 | 38.95 | 4.13 | 2.15 | 36.36 | 51.51 | 0.03 | -0.19 | 2.44 |
| 2019-20 | BUF | 19 | 268:17 | 37.57 | 2.46 | 2.07 | 45.40 | 2.91 | 2.50 | 45.83 | 45.32 | -0.15 | 0.43 | -6.47 |
| 2019-20 | BUF, TBL | 27 | 369:57 | 37.14 | 2.43 | 2.13 | 43.63 | 3.24 | 2.40 | 42.86 | 46.98 | -0.10 | 0.26 | -4.03 |
| 2020-21 | TOR | 45 | 575:40 | 41.80 | 2.71 | 2.80 | 38.67 | 2.08 | 2.23 | 56.52 | 55.61 | -0.08 | -0.01 | -0.55 |
| 2021-22 | TBL | 48 | 694:59 | 38.42 | 1.90 | 2.55 | 44.29 | 1.81 | 2.74 | 51.16 | 48.15 | -0.37 | 0.12 | -4.47 |
| 2022-23 | TBL | 46 | 651:31 | 43.84 | 2.30 | 2.72 | 44.57 | 2.67 | 2.87 | 46.30 | 48.64 | -0.24 | 0.33 | -5.08 |
| 2023-24 | MIN | 61 | 968:29 | 42.50 | 2.66 | 2.29 | 39.71 | 2.35 | 2.01 | 53.09 | 53.26 | 0.06 | -0.07 | 1.49 |
| 2023-24 | TBL | 4 | 41:09 | 36.45 | 2.92 | 2.30 | 45.20 | 4.37 | 2.51 | 40.00 | 47.79 | -0.74 | -0.38 | -3.42 |
| 2023-24 | MIN, TBL | 65 | 1009:38 | 42.25 | 2.67 | 2.29 | 39.94 | 2.44 | 2.03 | 52.33 | 53.01 | 0.01 | -0.10 | 1.29 |
| 2024-25 | MIN | 81 | 1110:04 | 38.11 | 1.78 | 2.15 | 45.08 | 2.49 | 2.41 | 41.77 | 47.07 | 0.06 | 0.21 | -1.65 |
| 2025-26 | MIN | 41 | 545:18 | 38.29 | 2.42 | 2.46 | 44.67 | 1.87 | 2.68 | 56.41 | 47.85 | -0.09 | 0.13 | -2.14 |
NHL Edge Stats
| Skating | Shooting | Zone Time | |||||||||||
|---|---|---|---|---|---|---|---|---|---|---|---|---|---|
| Season | GP | Top Speed | Bursts>20/mi | Avg. Speed | Top Speed | Avg. Speed | %Long Range | %Mid Range | %High Danger | ES DZ% | ES NZ% | ES OZ% | |
| This table is for Basic and Premium subscribers only. To view please login to and/or subscribe to one of our subscription plans. | |||||||||||||
Legend
| Percentile 0-25 | Percentile 25-50 | Percentile 50-75 | Percentile 75-100 |
5v5 Defense Pairs
| Season | Teammate | Team | TOI | GF/60 | GA/60 | GF% | xGF/60 | xGA/60 | xGF% | xGF Rel | xGA Rel | xGF% Rel |
|---|
Glossary
| Type | Statistic | Definition |
|---|---|---|
| Individual | G/60 | Goals Against per 60 minutes. |
| Individual | A/60 | Assists per 60 minutes. |
| Individual | Pts/60 | Points per 60 minutes. |
| Individual | xG/60 | Expected Goals per 60 minutes. |
| Individual | GAE/60 | Goals Above Expected (G/60 - xG/60). |
| Individual | Sh% | Shooting Percentage. |
| Individual | xSh% | Expected Shooting Percentage. |
| Individual | Sh%AE | Shooting percentage above expected (Sh% - xSh%). |
| Individual | %SA Rush | Percentage of shot attempts determined to be on the rush. |
| Individual | %SA Reb. | Percentage of shot attempts determined to be from rebounds. |
| On Ice | SAF/60 | Shot Attempts For per 60 minutes. |
| On Ice | GF/60 | Goals For per 60 minutes. |
| On Ice | xGF/60 | Expected Goals For per 60 minutes. |
| On Ice | SAA/60 | Shot Attempts Against per 60 minutes (lower is better). |
| On Ice | GA/60 | Goals Against per 60 minutes (lower is better). |
| On Ice | xGA/60 | Expected Goals Against per 60 minutes (lower is better). |
| On Ice | GF% | Goals For Percentage = Goals For / (Goals For + Goals Against) |
| On Ice | xGF% | Expected Goals For Percentage = Expected Goals For / (Expected Goals For + Expected Goals Against) |
| On Ice | xGF Rel | xGF/60 when On Ice - xGF/60 when not On Ice. |
| On Ice | xGA Rel | xGA/60 when On Ice - xGA/60 when not On Ice (lower is better). |
| On Ice | xGF% Rel | xGF% when On Ice - xGF% when not On Ice. |
News and Opinions
-
Recapping the Minnesota Wild’s Early Free Agency Moves at The Hockey Writers (Fri Jul 3, 2026)
-
Bringing back Wild veteran won't solve looming need in free agency at Gone Puck Wild (Tue Jun 30, 2026)
-
Wild 2025-26 Report Cards: Zach Bogosian at The Hockey Writers (Thu Jun 4, 2026)
-
Wild defenseman Zach Bogosian out for Game 5 against Avalanche with lower-body injury at Yahoo Sports NHL (Wed May 13, 2026)
-
Will the Wild Use Jeff Petry In the Playoffs? at Hockey Wilderness (Sat Apr 4, 2026)
-
2 Former Thrashers Still Active in the NHL at The Hockey Writers (Mon Nov 3, 2025)
-
NHL Waiver Rules at The Hockey Writers (Tue Sep 16, 2025)
-
Wild 2024-25 Report Cards: Merrill, Chisholm & Bogosian at The Hockey Writers (Mon Aug 11, 2025)
Current Contract
Zach Bogosian signed a $1,250,000 1-year contract with the Minnesota Wild and General Manager Bill Guerin on July 1, 2026 with an AAV of $1,250,000. This contract will start in 2026-27 and end after the 2026-27 season. In the first season of the contract the cap hit was equivalent to 1.20% of the salary cap.
Standard Contract (UFA) ( ) (0 ratings)
Zach Bogosian signed a $2,500,000 2-year contract with the Minnesota Wild and General Manager Bill Guerin on March 5, 2024 with an AAV of $1,250,000. This contract will start in 2024-25 and end after the 2025-26 season. In the first season of the contract the cap hit was equivalent to 1.42% of the salary cap.
Standard Contract (UFA) ( ) (0 ratings)
| Season | Age* | Clause | Cap Hit | AAV | Perf. Bonus | Sign. Bonus | Salary | Compensation | Minors Salary | Status | |
|---|---|---|---|---|---|---|---|---|---|---|---|
| 2024-25 | 34 | $1,250,000 | $1,250,000 | - | - | $1,250,000 | $1,250,000 | $1,250,000 | UFA | ||
| 2025-26 | 35 | $1,250,000 | $1,250,000 | - | - | $1,250,000 | $1,250,000 | $1,250,000 | UFA | ||
| Total | - | - | $2,500,000 | $2,500,000 | $2,500,000 |
Zach Bogosian signed a $2,550,000 3-year contract with the Tampa Bay Lightning and General Manager Julien Brisebois on July 28, 2021 with an AAV of $850,000. This contract will start in 2021-22 and end after the 2023-24 season. In the first season of the contract the cap hit was equivalent to 1.04% of the salary cap.
Standard Contract (UFA) ( ) (0 ratings)
| Season | Age* | Clause | Cap Hit | AAV | Perf. Bonus | Sign. Bonus | Salary | Compensation | Minors Salary | Status | |
|---|---|---|---|---|---|---|---|---|---|---|---|
| 2021-22 | 31 | NTC | $850,000 | $850,000 | - | - | $750,000 | $750,000 | $750,000 | UFA | |
| 2022-23 | 32 | NTC | $850,000 | $850,000 | - | - | $750,000 | $750,000 | $750,000 | UFA | |
| 2023-24 | 33 | M-NTC | $850,000 | $850,000 | - | - | $1,050,000 | $1,050,000 | $1,050,000 | UFA | |
| Total | - | - | $2,550,000 | $2,550,000 | $2,550,000 |
Zach Bogosian signed a $1,000,000 1-year contract with the Toronto Maple Leafs and General Manager Kyle Dubas on October 10, 2020 with an AAV of $1,000,000. This contract will start in 2020-21 and end after the 2020-21 season. In the first season of the contract the cap hit was equivalent to 1.23% of the salary cap.
Standard Contract (UFA) ( ) (0 ratings)
| Season | Age* | Clause | Cap Hit | AAV | Perf. Bonus | Sign. Bonus | Salary | Compensation | Minors Salary | Status | |
|---|---|---|---|---|---|---|---|---|---|---|---|
| 2020-21 | 30 | NTC | $1,000,000 | $1,000,000 | - | - | $1,000,000 | $1,000,000 | $1,000,000 | UFA | |
| Total | - | - | $1,000,000 | $1,000,000 | $1,000,000 |
Zach Bogosian signed a $1,300,000 1-year contract with the Tampa Bay Lightning and General Manager Julien Brisebois on February 24, 2020 with an AAV of $1,300,000. This contract will start in 2019-20 and end after the 2019-20 season. In the first season of the contract the cap hit was equivalent to 1.60% of the salary cap.
Standard Contract (UFA) ( ) (0 ratings)
| Season | Age* | Clause | Cap Hit | AAV | Perf. Bonus | Sign. Bonus | Salary | Compensation | Minors Salary | Status | |
|---|---|---|---|---|---|---|---|---|---|---|---|
| 2019-20 | 29 | $1,300,000 | $1,300,000 | - | - | $1,300,000 | $1,300,000 | $1,300,000 | UFA | ||
| Total | - | - | $1,300,000 | $1,300,000 | $1,300,000 |
Zach Bogosian signed a $36,000,000 7-year contract with the Winnipeg Jets and General Manager Kevin Cheveldayoff on July 29, 2013 with an AAV of $5,142,857. This contract will start in 2013-14 and end after the 2019-20 season. In the first season of the contract the cap hit was equivalent to 8.00% of the salary cap. The Buffalo Sabres terminated this contract on February 22, 2020.
Standard Contract (RFA) ( ) (0 ratings)
| Season | Age* | Clause | Cap Hit | AAV | Perf. Bonus | Sign. Bonus | Salary | Compensation | Minors Salary | Status | |
|---|---|---|---|---|---|---|---|---|---|---|---|
| 2013-14 | 23 | $5,142,857 | $5,142,857 | - | - | $4,000,000 | $4,000,000 | $4,000,000 | RFA-arb | ||
| 2014-15 | 24 | $5,142,857 | $5,142,857 | - | - | $4,000,000 | $4,000,000 | $4,000,000 | RFA-arb | ||
| 2015-16 | 25 | $5,142,857 | $5,142,857 | - | - | $5,250,000 | $5,250,000 | $5,250,000 | UFA | ||
| 2016-17 | 26 | $5,142,857 | $5,142,857 | - | - | $5,250,000 | $5,250,000 | $5,250,000 | UFA | ||
| 2017-18 | 27 | $5,142,857 | $5,142,857 | - | - | $5,500,000 | $5,500,000 | $5,500,000 | UFA | ||
| 2018-19 | 28 | $5,142,857 | $5,142,857 | - | - | $6,000,000 | $6,000,000 | $6,000,000 | UFA | ||
| 2019-20 | 29 | $5,142,857 | $5,142,857 | - | - | $6,000,000 | $6,000,000 | $6,000,000 | UFA | ||
| Total | - | - | $36,000,000 | $36,000,000 | $36,000,000 |
Zach Bogosian signed a $5,000,000 2-year contract with the Winnipeg Jets and General Manager Kevin Cheveldayoff on September 14, 2011 with an AAV of $2,500,000. This contract will start in 2011-12 and end after the 2012-13 season. In the first season of the contract the cap hit was equivalent to 3.89% of the salary cap.
Standard Contract (RFA) ( ) (0 ratings)
| Season | Age* | Clause | Cap Hit | AAV | Perf. Bonus | Sign. Bonus | Salary | Compensation | Minors Salary | Status | |
|---|---|---|---|---|---|---|---|---|---|---|---|
| 2011-12 | 21 | $2,500,000 | $2,500,000 | - | - | $2,000,000 | $2,000,000 | $2,000,000 | RFA | ||
| 2012-13 | 22 | $2,500,000 | $2,500,000 | - | - | $3,000,000 | $3,000,000 | $3,000,000 | RFA-arb | ||
| Total | - | - | $5,000,000 | $5,000,000 | $5,000,000 |
Zach Bogosian signed a $2,625,000 3-year contract with the Atlanta Thrashers and General Manager Don Waddell on September 4, 2008 with an AAV of $875,000. This contract will start in 2008-09 and end after the 2010-11 season. In the first season of the contract the cap hit was equivalent to 1.54% of the salary cap.
Entry Level Contract ( ) (0 ratings)
| Season | Age* | Clause | Cap Hit | AAV | Perf. Bonus | Sign. Bonus | Salary | Compensation | Minors Salary | Status | |
|---|---|---|---|---|---|---|---|---|---|---|---|
| 2008-09 | 18 | $875,000 | $3,375,000 | $2,500,000 | $87,500 | $787,500 | $875,000 | $65,000 | ELC | ||
| 2009-10 | 19 | $875,000 | $3,375,000 | $2,500,000 | $87,500 | $787,500 | $875,000 | $65,000 | ELC | ||
| 2010-11 | 20 | $875,000 | $3,375,000 | $2,500,000 | $87,500 | $787,500 | $875,000 | $65,000 | ELC | ||
| Total | $7,500,000 | $262,500 | $2,362,500 | $2,625,000 | $195,000 |
Career Statistics
| Regular Season | Playoffs | |||||||||||||||||||
|---|---|---|---|---|---|---|---|---|---|---|---|---|---|---|---|---|---|---|---|---|
| Season | League | Team | GP | G | A | Pts | +/- | PIM | Shots | Sh% | TOI/G | GP | G | A | Pts | +/- | PIM | Shots | Sh% | TOI/G |
| 2004-05 | USHS-Prep | Cushing Academy | 34 | 0 | 1 | 1 | ||||||||||||||
| 2005-06 | High-MA | Cushing | 36 | 1 | 16 | 17 | ||||||||||||||
| 2006-07 | OHL | Peterborough | 67 | 7 | 26 | 33 | -6 | 63 | ||||||||||||
| 2007-08 | OHL | Peterborough | 60 | 11 | 50 | 61 | +8 | 72 | 5 | 3 | 3 | -4 | 8 | |||||||
| 2008-09 | NHL | Atlanta Thrashers | 47 | 9 | 10 | 19 | +11 | 47 | 90 | 10.0 | 18:06 | |||||||||
| 2008-09 | WC-A | USA | 9 | 0 | 1 | 1 | 2 | |||||||||||||
| 2008-09 | AHL | Chicago | 5 | 1 | 0 | 1 | -5 | |||||||||||||
| 2009-10 | NHL | Atlanta Thrashers | 81 | 10 | 13 | 23 | -18 | 61 | 155 | 6.4 | 21:25 | |||||||||
| 2010-11 | NHL | Atlanta Thrashers | 71 | 5 | 12 | 17 | -27 | 29 | 155 | 3.2 | 22:24 | |||||||||
| 2011-12 | NHL | Winnipeg Jets | 65 | 5 | 25 | 30 | -3 | 71 | 150 | 3.3 | 23:19 | |||||||||
| 2012-13 | NHL | Winnipeg Jets | 33 | 5 | 9 | 14 | -5 | 29 | 85 | 5.9 | 23:07 | |||||||||
| 2013-14 | NHL | Winnipeg Jets | 55 | 3 | 8 | 11 | +3 | 48 | 134 | 2.2 | 22:55 | |||||||||
| 2014-15 | NHL | Winnipeg Jets | 41 | 3 | 10 | 13 | +1 | 40 | 74 | 4.0 | 22:10 | |||||||||
| 2014-15 | NHL | Buffalo Sabres | 21 | 0 | 7 | 7 | -7 | 38 | 51 | 0.0 | 26:34 | |||||||||
| 2015-16 | NHL | Buffalo Sabres | 64 | 7 | 17 | 24 | -11 | 68 | 121 | 5.8 | 22:21 | |||||||||
| 2016-17 | NHL | Buffalo Sabres | 56 | 2 | 9 | 11 | -17 | 46 | 73 | 2.7 | 20:05 | |||||||||
| 2017-18 | NHL | Buffalo Sabres | 18 | 0 | 1 | 1 | -9 | 20 | 29 | 0.0 | 19:09 | |||||||||
| 2018-19 | NHL | Buffalo Sabres | 65 | 3 | 16 | 19 | -5 | 52 | 93 | 3.2 | 21:38 | |||||||||
| 2019-20 | NHL | Buffalo Sabres | 19 | 1 | 4 | 5 | 10 | 18 | 5.6 | 16:50 | ||||||||||
| 2019-20 | NHL | Tampa Bay Lightning | 8 | 0 | 2 | 2 | 12 | 11 | 0.0 | 16:10 | 20 | 4 | 4 | +1 | 12 | 42 | 0.0 | 17:40 | ||
| 2020-21 | NHL | Toronto Maple Leafs | 45 | 0 | 4 | 4 | +7 | 49 | 36 | 0.0 | 14:32 | 7 | 1 | 1 | -3 | 5 | 0.0 | 15:00 | ||
| 2021-22 | NHL | Tampa Bay Lightning | 48 | 3 | 5 | 8 | +2 | 53 | 60 | 5.0 | 15:22 | 22 | 3 | 3 | 4 | 20 | 0.0 | 12:34 | ||
| 2022-23 | NHL | Tampa Bay Lightning | 46 | 1 | 4 | 5 | -4 | 42 | 54 | 1.9 | 14:59 | 5 | 1 | 1 | +2 | 7 | 6 | 0.0 | 12:47 | |
| 2023-24 | NHL | Minnesota Wild | 61 | 3 | 11 | 14 | +11 | 63 | 77 | 3.9 | 18:16 | |||||||||
| 2023-24 | NHL | Tampa Bay Lightning | 4 | 0 | 0 | 0 | 6 | 0.0 | 11:57 | |||||||||||
| 2024-25 | NHL | Minnesota Wild | 81 | 4 | 12 | 16 | -6 | 43 | 79 | 5.1 | 15:48 | 6 | 1 | 1 | +1 | 2 | 0.0 | 13:00 | ||
| 2025-26 | NHL | Minnesota Wild | 41 | 2 | 4 | 6 | +8 | 18 | 30 | 6.7 | 14:33 | 9 | -2 | 4 | 3 | 0.0 | 12:45 | |||
| NHL Career | 970 | 66 | 183 | 249 | -69 | 839 | 1581 | 4.2 | 19:39 | 69 | 10 | 10 | -1 | 27 | 78 | 0.0 | 14:22 | |||