
Vladimir Tarasenko
| Position | Right Wing | Current Team | |
| Shoots | Left | Current Contract | |
| Height | 6'1" | Expires | |
| Weight (lbs) | 219 | Expiry Age (Jun 30) | |
| Age (DOB) | 34 (Dec 13, 1991) | Expiry Status | |
| Drafted | 2010, Round 1, Overall 16 (STL) |
| Date | Team | Transaction | |
|---|---|---|---|
| Nov 29, 2025 | Minnesota Wild | Activated from IR | |
| Nov 20, 2025 | Minnesota Wild | Placed on IR | |
| Jun 30, 2025 | Minnesota Wild | Acquired from Detroit Red Wings | |
| Jun 30, 2025 | Detroit Red Wings | Traded to Minnesota Wild | |
| Jul 3, 2024 | Detroit Red Wings | Signed 2 years @ $4.750M AAV starting in 2024-25 | |
| Jul 27, 2023 | Ottawa Senators | Signed 1 year @ $5.000M AAV starting in 2023-24 | |
| Jul 7, 2015 | St. Louis Blues | Signed 8 years @ $7.500M AAV starting in 2015-16 | |
| Jul 2, 2012 | St. Louis Blues | Signed to an entry level contract. |
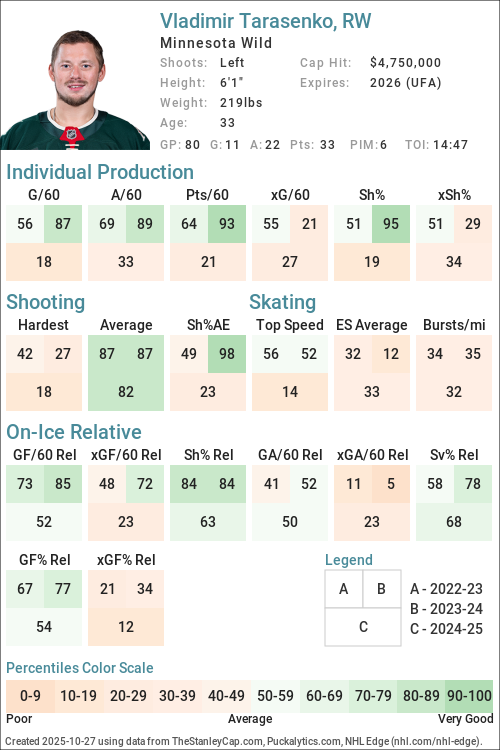
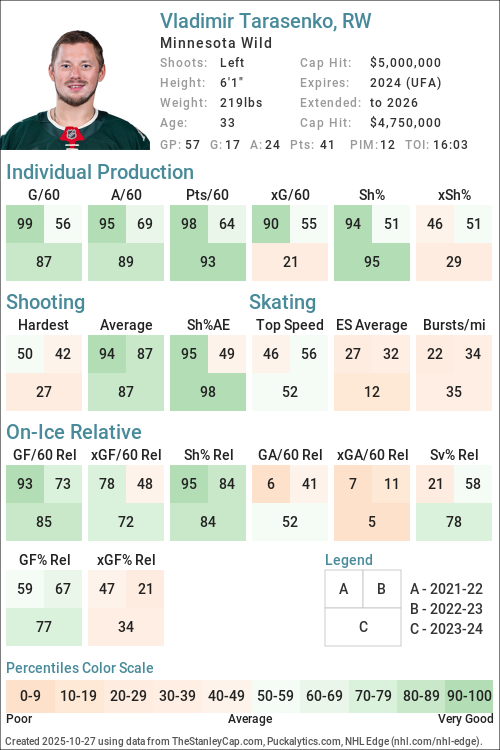
Player Card(s)
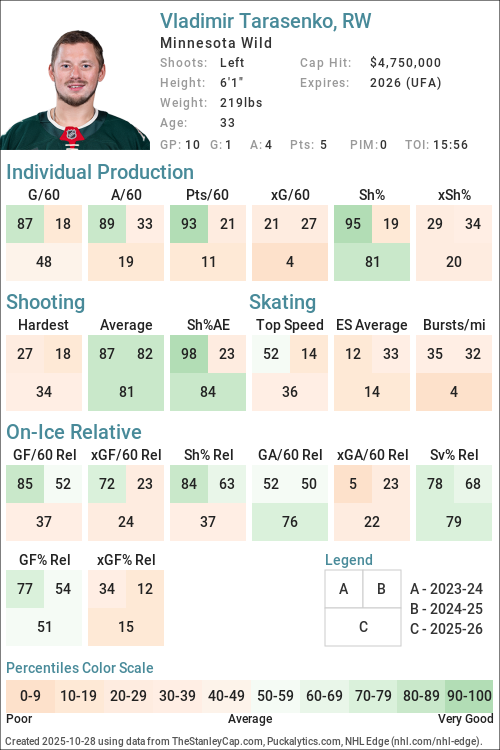
URL: https://thestanleycap.com/cdn/player_cards/20252026/vladimir-tarasenko-8475765.png
URL: https://thestanleycap.com/cdn/player_cards/20242025/vladimir-tarasenko-8475765.png
URL: https://thestanleycap.com/cdn/player_cards/20232024/vladimir-tarasenko-8475765.png
About Player Cards
Player cards present an infographic of a players performance using a series of Player Archetypes developed for Puckalytics.com and TheStanleyCap.com. The boxes in the rink image show the archetype ratings for the season specified in the card while the graphs to the right show the five-year trends for those archetypes.
Except for Faceoffs, the values shown are the players z-score (standard deviation from the mean) for the specific metric used to calculate the archetype values. When calculating z-scores forwards were compared to forwards and defensemen were compared to defensemen. Positive values indicate the player is above average and shaded in blue, while negative values indicate the player is below average and shaded in pink. The five year trend charts show a range of -4.0 to 4.0.
The value shown for Faceoffs is the faceoff winning percentage rather than their z-score with winning percentages below 50 in pink shades and above 50 in blue shades.
All archetypes are 5v5 except 5v4 TOI, 4v5 TOI, Skating (even strength) and Faceoffs (all situations). Archetypes use regular season data only.
Archetypes Summary
- Sniper - Measures the to score above the expected goal rate.
- Rebound - Measures the percent of a players shot attempts that come from rebounds (forwards only).
- 5v4 TOI - Powerplay ice time, calculated as the percentage of his teams 5v4 ice time that the player was on the ice for.
- Shooter - Measures whether a players points come from shots (goals or assists on rebounds from his shots).
- Producer - Measures a players ability to produce goals and assists, adjusted for quality of teammates.
- Playmaker - Measures whether a players points come from passes.
- Drive - Measures a players ability to drive puck possession and generate shot attempts for his team.
- Rush - Measures the percent of a players shot attempts that come from rush plays
- Possession - An indicator of a players ability to improve his teams puck possession game.
- Faceoffs - Faceoff Winning Percentage (min. 75 faceoffs taken).
- 5v5 TOI - The percentage of his teams 5v5 TOI that the player was on the ice for.
- Suppress - Measures a players ability to suppress opponent puck possession and shot attempts against.
- Skating - An indicator of a players skating ability, or speed bursts above 20mph per mile skated.
- Defend - An indicator of a players ability to suppress shot quality against.
- 4v5 TOI - Penalty Kill ice time, calculated as the percentage of his teams 4v5 ice time that the player was on the ice for.
Data Sources
- Salary data is from TheStanleyCap.com
- Skating data is from NHL Edge
- Other statistics are from Puckalytics.com and derived from data from NHL.com
Terms of Use
You are free to use include player cards in written articles, share on social media, or on other public websites under the following conditions:
- You credit TheStanleyCap.com as the source and provide a link back to TheStanleyCap.com or this player page.
- You do not mass copy/duplicate/publish dozens or hundreds of player cards. A few, or a handful for a written article is fine. Be reasonable. Fair use rules apply.
- If you are a high-traffic website you must download and host the image(s) on your site rather than overload TheStanleyCap servers with traffic.
Note: Player cards will update daily throughout the season so if you want to include snapshot then you must download the image.
If you have any questions, send an e-mail to the e-mail address at the top of this page.
Read Introducing Player Archetypes on HockeyAnalysis.com for more details on archetype calculations.
Core Archetypes
| Season | Team(s) | GP | TOI | Producer | Playmaker | Shooter | Sniper | Rebound | Rush | Skating | Defend |
|---|---|---|---|---|---|---|---|---|---|---|---|
| 2015-16 | STL | 80 | 2.16 | 0.22 | 2.68 | 0.66 | -0.08 | -0.53 | - | -0.43 | |
| 2016-17 | STL | 82 | 2.03 | 0.40 | 2.06 | 1.00 | -0.94 | -0.33 | - | 0.71 | |
| 2017-18 | STL | 80 | 0.87 | -0.47 | 1.95 | 0.93 | -1.14 | 0.43 | - | 1.26 | |
| 2018-19 | STL | 76 | 0.90 | -0.11 | 1.27 | 0.09 | -0.10 | -0.17 | - | -0.81 | |
| 2019-20 | STL | 10 | 1.84 | 4.70 | -1.02 | -0.60 | 0.59 | 0.07 | - | -0.61 | |
| 2020-21 | STL | 24 | 0.40 | 1.22 | -0.73 | -0.74 | -0.75 | 0.85 | - | 0.03 | |
| 2021-22 | STL | 75 | 2.96 | 1.84 | 2.23 | 1.44 | -1.21 | -0.27 | -0.73 | -0.78 | |
| 2022-23 | NYR, STL | 69 | 0.21 | 0.05 | -0.03 | -0.35 | -0.60 | -0.56 | -0.57 | 0.15 | |
| 2023-24 | FLA, OTT | 76 | 1.37 | 1.02 | 0.67 | 2.20 | 0.16 | 1.53 | -0.51 | 0.73 | |
| 2024-25 | DET | 80 | -0.98 | -0.55 | -0.87 | -1.05 | -1.63 | 0.67 | -0.58 | 0.45 | |
| 2025-26 | MIN | 75 | 1.10 | -0.18 | 1.73 | 1.39 | 0.87 | 0.06 | -1.00 | 0.93 |
Situational and Secondary Archetypes
| Season | Team(s) | GP | TOI | 5v5 TOI | 5v4 TOI | 4v5 TOI | Possession | Drive | Suppress | Faceoffs |
|---|---|---|---|---|---|---|---|---|---|---|
| 2015-16 | STL | 80 | 1.13 | 1.17 | -1.39 | 0.37 | 1.24 | -1.20 | - | |
| 2016-17 | STL | 82 | 1.17 | 1.23 | -1.76 | 1.13 | 1.31 | 0.09 | - | |
| 2017-18 | STL | 80 | 1.24 | 1.37 | -1.81 | 1.08 | 1.48 | -0.16 | - | |
| 2018-19 | STL | 76 | 1.07 | 0.97 | -1.88 | 1.08 | 1.60 | -0.46 | - | |
| 2019-20 | STL | 10 | 0.42 | 0.28 | -1.93 | 1.78 | 0.23 | 2.67 | - | |
| 2020-21 | STL | 24 | 0.66 | 0.86 | -2.21 | 0.01 | 0.37 | -0.60 | - | |
| 2021-22 | STL | 75 | 0.35 | 0.78 | -1.98 | -0.21 | 0.57 | -1.56 | - | |
| 2022-23 | NYR, STL | 69 | 0.55 | 0.49 | -1.91 | -0.81 | 0.08 | -1.64 | - | |
| 2023-24 | FLA, OTT | 76 | 0.45 | 0.03 | -2.01 | -0.32 | 0.47 | -1.38 | - | |
| 2024-25 | DET | 80 | -0.04 | -0.44 | -2.03 | -1.11 | -0.38 | -1.40 | - | |
| 2025-26 | MIN | 75 | -0.17 | 0.14 | -1.99 | -1.50 | -0.92 | -1.22 | - |
5v5 Individual Stats
| Season | Team(s) | GP | TOI | G/60 | A/60 | Pts/60 | xG/60 | GAE/60 | Sh% | xSh% | Sh%AE | %SA Rush | %SA Reb. |
|---|---|---|---|---|---|---|---|---|---|---|---|---|---|
| 2015-16 | STL | 80 | 1105:47 | 1.19 | 1.14 | 2.33 | 0.98 | 0.21 | 10.68 | 8.77 | 1.91 | 3.00 | 4.87 |
| 2016-17 | STL | 82 | 1139:31 | 1.21 | 1.05 | 2.26 | 0.86 | 0.36 | 11.68 | 8.25 | 3.42 | 3.35 | 2.97 |
| 2017-18 | STL | 80 | 1141:51 | 1.21 | 0.95 | 2.15 | 0.87 | 0.34 | 11.27 | 8.12 | 3.16 | 4.83 | 2.41 |
| 2018-19 | STL | 76 | 1075:14 | 1.06 | 1.00 | 2.06 | 1.04 | 0.02 | 10.38 | 10.22 | 0.16 | 3.75 | 5.00 |
| 2019-20 | STL | 10 | 126:25 | 0.47 | 1.90 | 2.37 | 0.67 | -0.19 | 5.56 | 7.83 | -2.27 | 4.00 | 8.00 |
| 2020-21 | STL | 24 | 329:03 | 0.36 | 1.09 | 1.46 | 0.60 | -0.23 | 4.76 | 7.81 | -3.05 | 5.56 | 3.70 |
| 2021-22 | STL | 75 | 962:42 | 1.56 | 1.68 | 3.24 | 1.07 | 0.49 | 16.34 | 11.21 | 5.13 | 3.48 | 2.99 |
| 2022-23 | STL | 38 | 511:03 | 0.59 | 1.17 | 1.76 | 0.77 | -0.18 | 8.06 | 10.55 | -2.49 | 1.25 | 2.50 |
| 2022-23 | NYR | 31 | 418:02 | 0.86 | 1.15 | 2.01 | 0.93 | -0.06 | 12.77 | 13.71 | -0.95 | 4.29 | 8.57 |
| 2022-23 | NYR, STL | 69 | 929:05 | 0.71 | 1.16 | 1.87 | 0.84 | -0.13 | 10.09 | 11.92 | -1.82 | 2.67 | 5.33 |
| 2023-24 | FLA | 19 | 221:38 | 1.08 | 1.90 | 2.98 | 0.55 | 0.54 | 19.05 | 9.63 | 9.42 | 0.00 | 5.88 |
| 2023-24 | OTT | 57 | 736:40 | 1.06 | 1.22 | 2.28 | 0.58 | 0.48 | 17.81 | 9.71 | 8.09 | 9.35 | 9.35 |
| 2023-24 | FLA, OTT | 76 | 958:18 | 1.06 | 1.38 | 2.44 | 0.57 | 0.49 | 18.09 | 9.70 | 8.39 | 7.09 | 8.51 |
| 2024-25 | DET | 80 | 993:40 | 0.42 | 0.72 | 1.15 | 0.66 | -0.24 | 7.29 | 11.36 | -4.07 | 3.45 | 2.76 |
| 2025-26 | MIN | 75 | 904:03 | 1.06 | 0.86 | 1.92 | 0.72 | 0.35 | 15.53 | 10.48 | 5.05 | 2.72 | 10.88 |
5v5 On Ice Stats
| Season | Team(s) | GP | TOI | SAF/60 | GF/60 | xGF/60 | SAA/60 | GA/60 | xGA/60 | GF% | xGF% | xGF Rel | xGA Rel | xGF% Rel |
|---|---|---|---|---|---|---|---|---|---|---|---|---|---|---|
| 2015-16 | STL | 80 | 1105:47 | 45.63 | 2.88 | 2.75 | 40.32 | 2.12 | 2.31 | 57.61 | 54.33 | 0.64 | 0.23 | 4.02 |
| 2016-17 | STL | 82 | 1139:31 | 42.76 | 2.74 | 2.42 | 37.81 | 1.84 | 2.13 | 59.77 | 53.23 | 0.45 | 0.15 | 3.31 |
| 2017-18 | STL | 80 | 1141:51 | 48.55 | 3.15 | 2.64 | 39.51 | 1.79 | 2.13 | 63.83 | 55.32 | 0.52 | 0.01 | 5.29 |
| 2018-19 | STL | 76 | 1075:14 | 46.65 | 2.79 | 3.07 | 39.73 | 2.40 | 2.28 | 53.76 | 57.36 | 0.66 | 0.04 | 5.57 |
| 2019-20 | STL | 10 | 126:25 | 40.82 | 2.85 | 2.35 | 33.70 | 2.37 | 2.06 | 54.55 | 53.23 | 0.24 | -0.43 | 7.51 |
| 2020-21 | STL | 24 | 329:03 | 37.74 | 1.64 | 2.09 | 41.94 | 2.37 | 2.64 | 40.91 | 44.22 | -0.01 | 0.20 | -2.12 |
| 2021-22 | STL | 75 | 962:42 | 41.01 | 3.93 | 2.93 | 48.18 | 3.18 | 3.05 | 55.26 | 49.00 | 0.45 | 0.44 | 0.23 |
| 2022-23 | STL | 38 | 511:03 | 40.74 | 2.82 | 2.69 | 49.08 | 3.40 | 3.29 | 45.28 | 45.00 | 0.33 | 0.52 | -1.02 |
| 2022-23 | NYR | 31 | 418:02 | 35.74 | 2.87 | 2.49 | 44.92 | 2.30 | 3.06 | 55.56 | 44.87 | -0.21 | 0.33 | -4.85 |
| 2022-23 | NYR, STL | 69 | 929:05 | 38.49 | 2.84 | 2.60 | 47.21 | 2.91 | 3.19 | 49.44 | 44.95 | 0.09 | 0.44 | -2.81 |
| 2023-24 | FLA | 19 | 221:38 | 41.96 | 3.52 | 2.31 | 40.61 | 2.98 | 2.41 | 54.17 | 48.86 | -0.06 | 0.17 | -2.46 |
| 2023-24 | OTT | 57 | 736:40 | 45.94 | 3.42 | 2.72 | 45.86 | 2.77 | 3.00 | 55.26 | 47.52 | 0.37 | 0.60 | -1.91 |
| 2023-24 | FLA, OTT | 76 | 958:18 | 45.02 | 3.44 | 2.62 | 44.64 | 2.82 | 2.87 | 55.00 | 47.79 | 0.27 | 0.51 | -2.11 |
| 2024-25 | DET | 80 | 993:40 | 36.95 | 2.11 | 2.15 | 44.98 | 2.29 | 2.50 | 47.95 | 46.25 | -0.17 | 0.07 | -2.64 |
| 2025-26 | MIN | 75 | 904:03 | 38.10 | 2.32 | 2.46 | 45.59 | 2.26 | 2.75 | 50.72 | 47.14 | -0.20 | 0.19 | -3.71 |
NHL Edge Stats
| Skating | Shooting | Zone Time | |||||||||||
|---|---|---|---|---|---|---|---|---|---|---|---|---|---|
| Season | GP | Top Speed | Bursts>20/mi | Avg. Speed | Top Speed | Avg. Speed | %Long Range | %Mid Range | %High Danger | ES DZ% | ES NZ% | ES OZ% | |
| This table is for Basic and Premium subscribers only. To view please login to and/or subscribe to one of our subscription plans. | |||||||||||||
Legend
| Percentile 0-25 | Percentile 25-50 | Percentile 50-75 | Percentile 75-100 |
5v5 Lines
| Season | Teammate | Teammate | Team | TOI | GF/60 | GA/60 | GF% | xGF/60 | xGA/60 | xGF% | xGF Rel | xGA Rel | xGF% Rel |
|---|
Glossary
| Type | Statistic | Definition |
|---|---|---|
| Individual | G/60 | Goals Against per 60 minutes. |
| Individual | A/60 | Assists per 60 minutes. |
| Individual | Pts/60 | Points per 60 minutes. |
| Individual | xG/60 | Expected Goals per 60 minutes. |
| Individual | GAE/60 | Goals Above Expected (G/60 - xG/60). |
| Individual | Sh% | Shooting Percentage. |
| Individual | xSh% | Expected Shooting Percentage. |
| Individual | Sh%AE | Shooting percentage above expected (Sh% - xSh%). |
| Individual | %SA Rush | Percentage of shot attempts determined to be on the rush. |
| Individual | %SA Reb. | Percentage of shot attempts determined to be from rebounds. |
| On Ice | SAF/60 | Shot Attempts For per 60 minutes. |
| On Ice | GF/60 | Goals For per 60 minutes. |
| On Ice | xGF/60 | Expected Goals For per 60 minutes. |
| On Ice | SAA/60 | Shot Attempts Against per 60 minutes (lower is better). |
| On Ice | GA/60 | Goals Against per 60 minutes (lower is better). |
| On Ice | xGA/60 | Expected Goals Against per 60 minutes (lower is better). |
| On Ice | GF% | Goals For Percentage = Goals For / (Goals For + Goals Against) |
| On Ice | xGF% | Expected Goals For Percentage = Expected Goals For / (Expected Goals For + Expected Goals Against) |
| On Ice | xGF Rel | xGF/60 when On Ice - xGF/60 when not On Ice. |
| On Ice | xGA Rel | xGA/60 when On Ice - xGA/60 when not On Ice (lower is better). |
| On Ice | xGF% Rel | xGF% when On Ice - xGF% when not On Ice. |
News and Opinions
-
Vladimir Tarasenko's Unresolved Market Creates An Opportunity For the Wild at Hockey Wilderness (Wed Jul 22, 2026)
-
Four Potential NHL Destinations For UFA Vladimir Tarasenko at The Hockey News (Tue Jul 21, 2026)
-
Where could Patrick Kane, Vladimir Tarasenko, and John Klingberg end up? at NHL Rumors (Mon Jul 20, 2026)
-
Around the NHL: Minnesota Wild prefer Larkin over Trocheck; Kane, Tarasenko, Laine remain top free agents without deals at The Leafs Nation (Mon Jul 20, 2026)
-
Wild 2025-26 Report Cards: Vladimir Tarasenko at The Hockey Writers (Sat Jul 18, 2026)
-
Which recent departure will the Minnesota Wild miss most next season? at Gone Puck Wild (Sun Jul 12, 2026)
-
Chris Kreider Could Be the Wild's Vladimir Tarasenko 2.0 at Hockey Wilderness (Wed Jul 8, 2026)
-
Insider Suggests Oilers Could Look at Signing Vladimir Tarasenko at The Hockey Writers (Sun Jul 5, 2026)
-
Interesting Vladimir Tarasenko proposal emerges as Canadiens search for impact signing at Habs Fanatics (Fri Jul 3, 2026)
-
9 Best Remaining UFAs in 2026 NHL Free Agency at The Hockey Writers (Fri Jul 3, 2026)
-
Le Canadien pourrait-il s'intéresser à Vladimir Tarasenko? at HABSolument Fan (Thu Jul 2, 2026)
-
Oilers free agent targets: Vladimir Tarasenko at Oilers Nation (Tue Jun 30, 2026)
-
Vladimir Tarasenko's departure from the Minnesota Wild is all but confirmed at Gone Puck Wild (Tue Jun 30, 2026)
-
3 veteran free agent targets the New Jersey Devils should target at Pucks and Pitchforks (Mon Jun 29, 2026)
-
Tarasenko reunion is a good idea, for the right price at Bleedin' Blue (Mon Jun 29, 2026)
-
Minnesota Wild Are Set Up for a Potentially Busy Free Agent Offseason at The Hockey Writers (Mon Jun 29, 2026)
-
NHL Rumors: Hellebuyck to Sabres, Levi and Oilers, Canucks Trades, Tarasenko Tampering at The Hockey Writers (Mon Jun 29, 2026)
-
Daily Bean: Bruins Dev Camp Starts Today; Defense Trade Talk; Tarasenko at Boston Hockey Now (Mon Jun 29, 2026)
-
Could Sunny Mehta and/or Sheldon Keefe Look To Their Past to Address the Devils’ Future? at All About the Jersey (Wed Jun 24, 2026)
-
Could Sunny Mehta and/or Sheldon Keefe Look To Their Past to Address the Devils’ Future? at Yahoo Sports NHL (Wed Jun 24, 2026)
-
NHL Rumors: Tippett, Zegras, Tuch, Mantha, McMann, Arvidsson, Tarasenko, Roslovic, Bobrovsky, Kane, Shea, and Greer at NHL Rumors (Sat Jun 20, 2026)
-
Wild free agent appears to already have one foot out the door at Gone Puck Wild (Sat Jun 20, 2026)
-
2026 NHL Free Agency — Top 10 Wingers at The Hockey Writers (Sun Jun 14, 2026)
-
Making sense of Vladimir Tarasenko's bounce-back season and what it means for his possible return to the Wild at Gone Puck Wild (Sat Jun 13, 2026)
-
Vladimir Tarasenko Can Still Change A Game With One Shot at Hockey Wilderness (Mon Jun 8, 2026)
-
Marcus Johansson's departure may lead to Vladimir Tarasenko's return to Wild at Gone Puck Wild (Mon Jun 8, 2026)
-
NHL Rumors: Colorado Avalanche, Patrik Laine, and Vladimir Tarasenko at NHL Rumors (Wed Jun 3, 2026)
-
Bring one Blue back, Tarasenko or O'Reilly at Bleedin' Blue (Tue May 26, 2026)
-
Vladimir Tarasenko scored an absolutely filthy goal during Wild comeback against Avs in Game 1 at Gone Puck Wild (Mon May 4, 2026)
-
Red Wings shouldn't be criticized for trading Vladimir Tarasenko at Octopus Thrower (Sat May 2, 2026)
-
Quinn Hughes, Vladimir Tarasenko Help Wild Win First Playoff Series In 11 Years at Yahoo Sports NHL (Thu Apr 30, 2026)
-
The Complex Anatomy Of Danila Yurov's Rookie Mistake at Hockey Wilderness (Fri Apr 24, 2026)
-
Vladimir Tarasenko Might Be the Wild's Secret Weapon in the Playoffs at Hockey Wilderness (Wed Apr 15, 2026)
-
Former Red Wings forward is thriving after leaving Detroit at Octopus Thrower (Sun Apr 12, 2026)
-
Tarasenko and Hartman Have Provided Valuable Secondary Scoring For the Wild at Hockey Wilderness (Tue Apr 7, 2026)
-
Vladimir Tarasenko Has Stepped Up When the Wild Needed Him Most at Hockey Wilderness (Sat Jan 24, 2026)
-
The Tarasenko Time Machine Is Exactly What the Wild Need Right Now at Hockey Wilderness (Sat Dec 20, 2025)
-
Wild’s Tarasenko Scores Twice in 5-0 Win Over the Capitals at The Hockey Writers (Wed Dec 17, 2025)
-
Revisiting the St. Louis Blues’ Previous Winter Classic Appearances at The Hockey Writers (Thu Dec 11, 2025)
-
Wild's Vladimir Tarasenko To Miss Second Straight Game With Lower-Body Injury at Yahoo Sports NHL (Sun Nov 16, 2025)
-
Can A Healthy Wild Team Get More Out Of Vladimir Tarasenko? at Hockey Wilderness (Thu Nov 13, 2025)
-
What Should the Wild Do To Optimize Their Second Line? at Hockey Wilderness (Thu Oct 2, 2025)
-
Wild’s Training Camp Is More Than Just Preseason Practice at The Hockey Writers (Mon Sep 29, 2025)
-
Vladimir Tarasenko Could Be the Wild's Patrick Laine Mulligan at Hockey Wilderness (Tue Sep 23, 2025)
-
The Wild Need To Establish A Role For Liam Ohgren at Hockey Wilderness (Mon Aug 25, 2025)
-
What Are the Wild Trying To Unlock In Tarasenko's Game? at Hockey Wilderness (Wed Jul 9, 2025)
-
Can Kirill Kaprizov Become A Free-Agent Draw In Minnesota? at Hockey Wilderness (Wed Jul 9, 2025)
-
Red Wings fans can laugh off Vladimir Tarasenko’s strange exit comment at Octopus Thrower (Sat Jul 5, 2025)
-
The Tarasenko Trade Is Sneaky Clever at Hockey Wilderness (Wed Jul 2, 2025)
-
Is James van Riemsdyk really an upgrade over Vladimir Tarasenko? at Octopus Thrower (Tue Jul 1, 2025)
-
Red Wings revealed exactly what they thought of Vladimir Tarasenko at Octopus Thrower (Mon Jun 30, 2025)
-
In-Depth Mega-Preview Of Devils, Rangers Round One Series at Devils Army (Mon Apr 17, 2023)
-
DAB Trade Profile: Vladimir Tarasenko, Consistent-Scoring Winger at Devils Army (Wed Feb 1, 2023)
-
Potential Trade Target: Vladimir Tarasenko at Devils Army (Fri Jul 8, 2022)
-
Why The New Jersey Devils Should Stay Away From Vladimir Tarasenko at Devils Army (Fri Jul 9, 2021)
Current Contract
Player does not currently have a contract.Vladimir Tarasenko signed a $9,500,000 2-year contract with the Detroit Red Wings and General Manager Steve Yzerman on July 3, 2024 with an AAV of $4,750,000. This contract will start in 2024-25 and end after the 2025-26 season. In the first season of the contract the cap hit was equivalent to 5.40% of the salary cap.
Standard Contract (UFA) ( ) (0 ratings)
| Season | Age* | Clause | Cap Hit | AAV | Perf. Bonus | Sign. Bonus | Salary | Compensation | Minors Salary | Status | |
|---|---|---|---|---|---|---|---|---|---|---|---|
| 2024-25 | 32 | NTC | $4,750,000 | $4,750,000 | - | - | $4,750,000 | $4,750,000 | $4,750,000 | UFA | |
| 2025-26 | 33 | M-NTC | $4,750,000 | $4,750,000 | - | - | $4,750,000 | $4,750,000 | $4,750,000 | UFA | |
| Total | - | - | $9,500,000 | $9,500,000 | $9,500,000 |
Vladimir Tarasenko signed a $5,000,000 1-year contract with the Ottawa Senators and General Manager Pierre Dorion on July 27, 2023 with an AAV of $5,000,000. This contract will start in 2023-24 and end after the 2023-24 season. In the first season of the contract the cap hit was equivalent to 5.99% of the salary cap.
Standard Contract (UFA) ( ) (0 ratings)
| Season | Age* | Clause | Cap Hit | AAV | Perf. Bonus | Sign. Bonus | Salary | Compensation | Minors Salary | Status | |
|---|---|---|---|---|---|---|---|---|---|---|---|
| 2023-24 | 31 | NTC | $5,000,000 | $5,000,000 | - | - | $5,000,000 | $5,000,000 | $5,000,000 | UFA | |
| Total | - | - | $5,000,000 | $5,000,000 | $5,000,000 |
Vladimir Tarasenko signed an $60,000,000 8-year contract with the St. Louis Blues and General Manager Doug Armstrong on July 7, 2015 with an AAV of $7,500,000. This contract will start in 2015-16 and end after the 2022-23 season. In the first season of the contract the cap hit was equivalent to 10.50% of the salary cap.
Standard Contract (RFA) ( ) (0 ratings)
| Season | Age* | Clause | Cap Hit | AAV | Perf. Bonus | Sign. Bonus | Salary | Compensation | Minors Salary | Status | |
|---|---|---|---|---|---|---|---|---|---|---|---|
| 2015-16 | 23 | $7,500,000 | $7,500,000 | - | - | $8,000,000 | $8,000,000 | $8,000,000 | RFA | ||
| 2016-17 | 24 | $7,500,000 | $7,500,000 | - | - | $8,000,000 | $8,000,000 | $8,000,000 | RFA-arb | ||
| 2017-18 | 25 | $7,500,000 | $7,500,000 | - | - | $7,000,000 | $7,000,000 | $7,000,000 | RFA-arb | ||
| 2018-19 | 26 | $7,500,000 | $7,500,000 | - | - | $7,000,000 | $7,000,000 | $7,000,000 | RFA-arb | ||
| 2019-20 | 27 | NTC | $7,500,000 | $7,500,000 | - | - | $9,500,000 | $9,500,000 | $9,500,000 | UFA | |
| 2020-21 | 28 | NTC | $7,500,000 | $7,500,000 | - | - | $5,500,000 | $5,500,000 | $5,500,000 | UFA | |
| 2021-22 | 29 | NTC | $7,500,000 | $7,500,000 | - | - | $9,500,000 | $9,500,000 | $9,500,000 | UFA | |
| 2022-23 | 30 | NTC | $7,500,000 | $7,500,000 | - | - | $5,500,000 | $5,500,000 | $5,500,000 | UFA | |
| Total | - | - | $60,000,000 | $60,000,000 | $60,000,000 |
Vladimir Tarasenko signed a $2,700,000 3-year contract with the St. Louis Blues and General Manager Doug Armstrong on July 2, 2012 with an AAV of $900,000. This contract will start in 2012-13 and end after the 2014-15 season. In the first season of the contract the cap hit was equivalent to 1.50% of the salary cap.
Entry Level Contract ( ) (0 ratings)
| Season | Age* | Clause | Cap Hit | AAV | Perf. Bonus | Sign. Bonus | Salary | Compensation | Minors Salary | Status | |
|---|---|---|---|---|---|---|---|---|---|---|---|
| 2012-13 | 20 | $900,000 | $1,750,000 | $850,000 | $90,000 | $810,000 | $900,000 | $67,500 | ELC | ||
| 2013-14 | 21 | $900,000 | $1,750,000 | $850,000 | $90,000 | $810,000 | $900,000 | $67,500 | ELC | ||
| 2014-15 | 22 | $900,000 | $1,750,000 | $850,000 | $90,000 | $810,000 | $900,000 | $67,500 | ELC | ||
| Total | $2,550,000 | $270,000 | $2,430,000 | $2,700,000 | $202,500 |
Career Statistics
| Regular Season | Playoffs | |||||||||||||||||||
|---|---|---|---|---|---|---|---|---|---|---|---|---|---|---|---|---|---|---|---|---|
| Season | League | Team | GP | G | A | Pts | +/- | PIM | Shots | Sh% | TOI/G | GP | G | A | Pts | +/- | PIM | Shots | Sh% | TOI/G |
| 2007-08 | Russia-3 | Novosibirsk 2 | 17 | 6 | 4 | 10 | 2 | |||||||||||||
| 2008-09 | Rus-KHL | Novosibirsk | 38 | 7 | 3 | 10 | 2 | |||||||||||||
| 2008-09 | WJ18-A | Russia | 7 | 8 | 7 | 15 | 6 | |||||||||||||
| 2009-10 | Rus-KHL | Novosibirsk | 42 | 13 | 11 | 24 | 18 | |||||||||||||
| 2009-10 | Russia-Jr. | Novosibirsk Jr. | 1 | 1 | 0 | 1 | ||||||||||||||
| 2010-11 | WJC-A | Russia | 7 | 4 | 7 | 11 | +8 | |||||||||||||
| 2010-11 | WC-A | Russia | 6 | 1 | 0 | 1 | -3 | |||||||||||||
| 2010-11 | Russia-Jr. | Novosibirsk Jr. | 3 | 2 | 2 | 4 | 2 | |||||||||||||
| 2010-11 | Rus-KHL | Novosibirsk | 42 | 9 | 10 | 19 | 8 | 3 | ||||||||||||
| 2011-12 | KHL | Novosibirsk | 39 | 18 | 20 | 38 | 15 | |||||||||||||
| 2011-12 | KHL | St. Petersburg | 15 | 5 | 4 | 9 | 15 | 10 | 6 | 16 | 6 | |||||||||
| 2012-13 | KHL | St. Petersburg | 31 | 14 | 18 | 32 | 8 | |||||||||||||
| 2012-13 | NHL | St. Louis Blues | 38 | 8 | 11 | 19 | +1 | 10 | 75 | 10.7 | 13:25 | 1 | 0.0 | 5:51 | ||||||
| 2013-14 | Olympics | Russia | 5 | 0 | 1 | 1 | -1 | 4 | ||||||||||||
| 2013-14 | NHL | St. Louis Blues | 64 | 21 | 22 | 43 | +20 | 16 | 136 | 15.4 | 15:10 | 6 | 4 | 4 | +1 | 22 | 18.2 | 18:58 | ||
| 2014-15 | WC-A | Russia | 9 | 4 | 3 | 7 | -1 | 2 | 24 | |||||||||||
| 2014-15 | NHL | St. Louis Blues | 77 | 37 | 36 | 73 | +27 | 31 | 264 | 14.0 | 17:37 | 6 | 6 | 1 | 7 | -4 | 14 | 42.9 | 17:23 | |
| 2015-16 | NHL | St. Louis Blues | 80 | 40 | 34 | 74 | +7 | 37 | 292 | 13.7 | 18:38 | 20 | 9 | 6 | 15 | -5 | 2 | 62 | 14.5 | 18:01 |
| 2016-17 | WCup | Russia | 4 | 2 | 0 | 2 | +1 | 2 | ||||||||||||
| 2016-17 | NHL | St. Louis Blues | 82 | 39 | 36 | 75 | -1 | 12 | 286 | 13.6 | 18:28 | 11 | 3 | 3 | 6 | +2 | 44 | 6.8 | 20:50 | |
| 2017-18 | NHL | St. Louis Blues | 80 | 33 | 33 | 66 | +15 | 17 | 306 | 10.8 | 19:03 | |||||||||
| 2018-19 | NHL | St. Louis Blues | 76 | 33 | 35 | 68 | +8 | 22 | 275 | 12.0 | 18:24 | 26 | 11 | 6 | 17 | -5 | 4 | 90 | 12.2 | 18:19 |
| 2019-20 | NHL | St. Louis Blues | 10 | 3 | 7 | 10 | -2 | 26 | 11.5 | 16:11 | 4 | -1 | 10 | 0.0 | 17:38 | |||||
| 2020-21 | WC | Russia | 3 | 0 | 2 | 2 | +1 | 2 | ||||||||||||
| 2020-21 | NHL | St. Louis Blues | 24 | 4 | 10 | 14 | -7 | 65 | 6.2 | 17:25 | 4 | 2 | 2 | -8 | 7 | 28.6 | 16:59 | |||
| 2021-22 | NHL | St. Louis Blues | 75 | 34 | 48 | 82 | +7 | 32 | 230 | 14.8 | 16:55 | 12 | 6 | 3 | 9 | -2 | 32 | 18.8 | 16:59 | |
| 2022-23 | NHL | St. Louis Blues | 38 | 10 | 19 | 29 | -18 | 8 | 103 | 9.7 | 17:31 | |||||||||
| 2022-23 | NHL | New York Rangers | 31 | 8 | 13 | 21 | +4 | 66 | 12.1 | 15:55 | 7 | 3 | 1 | 4 | -1 | 2 | 19 | 15.8 | 15:13 | |
| 2023-24 | NHL | Ottawa Senators | 57 | 17 | 24 | 41 | +13 | 12 | 116 | 14.7 | 16:03 | |||||||||
| 2023-24 | NHL | Florida Panthers | 19 | 6 | 8 | 14 | 39 | 15.4 | 14:48 | 24 | 5 | 4 | 9 | +4 | 2 | 47 | 10.6 | 13:22 | ||
| 2024-25 | NHL | Detroit Red Wings | 80 | 11 | 22 | 33 | -13 | 6 | 133 | 8.3 | 14:47 | |||||||||
| 2025-26 | NHL | Minnesota Wild | 75 | 23 | 24 | 47 | -11 | 10 | 148 | 15.5 | 14:56 | 11 | 2 | 3 | 5 | +2 | 2 | 18 | 11.1 | 14:12 |
| NHL Career | 906 | 327 | 382 | 709 | +50 | 213 | 2560 | 12.8 | 16:51 | 132 | 51 | 27 | 78 | -17 | 12 | 365 | 14.0 | 16:47 | ||