
Tyler Johnson
| Position | Right Wing / Center | Current Team | |
| Shoots | Right | Current Contract | |
| Height | 5'8" | Expires | |
| Weight (lbs) | 191 | Expiry Age (Jun 30) | |
| Age (DOB) | 36 (July 29, 1990) | Expiry Status | |
| Drafted | Undrafted |
| Date | Team | Transaction | |
|---|---|---|---|
| Dec 20, 2024 | Boston Bruins | Cleared Waivers | |
| Dec 19, 2024 | Boston Bruins | Placed on Waivers | |
| Nov 4, 2024 | Boston Bruins | Signed 1 year @ $775K AAV starting in 2024-25 | |
| Jul 10, 2017 | Tampa Bay Lightning | Signed 7 years @ $5.000M AAV starting in 2017-18 | |
| May 26, 2014 | Tampa Bay Lightning | Signed 3 years @ $3.333M AAV starting in 2014-15 | |
| Mar 7, 2011 | Tampa Bay Lightning | Signed to an entry level contract. |
Player Card(s)
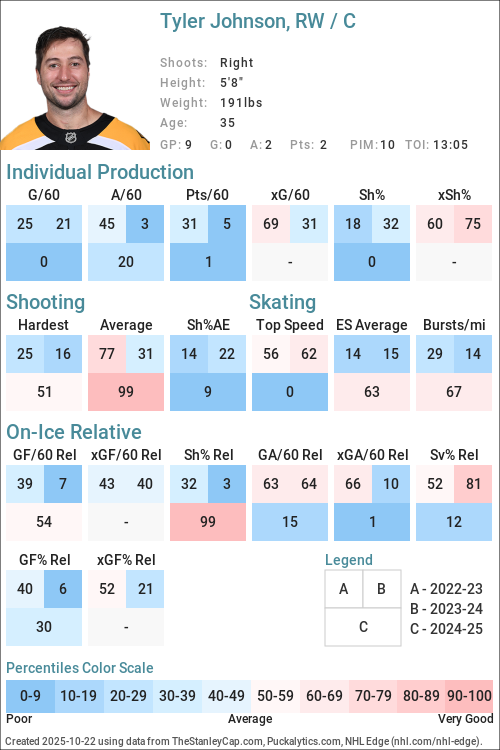
URL: https://thestanleycap.com/cdn/player_cards/20242025/tyler-johnson-8474870.png
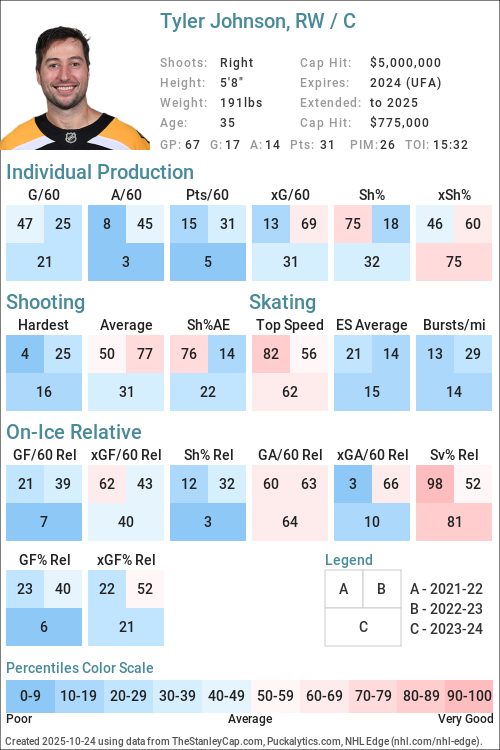
URL: https://thestanleycap.com/cdn/player_cards/20232024/tyler-johnson-8474870.png
About Player Cards
Player cards present an infographic of a players performance using a series of Player Archetypes developed for Puckalytics.com and TheStanleyCap.com. The boxes in the rink image show the archetype ratings for the season specified in the card while the graphs to the right show the five-year trends for those archetypes.
Except for Faceoffs, the values shown are the players z-score (standard deviation from the mean) for the specific metric used to calculate the archetype values. When calculating z-scores forwards were compared to forwards and defensemen were compared to defensemen. Positive values indicate the player is above average and shaded in blue, while negative values indicate the player is below average and shaded in pink. The five year trend charts show a range of -4.0 to 4.0.
The value shown for Faceoffs is the faceoff winning percentage rather than their z-score with winning percentages below 50 in pink shades and above 50 in blue shades.
All archetypes are 5v5 except 5v4 TOI, 4v5 TOI, Skating (even strength) and Faceoffs (all situations). Archetypes use regular season data only.
Archetypes Summary
- Sniper - Measures the to score above the expected goal rate.
- Rebound - Measures the percent of a players shot attempts that come from rebounds (forwards only).
- 5v4 TOI - Powerplay ice time, calculated as the percentage of his teams 5v4 ice time that the player was on the ice for.
- Shooter - Measures whether a players points come from shots (goals or assists on rebounds from his shots).
- Producer - Measures a players ability to produce goals and assists, adjusted for quality of teammates.
- Playmaker - Measures whether a players points come from passes.
- Drive - Measures a players ability to drive puck possession and generate shot attempts for his team.
- Rush - Measures the percent of a players shot attempts that come from rush plays
- Possession - An indicator of a players ability to improve his teams puck possession game.
- Faceoffs - Faceoff Winning Percentage (min. 75 faceoffs taken).
- 5v5 TOI - The percentage of his teams 5v5 TOI that the player was on the ice for.
- Suppress - Measures a players ability to suppress opponent puck possession and shot attempts against.
- Skating - An indicator of a players skating ability, or speed bursts above 20mph per mile skated.
- Defend - An indicator of a players ability to suppress shot quality against.
- 4v5 TOI - Penalty Kill ice time, calculated as the percentage of his teams 4v5 ice time that the player was on the ice for.
Data Sources
- Salary data is from TheStanleyCap.com
- Skating data is from NHL Edge
- Other statistics are from Puckalytics.com and derived from data from NHL.com
Terms of Use
You are free to use include player cards in written articles, share on social media, or on other public websites under the following conditions:
- You credit TheStanleyCap.com as the source and provide a link back to TheStanleyCap.com or this player page.
- You do not mass copy/duplicate/publish dozens or hundreds of player cards. A few, or a handful for a written article is fine. Be reasonable. Fair use rules apply.
- If you are a high-traffic website you must download and host the image(s) on your site rather than overload TheStanleyCap servers with traffic.
Note: Player cards will update daily throughout the season so if you want to include snapshot then you must download the image.
If you have any questions, send an e-mail to the e-mail address at the top of this page.
Read Introducing Player Archetypes on HockeyAnalysis.com for more details on archetype calculations.
Core Archetypes
| Season | Team(s) | GP | TOI | Producer | Playmaker | Shooter | Sniper | Rebound | Rush | Skating | Defend |
|---|---|---|---|---|---|---|---|---|---|---|---|
| 2015-16 | TBL | 69 | -0.25 | -0.51 | 0.05 | -0.13 | 0.98 | 0.77 | - | 0.16 | |
| 2016-17 | TBL | 66 | 0.49 | 0.48 | -0.05 | 0.27 | -0.91 | -0.11 | - | -0.64 | |
| 2017-18 | TBL | 81 | 0.28 | -0.04 | 0.29 | 0.11 | -0.36 | 0.09 | - | 0.68 | |
| 2018-19 | TBL | 80 | -0.08 | -1.16 | 1.69 | 1.82 | 0.82 | -0.94 | - | 0.12 | |
| 2019-20 | TBL | 65 | -0.03 | -0.49 | 0.36 | 0.14 | 0.93 | -0.27 | - | 1.57 | |
| 2020-21 | TBL | 55 | 0.10 | 0.27 | -0.34 | -0.35 | -0.42 | -0.65 | - | -0.22 | |
| 2021-22 | CHI | 26 | -1.00 | -1.44 | 0.21 | 0.63 | -1.16 | -2.04 | -0.95 | 2.25 | |
| 2022-23 | CHI | 56 | -0.32 | 0.02 | -0.56 | -1.10 | 1.79 | -0.68 | -0.65 | 0.05 | |
| 2023-24 | CHI | 67 | -1.20 | -1.37 | -0.19 | -0.78 | -0.20 | 0.36 | -0.96 | 0.85 | |
| 2024-25 | BOS | 9 | -2.06 | -0.88 | -1.58 | -1.17 | -2.61 | 5.69 | 0.35 | -1.14 |
Situational and Secondary Archetypes
| Season | Team(s) | GP | TOI | 5v5 TOI | 5v4 TOI | 4v5 TOI | Possession | Drive | Suppress | Faceoffs |
|---|---|---|---|---|---|---|---|---|---|---|
| 2015-16 | TBL | 69 | 0.55 | 0.50 | -1.09 | 0.16 | 0.70 | -0.81 | 48.6 | |
| 2016-17 | TBL | 66 | 0.63 | 0.60 | 1.06 | -0.58 | -0.07 | -1.09 | 52.0 | |
| 2017-18 | TBL | 81 | 0.21 | 0.12 | 0.25 | -0.49 | 0.30 | -1.38 | 50.1 | |
| 2018-19 | TBL | 80 | 0.64 | -0.54 | -1.37 | -0.47 | 0.82 | -1.88 | 48.6 | |
| 2019-20 | TBL | 65 | -0.07 | -0.10 | -1.83 | 0.54 | 0.35 | 0.44 | 49.0 | |
| 2020-21 | TBL | 55 | -0.11 | -0.54 | -2.17 | 0.28 | -0.30 | 0.86 | 54.8 | |
| 2021-22 | CHI | 26 | -1.09 | -0.02 | -1.86 | -1.54 | 0.17 | -3.83 | - | |
| 2022-23 | CHI | 56 | 0.39 | 0.61 | -1.86 | -0.08 | -0.37 | 0.50 | 51.3 | |
| 2023-24 | CHI | 67 | -0.16 | 0.69 | -1.96 | -0.87 | -0.31 | -1.27 | 44.4 | |
| 2024-25 | BOS | 9 | -0.34 | -1.16 | -2.11 | -2.02 | -1.70 | -0.71 | - |
5v5 Individual Stats
| Season | Team(s) | GP | TOI | G/60 | A/60 | Pts/60 | xG/60 | GAE/60 | Sh% | xSh% | Sh%AE | %SA Rush | %SA Reb. |
|---|---|---|---|---|---|---|---|---|---|---|---|---|---|
| 2015-16 | TBL | 69 | 865:23 | 0.69 | 0.83 | 1.53 | 0.76 | -0.07 | 8.20 | 9.04 | -0.84 | 5.56 | 7.41 |
| 2016-17 | TBL | 66 | 844:18 | 0.71 | 0.99 | 1.71 | 0.66 | 0.05 | 11.90 | 11.06 | 0.84 | 3.79 | 3.03 |
| 2017-18 | TBL | 81 | 998:43 | 0.78 | 0.96 | 1.74 | 0.75 | 0.03 | 9.56 | 9.22 | 0.34 | 4.15 | 4.15 |
| 2018-19 | TBL | 80 | 1042:02 | 1.32 | 0.63 | 1.96 | 0.85 | 0.47 | 16.91 | 10.91 | 6.00 | 2.20 | 7.14 |
| 2019-20 | TBL | 65 | 750:10 | 0.88 | 0.88 | 1.76 | 0.85 | 0.03 | 12.09 | 11.70 | 0.39 | 3.28 | 9.02 |
| 2020-21 | TBL | 55 | 631:40 | 0.57 | 1.04 | 1.61 | 0.65 | -0.08 | 9.52 | 10.93 | -1.41 | 2.33 | 4.65 |
| 2021-22 | CHI | 26 | 267:56 | 0.67 | 0.45 | 1.12 | 0.55 | 0.12 | 12.50 | 10.28 | 2.22 | 0.00 | 3.12 |
| 2022-23 | CHI | 56 | 732:22 | 0.49 | 0.90 | 1.39 | 0.82 | -0.33 | 6.82 | 11.38 | -4.57 | 2.42 | 12.90 |
| 2023-24 | CHI | 67 | 808:50 | 0.45 | 0.30 | 0.74 | 0.60 | -0.15 | 8.33 | 11.22 | -2.88 | 4.63 | 7.41 |
| 2024-25 | BOS | 9 | 102:17 | 0.00 | 0.59 | 0.59 | 0.13 | -0.13 | 0.00 | 4.49 | -4.49 | 11.11 | 0.00 |
5v5 On Ice Stats
| Season | Team(s) | GP | TOI | SAF/60 | GF/60 | xGF/60 | SAA/60 | GA/60 | xGA/60 | GF% | xGF% | xGF Rel | xGA Rel | xGF% Rel |
|---|---|---|---|---|---|---|---|---|---|---|---|---|---|---|
| 2015-16 | TBL | 69 | 865:23 | 43.89 | 2.70 | 2.44 | 40.98 | 1.94 | 2.22 | 58.21 | 52.35 | 0.31 | 0.26 | 0.22 |
| 2016-17 | TBL | 66 | 844:18 | 41.00 | 2.42 | 2.35 | 42.64 | 2.63 | 2.28 | 47.89 | 50.79 | 0.11 | 0.17 | -0.73 |
| 2017-18 | TBL | 81 | 998:43 | 45.96 | 2.52 | 2.62 | 45.30 | 2.28 | 2.51 | 52.50 | 51.11 | 0.12 | 0.36 | -2.69 |
| 2018-19 | TBL | 80 | 1042:02 | 46.99 | 3.57 | 2.93 | 45.78 | 2.65 | 2.80 | 57.41 | 51.11 | 0.32 | 0.51 | -2.14 |
| 2019-20 | TBL | 65 | 750:10 | 43.03 | 2.88 | 2.74 | 39.51 | 1.52 | 2.32 | 65.45 | 54.14 | 0.43 | 0.20 | 2.04 |
| 2020-21 | TBL | 55 | 631:40 | 39.89 | 2.28 | 2.22 | 35.34 | 2.18 | 2.16 | 51.06 | 50.72 | -0.26 | -0.12 | -1.48 |
| 2021-22 | CHI | 26 | 267:56 | 35.61 | 2.02 | 2.31 | 53.07 | 3.58 | 2.95 | 36.00 | 43.87 | 0.19 | 0.53 | -2.76 |
| 2022-23 | CHI | 56 | 732:22 | 35.64 | 1.97 | 2.16 | 42.85 | 2.87 | 2.82 | 40.68 | 43.33 | -0.06 | -0.04 | -0.36 |
| 2023-24 | CHI | 67 | 808:50 | 33.83 | 1.04 | 1.97 | 49.85 | 2.97 | 3.02 | 25.93 | 39.47 | -0.07 | 0.22 | -2.66 |
| 2024-25 | BOS | 9 | 102:17 | 32.85 | 2.35 | 1.32 | 40.48 | 2.35 | 2.58 | 50.00 | 33.85 | -0.96 | 0.78 | -22.07 |
NHL Edge Stats
| Skating | Shooting | Zone Time | |||||||||||
|---|---|---|---|---|---|---|---|---|---|---|---|---|---|
| Season | GP | Top Speed | Bursts>20/mi | Avg. Speed | Top Speed | Avg. Speed | %Long Range | %Mid Range | %High Danger | ES DZ% | ES NZ% | ES OZ% | |
| This table is for Basic and Premium subscribers only. To view please login to and/or subscribe to one of our subscription plans. | |||||||||||||
Legend
| Percentile 0-25 | Percentile 25-50 | Percentile 50-75 | Percentile 75-100 |
5v5 Lines
| Season | Teammate | Teammate | Team | TOI | GF/60 | GA/60 | GF% | xGF/60 | xGA/60 | xGF% | xGF Rel | xGA Rel | xGF% Rel |
|---|
Glossary
| Type | Statistic | Definition |
|---|---|---|
| Individual | G/60 | Goals Against per 60 minutes. |
| Individual | A/60 | Assists per 60 minutes. |
| Individual | Pts/60 | Points per 60 minutes. |
| Individual | xG/60 | Expected Goals per 60 minutes. |
| Individual | GAE/60 | Goals Above Expected (G/60 - xG/60). |
| Individual | Sh% | Shooting Percentage. |
| Individual | xSh% | Expected Shooting Percentage. |
| Individual | Sh%AE | Shooting percentage above expected (Sh% - xSh%). |
| Individual | %SA Rush | Percentage of shot attempts determined to be on the rush. |
| Individual | %SA Reb. | Percentage of shot attempts determined to be from rebounds. |
| On Ice | SAF/60 | Shot Attempts For per 60 minutes. |
| On Ice | GF/60 | Goals For per 60 minutes. |
| On Ice | xGF/60 | Expected Goals For per 60 minutes. |
| On Ice | SAA/60 | Shot Attempts Against per 60 minutes (lower is better). |
| On Ice | GA/60 | Goals Against per 60 minutes (lower is better). |
| On Ice | xGA/60 | Expected Goals Against per 60 minutes (lower is better). |
| On Ice | GF% | Goals For Percentage = Goals For / (Goals For + Goals Against) |
| On Ice | xGF% | Expected Goals For Percentage = Expected Goals For / (Expected Goals For + Expected Goals Against) |
| On Ice | xGF Rel | xGF/60 when On Ice - xGF/60 when not On Ice. |
| On Ice | xGA Rel | xGA/60 when On Ice - xGA/60 when not On Ice (lower is better). |
| On Ice | xGF% Rel | xGF% when On Ice - xGF% when not On Ice. |
News and Opinions
-
Tyler Johnson on the Leafs’ 2-0 Win, Atlantic Chaos & What Makes a Champion: Leafs Morning Take at The Leafs Nation (Tue Dec 9, 2025)
-
Former Lightning forward, Tyler Johnson Hangs up his skates after 13 season career at Bolts by the Bay (Mon Jul 7, 2025)
-
Blackhawks News: Tyler Johnson announces retirement at Blackhawk Up (Mon Jul 7, 2025)
-
Tyler Johnson hangs up the skates at Raw Charge (Mon Jul 7, 2025)
-
Anaheim Ducks: Buying Into A Championship at Pucks of a Feather (Sat Jul 10, 2021)
-
The Third Team: Potential Return In Erik Karlsson Trade Scenario at Devils Army (Mon Jul 9, 2018)
-
DAB Stanley Cup Finals Picks at Devils Army (Tue Jun 2, 2015)
Tyler Johnson signed a $775,000 1-year contract with the Boston Bruins and General Manager Don Sweeney on November 4, 2024 with an AAV of $775,000. This contract will start in 2024-25 and end after the 2024-25 season. In the first season of the contract the cap hit was equivalent to 0.88% of the salary cap. The Boston Bruins terminated this contract on December 20, 2024.
Standard Contract (UFA) ( ) (0 ratings)
| Season | Age* | Clause | Cap Hit | AAV | Perf. Bonus | Sign. Bonus | Salary | Compensation | Minors Salary | Status | |
|---|---|---|---|---|---|---|---|---|---|---|---|
| 2024-25 | 34 | $775,000 | $775,000 | - | - | $775,000 | $775,000 | $775,000 | UFA | ||
| Total | - | - | $775,000 | $775,000 | $775,000 |
Tyler Johnson signed a $35,000,000 7-year contract with the Tampa Bay Lightning and General Manager Steve Yzerman on July 10, 2017 with an AAV of $5,000,000. This contract will start in 2017-18 and end after the 2023-24 season. In the first season of the contract the cap hit was equivalent to 6.67% of the salary cap.
Standard Contract (RFA) ( ) (0 ratings)
| Season | Age* | Clause | Cap Hit | AAV | Perf. Bonus | Sign. Bonus | Salary | Compensation | Minors Salary | Status | |
|---|---|---|---|---|---|---|---|---|---|---|---|
| 2017-18 | 27 | $5,000,000 | $5,000,000 | - | - | $5,000,000 | $5,000,000 | $5,000,000 | RFA-arb | ||
| 2018-19 | 28 | NTC | $5,000,000 | $5,000,000 | - | - | $6,750,000 | $6,750,000 | $6,750,000 | UFA | |
| 2019-20 | 29 | NTC | $5,000,000 | $5,000,000 | - | - | $5,500,000 | $5,500,000 | $5,500,000 | UFA | |
| 2020-21 | 30 | NTC | $5,000,000 | $5,000,000 | - | - | $3,750,000 | $3,750,000 | $3,750,000 | UFA | |
| 2021-22 | 31 | M-NTC | $5,000,000 | $5,000,000 | - | - | $5,500,000 | $5,500,000 | $5,500,000 | UFA | |
| 2022-23 | 32 | M-NTC | $5,000,000 | $5,000,000 | - | - | $3,750,000 | $3,750,000 | $3,750,000 | UFA | |
| 2023-24 | 33 | M-NTC | $5,000,000 | $5,000,000 | - | - | $4,750,000 | $4,750,000 | $4,750,000 | UFA | |
| Total | - | - | $35,000,000 | $35,000,000 | $35,000,000 |
Tyler Johnson signed a $10,000,000 3-year contract with the Tampa Bay Lightning and General Manager Steve Yzerman on May 26, 2014 with an AAV of $3,333,333. This contract will start in 2014-15 and end after the 2016-17 season. In the first season of the contract the cap hit was equivalent to 4.83% of the salary cap.
Standard Contract (RFA) ( ) (0 ratings)
| Season | Age* | Clause | Cap Hit | AAV | Perf. Bonus | Sign. Bonus | Salary | Compensation | Minors Salary | Status | |
|---|---|---|---|---|---|---|---|---|---|---|---|
| 2014-15 | 24 | $3,333,333 | $3,333,333 | - | - | $2,800,000 | $2,800,000 | $2,800,000 | RFA-arb | ||
| 2015-16 | 25 | $3,333,333 | $3,333,333 | - | - | $3,200,000 | $3,200,000 | $3,200,000 | RFA-arb | ||
| 2016-17 | 26 | $3,333,333 | $3,333,333 | - | - | $4,000,000 | $4,000,000 | $4,000,000 | RFA-arb | ||
| Total | - | - | $10,000,000 | $10,000,000 | $10,000,000 |
Tyler Johnson signed a $2,270,000 3-year contract with the Tampa Bay Lightning and General Manager Steve Yzerman on March 7, 2011 with an AAV of $756,667. This contract will start in 2011-12 and end after the 2013-14 season. In the first season of the contract the cap hit was equivalent to 1.18% of the salary cap.
Entry Level Contract ( ) (0 ratings)
| Season | Age* | Clause | Cap Hit | AAV | Perf. Bonus | Sign. Bonus | Salary | Compensation | Minors Salary | Status | |
|---|---|---|---|---|---|---|---|---|---|---|---|
| 2011-12 | 21 | $756,667 | $900,000 | $210,000 | $90,000 | $600,000 | $690,000 | $67,500 | ELC | ||
| 2012-13 | 22 | $756,667 | $900,000 | $160,000 | $90,000 | $650,000 | $740,000 | $67,500 | ELC | ||
| 2013-14 | 23 | $756,667 | $900,000 | $60,000 | $90,000 | $750,000 | $840,000 | $67,500 | ELC | ||
| Total | $430,000 | $270,000 | $2,000,000 | $2,270,000 | $202,500 |
Career Statistics
| Regular Season | Playoffs | |||||||||||||||||||
|---|---|---|---|---|---|---|---|---|---|---|---|---|---|---|---|---|---|---|---|---|
| Season | League | Team | GP | G | A | Pts | +/- | PIM | Shots | Sh% | TOI/G | GP | G | A | Pts | +/- | PIM | Shots | Sh% | TOI/G |
| 2005-06 | NPHL | Coeur d'Alene Colts | 11 | 4 | 3 | 7 | 2 | 2 | 1 | 1 | 2 | 4 | ||||||||
| 2006-07 | NPHL | Coeur d'Alene Lakers | 39 | 56 | 64 | 120 | 57 | 7 | 4 | 12 | 16 | 14 | ||||||||
| 2007-08 | WHL | Spokane | 69 | 13 | 22 | 35 | 34 | 21 | 5 | 3 | 8 | 24 | ||||||||
| 2007-08 | M-Cup | Spokane | 4 | 2 | ||||||||||||||||
| 2008-09 | WJ18-A | USA | 6 | 1 | 0 | 1 | -2 | 2 | ||||||||||||
| 2008-09 | WHL | Spokane | 62 | 26 | 35 | 61 | 52 | 12 | 5 | 3 | 8 | 8 | ||||||||
| 2009-10 | WJC-A | USA | 7 | 3 | 2 | 5 | +4 | 25 | ||||||||||||
| 2009-10 | WHL | Spokane | 64 | 36 | 35 | 71 | 32 | 7 | 3 | 5 | 8 | |||||||||
| 2010-11 | WHL | Spokane | 71 | 53 | 62 | 115 | 48 | 14 | 7 | 7 | 14 | 9 | ||||||||
| 2011-12 | AHL | Norfolk | 75 | 31 | 37 | 68 | +17 | 28 | 222 | 1,396.0 | 14 | 6 | 8 | 14 | +8 | 6 | 37 | 1,622.0 | ||
| 2012-13 | NHL | Tampa Bay Lightning | 14 | 3 | 3 | 6 | +3 | 4 | 11 | 27.3 | 13:04 | |||||||||
| 2012-13 | AHL | Syracuse | 62 | 37 | 28 | 65 | +26 | 34 | 191 | 1,937.0 | 18 | 10 | 11 | 21 | +12 | 18 | 55 | 1,818.0 | ||
| 2013-14 | WC-A | USA | 7 | 4 | 3 | 7 | +1 | 2 | 18 | |||||||||||
| 2013-14 | NHL | Tampa Bay Lightning | 82 | 24 | 26 | 50 | +23 | 26 | 181 | 13.3 | 18:47 | 4 | 1 | 1 | 2 | -2 | 11 | 9.1 | 20:59 | |
| 2014-15 | NHL | Tampa Bay Lightning | 77 | 29 | 43 | 72 | +33 | 24 | 203 | 14.3 | 17:14 | 26 | 13 | 10 | 23 | +7 | 24 | 60 | 21.7 | 18:31 |
| 2015-16 | NHL | Tampa Bay Lightning | 69 | 14 | 24 | 38 | +4 | 20 | 167 | 8.4 | 17:08 | 17 | 7 | 10 | 17 | +9 | 12 | 33 | 21.2 | 17:46 |
| 2016-17 | NHL | Tampa Bay Lightning | 66 | 19 | 26 | 45 | -5 | 28 | 130 | 14.6 | 18:49 | |||||||||
| 2017-18 | NHL | Tampa Bay Lightning | 81 | 21 | 29 | 50 | +3 | 24 | 186 | 11.3 | 17:00 | 17 | 3 | 5 | 8 | -1 | 6 | 42 | 7.1 | 16:27 |
| 2018-19 | NHL | Tampa Bay Lightning | 80 | 29 | 18 | 47 | +15 | 28 | 163 | 17.8 | 15:57 | 4 | 1 | 1 | -3 | 4 | 0.0 | 15:37 | ||
| 2019-20 | NHL | Tampa Bay Lightning | 65 | 14 | 17 | 31 | +9 | 16 | 113 | 12.4 | 14:33 | 25 | 4 | 3 | 7 | -6 | 11 | 48 | 8.3 | 15:44 |
| 2020-21 | NHL | Tampa Bay Lightning | 55 | 8 | 14 | 22 | -1 | 16 | 77 | 10.4 | 13:40 | 23 | 4 | 3 | 7 | +3 | 34 | 11.8 | 10:06 | |
| 2021-22 | NHL | Chicago Blackhawks | 26 | 3 | 4 | 7 | -8 | 12 | 30 | 10.0 | 12:59 | |||||||||
| 2022-23 | NHL | Chicago Blackhawks | 56 | 12 | 20 | 32 | -21 | 16 | 125 | 9.6 | 16:34 | |||||||||
| 2023-24 | NHL | Chicago Blackhawks | 67 | 17 | 14 | 31 | -35 | 26 | 112 | 15.2 | 15:32 | |||||||||
| 2024-25 | NHL | Boston Bruins | 9 | 0 | 2 | 2 | -1 | 10 | 6 | 0.0 | 13:05 | |||||||||
| NHL Career | 747 | 193 | 240 | 433 | +19 | 250 | 1504 | 12.8 | 16:24 | 116 | 32 | 33 | 65 | +7 | 53 | 232 | 13.8 | 15:49 | ||