
 Tom Wilson
| Position | Right Wing | Current Team | Washington Capitals |
| Shoots | Right | Current Contract | 7 years ($6.5M CapHit) |
| Height | 6'4" | Expires | 2030-31 |
| Weight (lbs) | 225 | Expiry Age (Jun 30) | 37 |
| Age (DOB) | 32 (Mar 29, 1994) | Expiry Status | UFA |
| Drafted | 2012, Round 1, Overall 16 (WSH) |
| Date | Team | Transaction | |
|---|---|---|---|
| Jan 21, 2026 | Washington Capitals | Activated from IR | |
| Jan 9, 2026 | Washington Capitals | Placed on IR | |
| Aug 4, 2023 | Washington Capitals | Signed 7 years @ $6.500M AAV starting in 2024-25 | |
| Jul 27, 2018 | Washington Capitals | Signed 6 years @ $5.167M AAV starting in 2018-19 | |
| Jun 30, 2016 | Washington Capitals | Signed 2 years @ $2.000M AAV starting in 2016-17 | |
| Jul 19, 2012 | Washington Capitals | Signed to an entry level contract. |
Player Card(s)
URL: https://thestanleycap.com/cdn/player_cards/20252026/tom-wilson-8476880.png

URL: https://thestanleycap.com/cdn/player_cards/20242025/tom-wilson-8476880.png

URL: https://thestanleycap.com/cdn/player_cards/20232024/tom-wilson-8476880.png
About Player Cards
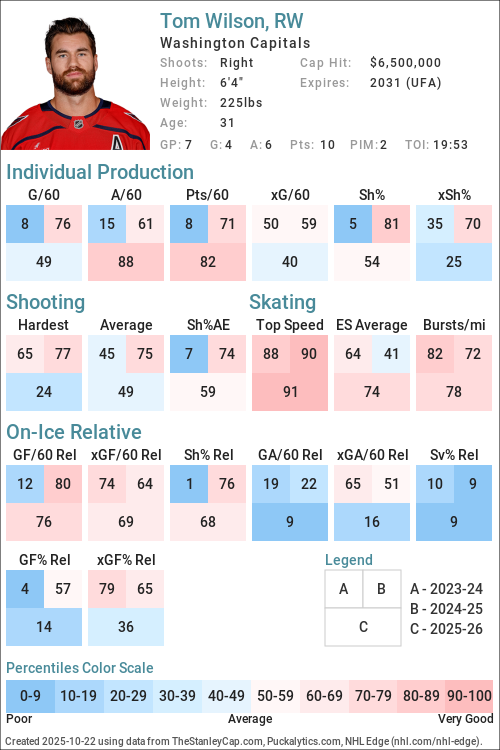
Player cards present an infographic of a players performance using a series of Player Archetypes developed for Puckalytics.com and TheStanleyCap.com. The boxes in the rink image show the archetype ratings for the season specified in the card while the graphs to the right show the five-year trends for those archetypes.
Except for Faceoffs, the values shown are the players z-score (standard deviation from the mean) for the specific metric used to calculate the archetype values. When calculating z-scores forwards were compared to forwards and defensemen were compared to defensemen. Positive values indicate the player is above average and shaded in blue, while negative values indicate the player is below average and shaded in pink. The five year trend charts show a range of -4.0 to 4.0.
The value shown for Faceoffs is the faceoff winning percentage rather than their z-score with winning percentages below 50 in pink shades and above 50 in blue shades.
All archetypes are 5v5 except 5v4 TOI, 4v5 TOI, Skating (even strength) and Faceoffs (all situations). Archetypes use regular season data only.
Archetypes Summary
- Sniper - Measures the to score above the expected goal rate.
- Rebound - Measures the percent of a players shot attempts that come from rebounds (forwards only).
- 5v4 TOI - Powerplay ice time, calculated as the percentage of his teams 5v4 ice time that the player was on the ice for.
- Shooter - Measures whether a players points come from shots (goals or assists on rebounds from his shots).
- Producer - Measures a players ability to produce goals and assists, adjusted for quality of teammates.
- Playmaker - Measures whether a players points come from passes.
- Drive - Measures a players ability to drive puck possession and generate shot attempts for his team.
- Rush - Measures the percent of a players shot attempts that come from rush plays
- Possession - An indicator of a players ability to improve his teams puck possession game.
- Faceoffs - Faceoff Winning Percentage (min. 75 faceoffs taken).
- 5v5 TOI - The percentage of his teams 5v5 TOI that the player was on the ice for.
- Suppress - Measures a players ability to suppress opponent puck possession and shot attempts against.
- Skating - An indicator of a players skating ability, or speed bursts above 20mph per mile skated.
- Defend - An indicator of a players ability to suppress shot quality against.
- 4v5 TOI - Penalty Kill ice time, calculated as the percentage of his teams 4v5 ice time that the player was on the ice for.
Data Sources
- Salary data is from TheStanleyCap.com
- Skating data is from NHL Edge
- Other statistics are from Puckalytics.com and derived from data from NHL.com
Terms of Use
You are free to use include player cards in written articles, share on social media, or on other public websites under the following conditions:
- You credit TheStanleyCap.com as the source and provide a link back to TheStanleyCap.com or this player page.
- You do not mass copy/duplicate/publish dozens or hundreds of player cards. A few, or a handful for a written article is fine. Be reasonable. Fair use rules apply.
- If you are a high-traffic website you must download and host the image(s) on your site rather than overload TheStanleyCap servers with traffic.
Note: Player cards will update daily throughout the season so if you want to include snapshot then you must download the image.
If you have any questions, send an e-mail to the e-mail address at the top of this page.
Read Introducing Player Archetypes on HockeyAnalysis.com for more details on archetype calculations.
Core Archetypes
| Season | Team(s) | GP | TOI | Producer | Playmaker | Shooter | Sniper | Rebound | Rush | Skating | Defend |
|---|---|---|---|---|---|---|---|---|---|---|---|
| 2015-16 | WSH | 81 | -0.38 | 0.02 | -0.64 | -0.62 | -0.85 | -1.29 | - | -0.47 | |
| 2016-17 | WSH | 82 | -0.53 | -0.03 | -0.76 | -0.69 | 0.29 | -0.56 | - | 0.34 | |
| 2017-18 | WSH | 78 | -0.10 | -0.34 | -0.04 | 0.29 | 0.07 | -0.07 | - | -0.51 | |
| 2018-19 | WSH | 63 | 0.38 | -0.23 | 0.66 | 1.20 | 0.72 | 0.02 | - | -0.60 | |
| 2019-20 | WSH | 68 | -0.14 | 0.45 | -0.69 | -0.67 | 1.44 | -1.47 | - | -2.37 | |
| 2020-21 | WSH | 47 | 0.35 | 1.28 | -0.78 | -0.19 | -0.08 | -0.43 | - | 0.57 | |
| 2021-22 | WSH | 77 | -0.52 | -0.43 | -0.43 | 0.90 | -0.21 | -0.61 | 0.97 | -0.81 | |
| 2022-23 | WSH | 33 | -0.48 | -0.32 | -0.43 | 0.39 | 3.29 | -0.42 | -0.20 | -1.56 | |
| 2023-24 | WSH | 74 | -1.25 | -0.57 | -1.13 | -1.46 | 0.48 | -0.34 | 0.80 | -1.17 | |
| 2024-25 | WSH | 81 | -0.06 | -0.57 | 0.35 | 0.70 | 0.19 | 0.41 | 0.52 | -1.31 | |
| 2025-26 | WSH | 72 | 1.32 | 0.48 | 1.14 | 1.55 | -0.71 | 0.18 | 0.40 | -0.84 |
Situational and Secondary Archetypes
| Season | Team(s) | GP | TOI | 5v5 TOI | 5v4 TOI | 4v5 TOI | Possession | Drive | Suppress | Faceoffs |
|---|---|---|---|---|---|---|---|---|---|---|
| 2015-16 | WSH | 81 | -0.64 | -1.92 | 0.36 | -1.49 | -1.08 | -1.24 | - | |
| 2016-17 | WSH | 82 | -0.77 | -2.05 | 0.87 | -0.62 | -1.46 | 1.04 | - | |
| 2017-18 | WSH | 78 | 0.89 | -2.05 | 0.55 | 0.44 | 0.70 | -0.33 | - | |
| 2018-19 | WSH | 63 | 0.75 | -0.60 | 1.20 | -0.21 | 1.03 | -1.88 | - | |
| 2019-20 | WSH | 68 | 0.87 | -0.29 | 0.34 | -0.74 | -0.12 | -1.25 | - | |
| 2020-21 | WSH | 47 | 0.21 | -0.36 | 0.07 | -0.75 | -0.66 | -0.50 | - | |
| 2021-22 | WSH | 77 | 0.75 | 0.41 | 0.62 | -0.39 | -0.55 | 0.12 | - | |
| 2022-23 | WSH | 33 | 0.35 | 0.02 | 0.83 | -0.64 | -0.36 | -0.62 | - | |
| 2023-24 | WSH | 74 | 0.44 | 0.27 | 0.60 | 1.09 | 0.77 | 0.67 | - | |
| 2024-25 | WSH | 81 | 0.57 | 0.98 | 0.37 | 0.46 | 0.31 | 0.29 | - | |
| 2025-26 | WSH | 72 | 0.72 | 0.60 | 1.00 | 2.23 | 1.16 | 1.89 | - |
5v5 Individual Stats
| Season | Team(s) | GP | TOI | G/60 | A/60 | Pts/60 | xG/60 | GAE/60 | Sh% | xSh% | Sh%AE | %SA Rush | %SA Reb. |
|---|---|---|---|---|---|---|---|---|---|---|---|---|---|
| 2015-16 | WSH | 81 | 879:19 | 0.48 | 0.89 | 1.36 | 0.65 | -0.17 | 7.29 | 9.88 | -2.59 | 1.50 | 3.01 |
| 2016-17 | WSH | 82 | 855:44 | 0.42 | 0.84 | 1.26 | 0.57 | -0.15 | 7.14 | 9.69 | -2.55 | 2.86 | 5.71 |
| 2017-18 | WSH | 78 | 1062:42 | 0.68 | 1.13 | 1.81 | 0.62 | 0.06 | 11.22 | 10.25 | 0.96 | 3.82 | 5.10 |
| 2018-19 | WSH | 63 | 835:49 | 1.08 | 1.00 | 2.08 | 0.80 | 0.28 | 15.00 | 11.08 | 3.92 | 4.14 | 6.90 |
| 2019-20 | WSH | 68 | 885:19 | 0.61 | 1.15 | 1.76 | 0.79 | -0.18 | 8.49 | 11.03 | -2.54 | 0.70 | 10.56 |
| 2020-21 | WSH | 47 | 588:24 | 0.51 | 1.53 | 2.04 | 0.55 | -0.04 | 8.93 | 9.62 | -0.70 | 2.82 | 5.63 |
| 2021-22 | WSH | 77 | 1033:20 | 0.75 | 0.93 | 1.68 | 0.58 | 0.18 | 13.40 | 10.24 | 3.17 | 2.82 | 5.63 |
| 2022-23 | WSH | 33 | 421:10 | 0.71 | 0.85 | 1.57 | 0.65 | 0.06 | 9.80 | 8.92 | 0.89 | 2.94 | 17.65 |
| 2023-24 | WSH | 74 | 963:58 | 0.31 | 0.56 | 0.87 | 0.70 | -0.39 | 4.39 | 9.84 | -5.45 | 3.16 | 9.49 |
| 2024-25 | WSH | 81 | 1077:57 | 0.83 | 1.00 | 1.84 | 0.68 | 0.15 | 13.89 | 11.39 | 2.50 | 3.05 | 7.93 |
| 2025-26 | WSH | 72 | 949:42 | 1.07 | 1.26 | 2.34 | 0.73 | 0.34 | 18.09 | 12.35 | 5.73 | 2.92 | 5.84 |
5v5 On Ice Stats
| Season | Team(s) | GP | TOI | SAF/60 | GF/60 | xGF/60 | SAA/60 | GA/60 | xGA/60 | GF% | xGF% | xGF Rel | xGA Rel | xGF% Rel |
|---|---|---|---|---|---|---|---|---|---|---|---|---|---|---|
| 2015-16 | WSH | 81 | 879:19 | 37.12 | 2.32 | 2.02 | 41.69 | 2.32 | 2.22 | 50.00 | 47.59 | -0.35 | 0.14 | -5.62 |
| 2016-17 | WSH | 82 | 855:44 | 35.76 | 2.10 | 2.08 | 36.46 | 1.47 | 1.92 | 58.82 | 52.00 | -0.29 | -0.32 | 0.60 |
| 2017-18 | WSH | 78 | 1062:42 | 42.80 | 3.16 | 2.67 | 45.17 | 2.54 | 2.64 | 55.45 | 50.29 | 0.45 | 0.17 | 2.97 |
| 2018-19 | WSH | 63 | 835:49 | 45.80 | 3.37 | 2.72 | 47.67 | 2.87 | 2.98 | 54.02 | 47.72 | 0.31 | 0.47 | -1.30 |
| 2019-20 | WSH | 68 | 885:19 | 43.31 | 3.05 | 2.77 | 44.19 | 3.73 | 2.78 | 45.00 | 49.92 | 0.13 | 0.38 | -2.40 |
| 2020-21 | WSH | 47 | 588:24 | 38.34 | 3.26 | 2.25 | 40.58 | 2.35 | 2.15 | 58.18 | 51.11 | -0.20 | -0.05 | -1.55 |
| 2021-22 | WSH | 77 | 1033:20 | 39.72 | 3.25 | 2.49 | 39.48 | 2.55 | 2.43 | 56.00 | 50.60 | -0.04 | 0.09 | -1.26 |
| 2022-23 | WSH | 33 | 421:10 | 40.32 | 2.71 | 2.50 | 45.73 | 3.85 | 3.14 | 41.30 | 44.31 | -0.17 | 0.22 | -3.47 |
| 2023-24 | WSH | 74 | 963:58 | 40.58 | 1.49 | 2.52 | 40.52 | 2.86 | 2.41 | 34.29 | 51.14 | 0.32 | -0.06 | 4.05 |
| 2024-25 | WSH | 81 | 1077:57 | 42.69 | 3.28 | 2.71 | 38.68 | 2.62 | 2.49 | 55.66 | 52.14 | 0.17 | 0.04 | 1.23 |
| 2025-26 | WSH | 72 | 949:42 | 44.86 | 3.22 | 3.01 | 35.38 | 2.21 | 2.47 | 59.30 | 54.92 | 0.36 | -0.29 | 5.95 |
NHL Edge Stats
| Skating | Shooting | Zone Time | |||||||||||
|---|---|---|---|---|---|---|---|---|---|---|---|---|---|
| Season | GP | Top Speed | Bursts>20/mi | Avg. Speed | Top Speed | Avg. Speed | %Long Range | %Mid Range | %High Danger | ES DZ% | ES NZ% | ES OZ% | |
| This table is for Basic and Premium subscribers only. To view please login to and/or subscribe to one of our subscription plans. | |||||||||||||
Legend
| Percentile 0-25 | Percentile 25-50 | Percentile 50-75 | Percentile 75-100 |
5v5 Lines
| Season | Teammate | Teammate | Team | TOI | GF/60 | GA/60 | GF% | xGF/60 | xGA/60 | xGF% | xGF Rel | xGA Rel | xGF% Rel |
|---|
Glossary
| Type | Statistic | Definition |
|---|---|---|
| Individual | G/60 | Goals Against per 60 minutes. |
| Individual | A/60 | Assists per 60 minutes. |
| Individual | Pts/60 | Points per 60 minutes. |
| Individual | xG/60 | Expected Goals per 60 minutes. |
| Individual | GAE/60 | Goals Above Expected (G/60 - xG/60). |
| Individual | Sh% | Shooting Percentage. |
| Individual | xSh% | Expected Shooting Percentage. |
| Individual | Sh%AE | Shooting percentage above expected (Sh% - xSh%). |
| Individual | %SA Rush | Percentage of shot attempts determined to be on the rush. |
| Individual | %SA Reb. | Percentage of shot attempts determined to be from rebounds. |
| On Ice | SAF/60 | Shot Attempts For per 60 minutes. |
| On Ice | GF/60 | Goals For per 60 minutes. |
| On Ice | xGF/60 | Expected Goals For per 60 minutes. |
| On Ice | SAA/60 | Shot Attempts Against per 60 minutes (lower is better). |
| On Ice | GA/60 | Goals Against per 60 minutes (lower is better). |
| On Ice | xGA/60 | Expected Goals Against per 60 minutes (lower is better). |
| On Ice | GF% | Goals For Percentage = Goals For / (Goals For + Goals Against) |
| On Ice | xGF% | Expected Goals For Percentage = Expected Goals For / (Expected Goals For + Expected Goals Against) |
| On Ice | xGF Rel | xGF/60 when On Ice - xGF/60 when not On Ice. |
| On Ice | xGA Rel | xGA/60 when On Ice - xGA/60 when not On Ice (lower is better). |
| On Ice | xGF% Rel | xGF% when On Ice - xGF% when not On Ice. |
News and Opinions
-
Connor McMichael recalls the angriest he’s ever seen Capitals’ Tom Wilson: ‘Even going into the intermission, he was still seeing red’ at Russian Machine Never Breaks (Fri Jul 24, 2026)
-
« Je n’ai jamais vu Tom Wilson plus fâché que contre le Canadien » at Dans Les Coulisses (Thu Jul 23, 2026)
-
Tom Wilson singlehandedly set a domino effect for the Rangers with one game at Blue Line Station (Wed Jul 22, 2026)
-
Vincent Desharnais raconte l'insulte hilarante que lui a lancée Tom Wilson at HABSolument Fan (Sun Jul 12, 2026)
-
Gleb Pugachyov a manqué de respect envers Tom Wilson, selon Vincent Desharnais at Dans Les Coulisses (Sat Jul 11, 2026)
-
Vincent Desharnais fires back after Canadiens prospect Gleb Pugachyov's bold Tom Wilson comments at Habs Fanatics (Sat Jul 11, 2026)
-
Canadiens first-round pick Gleb Pugachyov makes bold claim about fighting Tom Wilson: ‘There would be nothing left of him’ at Russian Machine Never Breaks (Tue Jun 30, 2026)
-
Gleb Pugachyov est prêt à détruire Tom Wilson dans une bataille at Dans Les Coulisses (Tue Jun 30, 2026)
-
Surprise acquisition for Kent Hughes and the Montreal Canadiens: 'He's a Tom Wilson style of player' at Habs Fanatics (Sun Jun 28, 2026)
-
Gleb Pugachyov : le CH voit un Tom Wilson en lui at Dans Les Coulisses (Sat Jun 27, 2026)
-
Tom Wilson Is the Heart & Soul of the Washington Capitals at The Hockey Writers (Tue Jun 16, 2026)
-
Tom Wilson: 2025-26 season review at Russian Machine Never Breaks (Sun Jun 14, 2026)
-
Aliaksei Protas details how Tom Wilson gives the Washington Capitals a psychological edge in games at Russian Machine Never Breaks (Thu Jun 11, 2026)
-
Tom Wilson, Aliaksei Protas, and Justin Sourdif receive Selke Trophy votes as Nick Suzuki wins award at Russian Machine Never Breaks (Fri Jun 5, 2026)
-
Tom Wilson to appear at grand opening of Dick’s House of Sport in Gaithersburg, MD at Russian Machine Never Breaks (Fri Jun 5, 2026)
-
Tom Wilson : Une meilleure solution que d’aller chercher un deuxième centre at Dans Les Coulisses (Thu Jun 4, 2026)
-
Tom Wilson is getting an unexpected raise thanks to his contract structure and an NHL CBA quirk at Russian Machine Never Breaks (Thu May 14, 2026)
-
Tom Wilson is getting an unexpected raise thanks to his contract structure and an NHL CBA quirk at Russian Machine Never Breaks (Thu May 14, 2026)
-
Témoignage surprise de Tom Wilson à l'endroit de Josh Anderson at HABSolument Fan (Thu Apr 30, 2026)
-
L’éloge inattendu de Tom Wilson envers Josh Anderson at Dans Les Coulisses (Thu Apr 30, 2026)
-
TJ Oshie on what NHL teams should do if they’re getting blown out in a playoff game: ‘You want to get a little reckless, get a little Tom Wilson on your squad’ at Russian Machine Never Breaks (Mon Apr 27, 2026)
-
Coup contre Juraj Slafkovsky : ça rappelle la situation Alexandre Carrier c. Tom Wilson at Dans Les Coulisses (Mon Apr 27, 2026)
-
Tom Wilson says Aliaksei Protas is basically Alex Ovechkin’s personal chauffeur: ‘He’s always driving Ovi wherever he wants to go’ at Russian Machine Never Breaks (Sun Apr 26, 2026)
-
Despite missing the playoffs, Tom Wilson thinks the Capitals are close to being a contending team: ‘We’re probably one piece away from making some serious noise’ at Russian Machine Never Breaks (Sat Apr 18, 2026)
-
3 Stars for the Washington Capitals’ 2025-26 Season at The Hockey Writers (Thu Apr 16, 2026)
-
TJ Oshie and Tom Wilson team up to shoot Stanley Cup promotional commercial for Great Clips at Russian Machine Never Breaks (Wed Apr 15, 2026)
-
Tom Wilson goes viral on social media after being caught on hot mic challenging Penguins’ Elmer Soderblom to fight at Russian Machine Never Breaks (Mon Apr 13, 2026)
-
Tom Wilson records rare franchise feat with back-to-back 30-goal seasons: ‘He’s been a driver for us all year’ at Russian Machine Never Breaks (Sat Apr 11, 2026)
-
Alex Ovechkin appreciates standing ovation during possible final game in Pittsburgh at Yahoo Sports NHL (Sat Apr 11, 2026)
-
Tom Wilson says huge hit on Jack McBain was not payback for breaking Alex Ovechkin’s leg at Russian Machine Never Breaks (Fri Apr 10, 2026)
-
Alex Ovechkin on the Capitals’ 700-pound line of Aliaksei Protas, Ilya Protas, and Tom Wilson: ‘I think it’s going to be the heaviest line in the league. Good luck.’ at Russian Machine Never Breaks (Wed Apr 8, 2026)
-
Ilya Protas practices with the Capitals for the first time, skates on line with older brother Aliaksei Protas and Tom Wilson at Russian Machine Never Breaks (Tue Apr 7, 2026)
-
La distraction Caufield, aimer Félix Séguin, Zack « Tom Wilson » Bolduc et Laine attend at Dans Les Coulisses (Mon Apr 6, 2026)
-
Hot mic catches Connor Murphy name-dropping Tom Wilson in a chirp directed at Rasmus Andersson at Russian Machine Never Breaks (Sun Apr 5, 2026)
-
Flyers Late Effort Falls Short, Drop Crucial Matchup vs. Capitals on Tuesday at Philly Hockey Now (Tue Mar 31, 2026)
-
Tom Wilson honored by Capitals with tribute video for 900th career game, scores game-opening goal at Russian Machine Never Breaks (Tue Mar 31, 2026)
-
Tom Wilson becomes third-youngest player in Washington Capitals history to reach 900 games: ‘It’s been more than a dream come true’ at Russian Machine Never Breaks (Tue Mar 31, 2026)
-
Tom Wilson blew Jack McBain a kiss from the penalty box after leveling him with a huge hit earlier in the game at Russian Machine Never Breaks (Fri Mar 27, 2026)
-
3 Takeaways From Mammoth’s 6-4 Loss to Capitals at The Hockey Writers (Fri Mar 27, 2026)
-
Tom Wilson records career high 21 penalty minutes, helps spark Capitals to 7-4 victory after Brandon Tanev boards Matt Roy at Russian Machine Never Breaks (Fri Mar 27, 2026)
-
Mammoth more focused on Tom Wilson than winning a hockey game: Capitals beat Mammoth 7-4 at Russian Machine Never Breaks (Fri Mar 27, 2026)
-
'Changing of the guard': Cole Hutson poised to take big role in next wave for the Capitals at ESPN (Thu Mar 26, 2026)
-
Ryan Reaves appears to dislocate finger in fight with Garrett Wilson at Yahoo Sports NHL (Sat Mar 21, 2026)
-
Cole Hutson takes pie to the face from Tom Wilson after first NHL goal: ‘He almost dodged me!’ at Russian Machine Never Breaks (Thu Mar 19, 2026)
-
Hot mic catches Tom Wilson calling someone on the Philadelphia Flyers a ‘f***ing nerd’ at Russian Machine Never Breaks (Thu Mar 12, 2026)
-
Connor Carrick says accidental counter-hit on Tom Wilson during Capitals training camp helped him make NHL at age 19 at Russian Machine Never Breaks (Tue Mar 10, 2026)
-
If The Capitals Are Open For Business, Could The Canadiens Target Their Big Power Forward? at Yahoo Sports NHL (Fri Mar 6, 2026)
-
Tom Wilson and Logan Thompson honored during pregame ceremony held for Canadian Olympic medalists in Montreal at Russian Machine Never Breaks (Sun Mar 1, 2026)
-
Arber Xhekaj scratch sparks scrutiny as Canadiens prepare for Capitals and Tom Wilson at Habs Fanatics (Sat Feb 28, 2026)
-
Bruce Cassidy on coaching Tom Wilson at the Olympics with Team Canada: ‘I can see why he’s had success in an upward trend’ at Russian Machine Never Breaks (Fri Feb 27, 2026)
-
Tom Wilson reflects on Olympic experience, gold medal loss: ‘I’ll always think very fondly of the time, but it’ll always hurt’ at Russian Machine Never Breaks (Fri Feb 27, 2026)
-
Jon Cooper gifted Tom Wilson a Team Canada-signed Italian hat after he notched a Gordie Howe Hat Trick in the Olympics at Russian Machine Never Breaks (Thu Feb 26, 2026)
-
Tom Wilson will play first post-Olympics game for Capitals against Golden Knights at Russian Machine Never Breaks (Thu Feb 26, 2026)
-
Tom Wilson misses Capitals game against Flyers due to illness at Russian Machine Never Breaks (Wed Feb 25, 2026)
-
Logan Thompson to make start for Capitals in first game back from Olympics, Tom Wilson will be game-time decision due to illness at Russian Machine Never Breaks (Wed Feb 25, 2026)
-
Why Capitals players, especially Tom Wilson, began beating up Dylan Strome in a goal hug at Russian Machine Never Breaks (Wed Feb 25, 2026)
-
Reviewing Capitals Performances at the 2026 Winter Olympics at The Hockey Writers (Tue Feb 24, 2026)
-
Tom Wilson, Logan Thompson return to America with Team Canada after winning silver at Olympics, land in Miami at Russian Machine Never Breaks (Mon Feb 23, 2026)
-
Dylan Larkin on Tom Wilson’s thunderous body check that sent him flying into boards during Gold Medal Game: ‘I haven’t got hit like that in a long time’ at Russian Machine Never Breaks (Mon Feb 23, 2026)
-
Tom Wilson sets Team Canada record for most penalty minutes in a single Olympic tournament (with NHL involvement) at Russian Machine Never Breaks (Mon Feb 23, 2026)
-
Tom Wilson and Logan Thompson collect silver medals for Canada after losing Olympic final to Team USA at Russian Machine Never Breaks (Sun Feb 22, 2026)
-
Tom Wilson démoli Dylan Larkin, mais les États-Unis sont en avance at HABSolument Fan (Sun Feb 22, 2026)
-
Tom Wilson sends clear warning ahead of Canada-United States gold medal game at Habs Fanatics (Sat Feb 21, 2026)
-
Tom Wilson and Logan Thompson could win Olympic gold for Canada. Who are the Capitals’ American players cheering for? at Russian Machine Never Breaks (Sat Feb 21, 2026)
-
Tom Wilson on being put on the ‘Fine Line’ with Brad Marchand and Sam Bennett: ‘I think it’s clear what our job is — to create chaos’ at Russian Machine Never Breaks (Sat Feb 21, 2026)
-
Tom Wilson records assist on game-tying goal as Canada advances to Olympic Gold Medal Game at Russian Machine Never Breaks (Fri Feb 20, 2026)
-
Capitals teammates watch with pride as Tom Wilson wows hockey world with Olympic success: ‘He’s been incredible’ at Russian Machine Never Breaks (Fri Feb 20, 2026)
-
Hot mic catches Radko Gudas’ podium-worthy chirp at Tom Wilson after Olympic fight with Frenchman at Russian Machine Never Breaks (Wed Feb 18, 2026)
-
Tom Wilson est devenu le joueur le plus puni de l'histoire du Canada aux Olympiques at HABSolument Fan (Wed Feb 18, 2026)
-
Pierre Crinon now facing criminal charges in France for prior incident involving goaltender as fight with Tom Wilson revives prosecutorial complaint at Russian Machine Never Breaks (Tue Feb 17, 2026)
-
Jon Cooper leaned on Spencer Carbery when deciding Tom Wilson’s role for Team Canada at Russian Machine Never Breaks (Tue Feb 17, 2026)
-
Tom Wilson says ‘playing with Connor (McDavid) has been a highlight of my career’ at Russian Machine Never Breaks (Tue Feb 17, 2026)
-
Logan Thompson says ‘that’s my bestie’ after Tom Wilson records Gordie Howe Hat Trick for Team Canada at Russian Machine Never Breaks (Tue Feb 17, 2026)
-
Tom Wilson knew there was a line he couldn’t cross in Olympic fight if he wanted to avoid suspension: ‘I just wanted to make sure not to take it too far’ at Russian Machine Never Breaks (Tue Feb 17, 2026)
-
French hockey player who fought Wilson banned at ESPN (Mon Feb 16, 2026)
-
France's Hockey Federation Suspends Pierre Crinon, Who Fought Canada's Tom Wilson, For Rest Of Olympics at The Hockey News (Mon Feb 16, 2026)
-
France bans Pierre Cronin, the player who fought Tom Wilson, for rest of Olympics at Russian Machine Never Breaks (Mon Feb 16, 2026)
-
Five Team Canada players who made a big impact in the Olympic preliminary round at Oilers Nation (Mon Feb 16, 2026)
-
Kevin Fiala will miss the rest of NHL regular season due to collision with Tom Wilson: ‘Not the ending I imagined for my first Olympics’ at Russian Machine Never Breaks (Mon Feb 16, 2026)
-
Decision made on Tom Wilson's availability for Canada's quarterfinal game after being ejected on Sunday at Canucks Daily (Mon Feb 16, 2026)
-
Capitals' Tom Wilson records rare Olympic feat in Canada's blowout of France at Stars and Sticks (Mon Feb 16, 2026)
-
Pierre Crinon summoned by French Federation after incidents involving Nathan MacKinnon and Tom Wilson at Habs Fanatics (Sun Feb 15, 2026)
-
Olympic Hockey Day 5 Recap: OT Magic and Ten Goal Mayhem at Blue Shirt Banter (Sun Feb 15, 2026)
-
Nathan MacKinnon, Team Canada appreciative of Tom Wilson fighting France’s Pierre Crinon after head hit: ‘I definitely appreciate him sticking up for me’ at Russian Machine Never Breaks (Sun Feb 15, 2026)
-
‘Wilson forgot it was the Olympics’: Fans react to fight between Canada’s Tom Wilson, France’s Pierre Crinon at Oilers Nation (Sun Feb 15, 2026)
-
Wilson drops gloves in rare Olympic hockey fight at ESPN (Sun Feb 15, 2026)
-
Canada Olympic Hockey Recap: Celebrini scores on penalty shot, three total points in massive 10-2 win over France at Canucks Army (Sun Feb 15, 2026)
-
Analyst suggests who gave Tom Wilson the green light to drop the gloves at Habs Fanatics (Sun Feb 15, 2026)
-
Jon Cooper on Tom Wilson’s scrap against France: “Pretty harmless, in the grand scheme of things, of what we’re used to” at Maple Leafs Hot Stove (Sun Feb 15, 2026)
-
Suspension possible : la décision est tombée concernant Tom Wilson at HABSolument Fan (Sun Feb 15, 2026)
-
Tom Wilson earns Olympic Gordie Howe hat trick, ejected from Team Canada’s blowout win over France for fighting at Russian Machine Never Breaks (Sun Feb 15, 2026)
-
Canada's Tom Wilson Gets A Game Misconduct For Fighting Against France at The Hockey News (Sun Feb 15, 2026)
-
Tom Wilson risque une suspension après avoir jeté les gants contre la France at HABSolument Fan (Sun Feb 15, 2026)
-
Team Canada gets major relief as Tom Wilson avoids suspension after fight with Pierre Crinon at Habs Fanatics (Sun Feb 15, 2026)
-
Team Canada gets major relief as Tom Wilson avoids suspension after fight with Pierre Crinon at Habs Fanatics (Sun Feb 15, 2026)
-
Tom Wilson faces possible suspension after defending Nathan MacKinnon at Olympics at Habs Fanatics (Sun Feb 15, 2026)
-
Tom Wilson records milestone first Olympic goal for Team Canada in first period against France at Russian Machine Never Breaks (Sun Feb 15, 2026)
-
Tom Wilson appears to lose spot on Team Canada’s top line with Connor McDavid and Macklin Celebrini at Russian Machine Never Breaks (Sat Feb 14, 2026)
-
Tom Wilson cleared by Olympic officials after hit that ends Kevin Fiala’s tournament and season at Habs Fanatics (Sat Feb 14, 2026)
-
Kevin Fiala hospitalized, will miss rest of Olympics after collision with Tom Wilson: ‘You never want to see a guy go down in a tournament like this’ at Russian Machine Never Breaks (Sat Feb 14, 2026)
-
Game Review: Team Canada takes care of business against the Swiss, clinches top spot in Group A at Maple Leafs Hot Stove (Fri Feb 13, 2026)
-
Tom Wilson records milestone first Olympic point for Team Canada on Thomas Harley goal at Russian Machine Never Breaks (Fri Feb 13, 2026)
-
Team Canada vs. Team Switzerland – Projected Lines, Preview & TV Info at Maple Leafs Hot Stove (Fri Feb 13, 2026)
-
Connor McDavid calls Tom Wilson a ‘forechecking god’ at Russian Machine Never Breaks (Fri Feb 13, 2026)
-
Who should Canada have chosen for the 2026 Olympics, Zach Hyman or Tom Wilson? at Oil on Whyte (Fri Feb 13, 2026)
-
Connor McDavid threw a hit so big in Team Canada’s win that Brad Marchand thought it was Tom Wilson: ‘No, that was Davo’ at Russian Machine Never Breaks (Thu Feb 12, 2026)
-
Tom Wilson throws several big hits in Team Canada’s spotless Olympic-opening 5-0 shutout win against Czechia at Russian Machine Never Breaks (Thu Feb 12, 2026)
-
2026 Milan Olympics Team Canada Preview at Blue Shirt Banter (Thu Feb 12, 2026)
-
Tom Wilson tries to include Alex Ovechkin when building the ultimate Team Canada player at Russian Machine Never Breaks (Wed Feb 11, 2026)
-
If you want a Tom Wilson or Logan Thompson Team Canada jersey, you better get on it quick at Russian Machine Never Breaks (Tue Feb 10, 2026)
-
Capitals’ Tom Wilson and Logan Thompson take in Olympic speed-skating event with Team Canada at Russian Machine Never Breaks (Tue Feb 10, 2026)
-
Tom Wilson, Canadian Olympic team surprise onlookers by riding Milan metro after speed-skating event: ‘I wasn’t expecting this experience at all’ at Russian Machine Never Breaks (Tue Feb 10, 2026)
-
Tom Wilson on being on a line with ‘two of the best players in the world’ in Connor McDavid and Macklin Celebrini: ‘It’s going to be exciting’ at Russian Machine Never Breaks (Mon Feb 9, 2026)
-
Tom Wilson to room with former Capitals goaltender Darcy Kuemper at the Olympics at Russian Machine Never Breaks (Sun Feb 8, 2026)
-
Capitals Week Ahead: Schedule & Storylines – Olympic Break Edition at The Hockey Writers (Sun Feb 8, 2026)
-
Tom Wilson skates on a line with Connor McDavid and Macklin Celebrini during Team Canada’s first Olympic practice at Russian Machine Never Breaks (Sun Feb 8, 2026)
-
Oilers’ McDavid skates on top line with Celebrini, Wilson at first Team Canada skate at Oilers Nation (Sun Feb 8, 2026)
-
Sidney Crosby picks Tom Wilson to lead Team Canada in penalty minutes at the 2026 Winter Olympics at Russian Machine Never Breaks (Sun Feb 8, 2026)
-
Live updates: Washington Capitals vs Nashville Predators at Capital One Arena at Russian Machine Never Breaks (Thu Feb 5, 2026)
-
Live updates: Washington Capitals vs New York Islanders at Capital One Arena at Russian Machine Never Breaks (Mon Feb 2, 2026)
-
Tom Wilson apparently sad not to be included on Logan Thompson’s Team Canada mask at Russian Machine Never Breaks (Mon Feb 2, 2026)
-
Getting To Know The Real Tom Wilson: Capitals Star Reflects On Evolution & Winding Road To Olympics at The Hockey News (Fri Jan 30, 2026)
-
Capitals send Brett Leason back to AHL’s Hershey Bears ahead of Tom Wilson’s likely return from injury at Russian Machine Never Breaks (Sun Jan 18, 2026)
-
Ivan Miroshnichenko and Brett Leason appear set to dress against Panthers as Tom Wilson takes scratches skate at Russian Machine Never Breaks (Sat Jan 17, 2026)
-
Jakob Chychrun to make return against Sharks, but Capitals will remain without Tom Wilson and Justin Sourdif at Russian Machine Never Breaks (Thu Jan 15, 2026)
-
Tom Wilson cleared for contact at Capitals practice, could play tomorrow against Sharks at Russian Machine Never Breaks (Wed Jan 14, 2026)
-
Tom Wilson to miss fifth-straight game due to injury, but is ‘getting close’ to returning at Russian Machine Never Breaks (Tue Jan 13, 2026)
-
Tom Wilson likely to remain out of Capitals lineup for fourth straight game against Predators, Charlie Lindgren to start in net at Russian Machine Never Breaks (Sun Jan 11, 2026)
-
Connor Bedard 'ready to roll' for Capitals at Blackhawk Up (Fri Jan 9, 2026)
-
Spencer Carbery says there’s a chance that Tom Wilson and Aliaksei Protas both play on upcoming road trip at Russian Machine Never Breaks (Thu Jan 8, 2026)
-
Tom Wilson to miss second straight game with lower-body injury, will travel with Capitals on upcoming road trip at Russian Machine Never Breaks (Wed Jan 7, 2026)
-
Capitals’ injured forwards skate on off day at Russian Machine Never Breaks (Wed Jan 7, 2026)
-
Tom Wilson dumps Powerade on Justin Sourdif’s head after rookie’s first carerer hat trick at Russian Machine Never Breaks (Tue Jan 6, 2026)
-
Tom Wilson will miss Capitals’ game against Ducks, but team believes they have dodged worst-case injury scenario at Russian Machine Never Breaks (Mon Jan 5, 2026)
-
Capitals provide injury updates on Tom Wilson and Aliaksei Protas after they miss practice at Russian Machine Never Breaks (Sun Jan 4, 2026)
-
Spencer Carbery doesn’t believe Tom Wilson’s lower-body injury is ‘too bad,’ but Capitals will ‘know more tomorrow’ at Russian Machine Never Breaks (Sun Jan 4, 2026)
-
Blackhawks beat Caps 3-2 (SO), plus Tom Wilson’s hurt, so that double-sucked at Russian Machine Never Breaks (Sat Jan 3, 2026)
-
Tom Wilson leaves Capitals game against Blackhawks in first period with lower-body injury at Russian Machine Never Breaks (Sat Jan 3, 2026)
-
Blackhawks vs. Capitals: Heading Into D.C., Preview, Lineups, & How To Watch at Chicago Hockey Now (Sat Jan 3, 2026)
-
Alex Ovechkin stuns Capitals teammates with revelation that he still goes out for haircuts—and pays like everyone else at Russian Machine Never Breaks (Fri Jan 2, 2026)
-
Capitals vs Rangers: How the Game Was Won at Japers Rink (Thu Jan 1, 2026)
-
Top-5 : Tom Wilson justifie sa place avec Équipe Canada at Dans Les Coulisses (Thu Jan 1, 2026)
-
Tom Wilson mocks Vladislav Gavrikov after Rangers defenseman tries to get tough with him at Russian Machine Never Breaks (Wed Dec 31, 2025)
-
‘Best buds’ Tom Wilson and Logan Thompson honored to make Canadian Olympic team: ‘It’s going to be special memories for our whole life.’ at Russian Machine Never Breaks (Wed Dec 31, 2025)
-
Wilson propels Caps with Gordie Howe hat trick at ESPN (Wed Dec 31, 2025)
-
Tom Wilson records Gordie Howe hat trick on same day he was named to Team Canada’s Olympic team: ‘You can’t get much better than that’ at Russian Machine Never Breaks (Wed Dec 31, 2025)
-
Adam Fox returns and scores, but Rangers lose 6-3 to Capitals: Takeaways at Forever Blueshirts (Wed Dec 31, 2025)
-
Grading Canada's 2026 Olympic roster, plus snubs and surprises at ESPN (Wed Dec 31, 2025)
-
Recap: Tom Wilson Sets the Tone, Scores Twice as Rangers Fall 6-3 to Capitals at Blue Shirt Banter (Wed Dec 31, 2025)
-
Capitals vs Rangers Recap: Where There’s a Wilson, There’s a Win at Japers Rink (Wed Dec 31, 2025)
Current Contract
Tom Wilson signed a $48,500,000 7-year contract with the Washington Capitals and General Manager Brian MacLellan on August 4, 2023 with an AAV of $6,500,000. This contract will start in 2024-25 and end after the 2030-31 season. In the first season of the contract the cap hit was equivalent to 7.39% of the salary cap.
Standard Contract (UFA) ( ) (0 ratings)
Tom Wilson signed a $31,000,000 6-year contract with the Washington Capitals and General Manager Brian MacLellan on July 27, 2018 with an AAV of $5,166,667. This contract will start in 2018-19 and end after the 2023-24 season. In the first season of the contract the cap hit was equivalent to 6.50% of the salary cap.
Standard Contract (RFA) ( ) (0 ratings)
| Season | Age* | Clause | Cap Hit | AAV | Perf. Bonus | Sign. Bonus | Salary | Compensation | Minors Salary | Status | |
|---|---|---|---|---|---|---|---|---|---|---|---|
| 2018-19 | 24 | $5,166,667 | $5,166,667 | - | $5,000,000 | $1,100,000 | $6,100,000 | $6,100,000 | RFA-arb | ||
| 2019-20 | 25 | $5,166,667 | $5,166,667 | - | $3,000,000 | $1,500,000 | $4,500,000 | $4,500,000 | RFA-arb | ||
| 2020-21 | 26 | M-NTC | $5,166,667 | $5,166,667 | - | $2,000,000 | $2,100,000 | $4,100,000 | $4,100,000 | UFA | |
| 2021-22 | 27 | M-NTC | $5,166,667 | $5,166,667 | - | $3,000,000 | $3,100,000 | $6,100,000 | $6,100,000 | UFA | |
| 2022-23 | 28 | M-NTC | $5,166,667 | $5,166,667 | - | $2,000,000 | $2,100,000 | $4,100,000 | $4,100,000 | UFA | |
| 2023-24 | 29 | M-NTC | $5,166,667 | $5,166,667 | - | $1,000,000 | $5,100,000 | $6,100,000 | $6,100,000 | UFA | |
| Total | - | $16,000,000 | $15,000,000 | $31,000,000 | $31,000,000 |
Tom Wilson signed a $4,000,000 2-year contract with the Washington Capitals and General Manager Brian MacLellan on June 30, 2016 with an AAV of $2,000,000. This contract will start in 2016-17 and end after the 2017-18 season. In the first season of the contract the cap hit was equivalent to 2.74% of the salary cap.
Standard Contract (RFA) ( ) (0 ratings)
| Season | Age* | Clause | Cap Hit | AAV | Perf. Bonus | Sign. Bonus | Salary | Compensation | Minors Salary | Status | |
|---|---|---|---|---|---|---|---|---|---|---|---|
| 2016-17 | 22 | $2,000,000 | $2,000,000 | - | - | $1,750,000 | $1,750,000 | $1,750,000 | RFA | ||
| 2017-18 | 23 | $2,000,000 | $2,000,000 | - | - | $2,250,000 | $2,250,000 | $2,250,000 | RFA-arb | ||
| Total | - | - | $4,000,000 | $4,000,000 | $4,000,000 |
Tom Wilson signed a $2,775,000 3-year contract with the Washington Capitals and General Manager George McPhee on July 19, 2012 with an AAV of $925,000. This contract will start in 2012-13 and end after the 2015-16 season. In the first season of the contract the cap hit was equivalent to 1.54% of the salary cap.
Entry Level Contract ( ) (0 ratings)
| Season | Age* | Clause | Cap Hit | AAV | Perf. Bonus | Sign. Bonus | Salary | Compensation | Minors Salary | Status | |
|---|---|---|---|---|---|---|---|---|---|---|---|
| 2012-13 | 18 | $925,000 | $1,325,000 | - | $92,500 | - | $92,500 | - | ELC | ||
| 2013-14 | 19 | $894,167 | $1,294,167 | $200,000 | $92,500 | $832,500 | $925,000 | $70,000 | ELC | ||
| 2014-15 | 20 | $894,167 | $1,294,167 | $400,000 | $92,500 | $832,500 | $925,000 | $70,000 | ELC | ||
| 2015-16 | 21 | $894,167 | $1,294,167 | $600,000 | - | $832,500 | $832,500 | $70,000 | ELC | ||
| Total | $1,200,000 | $277,500 | $2,497,500 | $2,775,000 | $210,000 |
Career Statistics
| Regular Season | Playoffs | |||||||||||||||||||
|---|---|---|---|---|---|---|---|---|---|---|---|---|---|---|---|---|---|---|---|---|
| Season | League | Team | GP | G | A | Pts | +/- | PIM | Shots | Sh% | TOI/G | GP | G | A | Pts | +/- | PIM | Shots | Sh% | TOI/G |
| 2009-10 | GTHL | Tor. Jr. Canadiens | 73 | 44 | 61 | 105 | 140 | |||||||||||||
| 2010-11 | OHL | Plymouth | 28 | 3 | 3 | 6 | 71 | |||||||||||||
| 2011-12 | OHL | Plymouth | 49 | 9 | 18 | 27 | +17 | 141 | 13 | 7 | 6 | 13 | +10 | 39 | ||||||
| 2012-13 | OHL | Plymouth | 48 | 23 | 35 | 58 | +36 | 104 | 12 | 9 | 8 | 17 | +8 | 41 | ||||||
| 2012-13 | NHL | Washington Capitals | 3 | -1 | 4 | 0.0 | 6:53 | |||||||||||||
| 2012-13 | AHL | Hershey | 3 | 1 | 1 | +1 | 6 | 6 | 1,667.0 | |||||||||||
| 2013-14 | NHL | Washington Capitals | 82 | 3 | 7 | 10 | +1 | 151 | 63 | 4.8 | 7:56 | |||||||||
| 2014-15 | AHL | Hershey | 2 | 0 | 0 | 0 | 5 | 0.0 | ||||||||||||
| 2014-15 | NHL | Washington Capitals | 67 | 4 | 13 | 17 | -1 | 172 | 79 | 5.1 | 10:56 | 13 | 1 | 1 | -2 | 25 | 7 | 0.0 | 7:44 | |
| 2015-16 | NHL | Washington Capitals | 82 | 7 | 16 | 23 | +3 | 163 | 99 | 7.1 | 12:55 | 12 | 1 | 1 | -3 | 13 | 8 | 0.0 | 12:01 | |
| 2016-17 | NHL | Washington Capitals | 82 | 7 | 12 | 19 | +9 | 133 | 95 | 7.4 | 12:56 | 13 | 3 | 3 | -2 | 34 | 19 | 15.8 | 13:52 | |
| 2017-18 | NHL | Washington Capitals | 78 | 14 | 21 | 35 | +10 | 187 | 123 | 11.4 | 15:59 | 21 | 5 | 10 | 15 | +11 | 31 | 34 | 14.7 | 17:45 |
| 2018-19 | NHL | Washington Capitals | 63 | 22 | 18 | 40 | +11 | 128 | 130 | 16.9 | 18:09 | 7 | 3 | 2 | 5 | +1 | 2 | 11 | 27.3 | 21:02 |
| 2019-20 | NHL | Washington Capitals | 68 | 21 | 23 | 44 | -3 | 93 | 154 | 13.6 | 18:16 | 8 | 1 | 2 | 3 | -5 | 23 | 13 | 7.7 | 18:30 |
| 2020-21 | NHL | Washington Capitals | 47 | 13 | 20 | 33 | +1 | 96 | 83 | 15.7 | 16:32 | 5 | 1 | 1 | 2 | -3 | 6 | 10 | 10.0 | 19:07 |
| 2021-22 | NHL | Washington Capitals | 78 | 24 | 28 | 52 | +13 | 98 | 151 | 15.9 | 18:35 | 1 | 1 | 1 | 2 | 50.0 | 1:31 | |||
| 2022-23 | NHL | Washington Capitals | 33 | 13 | 9 | 22 | -13 | 78 | 82 | 15.9 | 17:37 | |||||||||
| 2023-24 | NHL | Washington Capitals | 74 | 18 | 17 | 35 | -19 | 133 | 169 | 10.7 | 18:06 | 4 | 1 | 2 | 3 | +1 | 16 | 10 | 10.0 | 19:02 |
| 2024-25 | NHL | Washington Capitals | 81 | 33 | 32 | 65 | +20 | 100 | 169 | 19.5 | 18:44 | 10 | 3 | 4 | 7 | +3 | 14 | 19 | 15.8 | 20:01 |
| 2025-26 | NHL | Washington Capitals | 72 | 30 | 32 | 62 | +15 | 117 | 153 | 19.6 | 19:28 | |||||||||
| 2025-26 | OG | Canada | 6 | 1 | 3 | 4 | +5 | 29 | 5 | 20.0 | 11:57 | |||||||||
| NHL Career | 907 | 209 | 248 | 457 | +47 | 1649 | 1550 | 13.5 | 15:39 | 97 | 18 | 23 | 41 | 164 | 137 | 13.1 | 15:20 | |||