
 Taylor Raddysh
| Position | Right Wing | Current Team | New York Rangers |
| Shoots | Right | Current Contract | 2 years ($1.5M CapHit) |
| Height | 6'2" | Expires | 2026-27 |
| Weight (lbs) | 201 | Expiry Age (Jun 30) | 29 |
| Age (DOB) | 28 (Feb 18, 1998) | Expiry Status | UFA |
| Drafted | 2016, Round 2, Overall 58 (TBL) |
| Date | Team | Transaction | |
|---|---|---|---|
| Jul 1, 2025 | New York Rangers | Signed 2 years @ $1.500M AAV starting in 2025-26 | |
| Jul 1, 2024 | Washington Capitals | Signed 1 year @ $1.000M AAV starting in 2024-25 | |
| Jul 30, 2021 | Tampa Bay Lightning | Signed 3 years @ $758K AAV starting in 2021-22 | |
| May 15, 2017 | Tampa Bay Lightning | Signed to an entry level contract. |
Player Card(s)
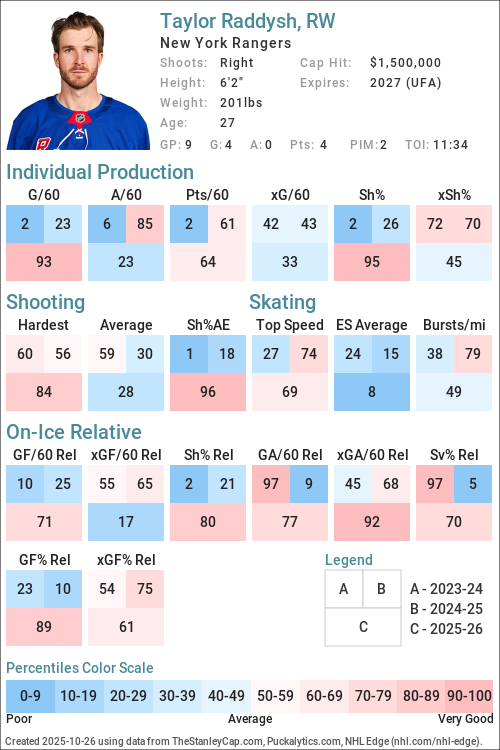
URL: https://thestanleycap.com/cdn/player_cards/20252026/taylor-raddysh-8479390.png
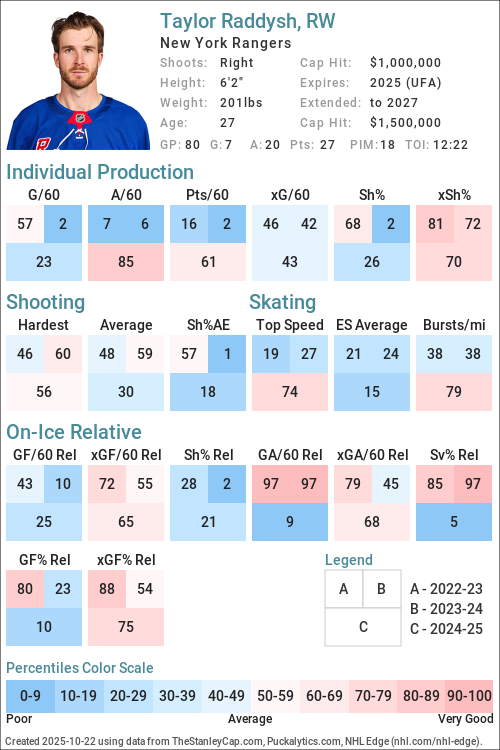
URL: https://thestanleycap.com/cdn/player_cards/20242025/taylor-raddysh-8479390.png
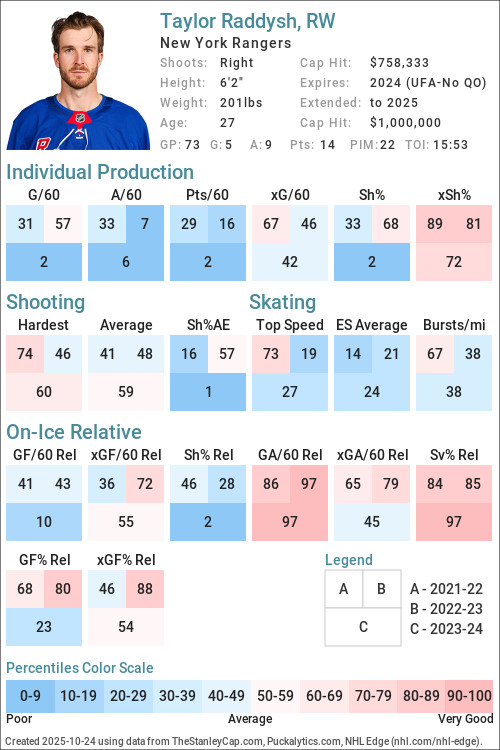
URL: https://thestanleycap.com/cdn/player_cards/20232024/taylor-raddysh-8479390.png
About Player Cards
Player cards present an infographic of a players performance using a series of Player Archetypes developed for Puckalytics.com and TheStanleyCap.com. The boxes in the rink image show the archetype ratings for the season specified in the card while the graphs to the right show the five-year trends for those archetypes.
Except for Faceoffs, the values shown are the players z-score (standard deviation from the mean) for the specific metric used to calculate the archetype values. When calculating z-scores forwards were compared to forwards and defensemen were compared to defensemen. Positive values indicate the player is above average and shaded in blue, while negative values indicate the player is below average and shaded in pink. The five year trend charts show a range of -4.0 to 4.0.
The value shown for Faceoffs is the faceoff winning percentage rather than their z-score with winning percentages below 50 in pink shades and above 50 in blue shades.
All archetypes are 5v5 except 5v4 TOI, 4v5 TOI, Skating (even strength) and Faceoffs (all situations). Archetypes use regular season data only.
Archetypes Summary
- Sniper - Measures the to score above the expected goal rate.
- Rebound - Measures the percent of a players shot attempts that come from rebounds (forwards only).
- 5v4 TOI - Powerplay ice time, calculated as the percentage of his teams 5v4 ice time that the player was on the ice for.
- Shooter - Measures whether a players points come from shots (goals or assists on rebounds from his shots).
- Producer - Measures a players ability to produce goals and assists, adjusted for quality of teammates.
- Playmaker - Measures whether a players points come from passes.
- Drive - Measures a players ability to drive puck possession and generate shot attempts for his team.
- Rush - Measures the percent of a players shot attempts that come from rush plays
- Possession - An indicator of a players ability to improve his teams puck possession game.
- Faceoffs - Faceoff Winning Percentage (min. 75 faceoffs taken).
- 5v5 TOI - The percentage of his teams 5v5 TOI that the player was on the ice for.
- Suppress - Measures a players ability to suppress opponent puck possession and shot attempts against.
- Skating - An indicator of a players skating ability, or speed bursts above 20mph per mile skated.
- Defend - An indicator of a players ability to suppress shot quality against.
- 4v5 TOI - Penalty Kill ice time, calculated as the percentage of his teams 4v5 ice time that the player was on the ice for.
Data Sources
- Salary data is from TheStanleyCap.com
- Skating data is from NHL Edge
- Other statistics are from Puckalytics.com and derived from data from NHL.com
Terms of Use
You are free to use include player cards in written articles, share on social media, or on other public websites under the following conditions:
- You credit TheStanleyCap.com as the source and provide a link back to TheStanleyCap.com or this player page.
- You do not mass copy/duplicate/publish dozens or hundreds of player cards. A few, or a handful for a written article is fine. Be reasonable. Fair use rules apply.
- If you are a high-traffic website you must download and host the image(s) on your site rather than overload TheStanleyCap servers with traffic.
Note: Player cards will update daily throughout the season so if you want to include snapshot then you must download the image.
If you have any questions, send an e-mail to the e-mail address at the top of this page.
Read Introducing Player Archetypes on HockeyAnalysis.com for more details on archetype calculations.
Core Archetypes
| Season | Team(s) | GP | TOI | Producer | Playmaker | Shooter | Sniper | Rebound | Rush | Skating | Defend |
|---|---|---|---|---|---|---|---|---|---|---|---|
| 2021-22 | CHI, TBL | 74 | -0.90 | -0.74 | -0.68 | -1.04 | 1.01 | -0.25 | 0.26 | 1.04 | |
| 2022-23 | CHI | 78 | -0.77 | -1.14 | 0.21 | 0.35 | 0.40 | 2.38 | -0.49 | 1.12 | |
| 2023-24 | CHI | 73 | -1.54 | -1.27 | -1.02 | -1.84 | 0.49 | -0.71 | -0.46 | 1.95 | |
| 2024-25 | WSH | 80 | 0.22 | 1.48 | -0.96 | -1.11 | 1.45 | -1.05 | 0.73 | -1.51 | |
| 2025-26 | NYR | 68 | -0.22 | -0.29 | -0.14 | 1.26 | 0.42 | -0.82 | 0.22 | 2.11 |
Situational and Secondary Archetypes
| Season | Team(s) | GP | TOI | 5v5 TOI | 5v4 TOI | 4v5 TOI | Possession | Drive | Suppress | Faceoffs |
|---|---|---|---|---|---|---|---|---|---|---|
| 2021-22 | CHI, TBL | 74 | -1.21 | -0.75 | -1.23 | -0.74 | -0.45 | -0.70 | - | |
| 2022-23 | CHI | 78 | 0.31 | 0.99 | -1.94 | 1.06 | 0.46 | 1.10 | - | |
| 2023-24 | CHI | 73 | -0.18 | -0.12 | 0.47 | 0.10 | 0.37 | -0.58 | - | |
| 2024-25 | WSH | 80 | -0.44 | -1.39 | -2.11 | -0.23 | -0.10 | -0.27 | - | |
| 2025-26 | NYR | 68 | -1.06 | -1.45 | -0.88 | -0.92 | -0.80 | -0.27 | - |
5v5 Individual Stats
| Season | Team(s) | GP | TOI | G/60 | A/60 | Pts/60 | xG/60 | GAE/60 | Sh% | xSh% | Sh%AE | %SA Rush | %SA Reb. |
|---|---|---|---|---|---|---|---|---|---|---|---|---|---|
| 2021-22 | CHI | 21 | 245:53 | 0.73 | 0.98 | 1.71 | 0.80 | -0.07 | 10.34 | 11.29 | -0.94 | 5.71 | 17.14 |
| 2021-22 | TBL | 53 | 511:31 | 0.47 | 0.70 | 1.17 | 0.81 | -0.34 | 7.27 | 12.62 | -5.35 | 2.56 | 5.13 |
| 2021-22 | CHI, TBL | 74 | 757:24 | 0.55 | 0.79 | 1.35 | 0.81 | -0.25 | 8.33 | 12.16 | -3.83 | 3.54 | 8.85 |
| 2022-23 | CHI | 78 | 1006:59 | 0.72 | 0.48 | 1.19 | 0.67 | 0.04 | 12.24 | 11.53 | 0.71 | 8.51 | 8.51 |
| 2023-24 | CHI | 73 | 872:29 | 0.21 | 0.41 | 0.62 | 0.61 | -0.41 | 3.49 | 10.37 | -6.88 | 2.38 | 9.52 |
| 2024-25 | WSH | 80 | 928:06 | 0.45 | 1.23 | 1.68 | 0.69 | -0.23 | 8.24 | 12.50 | -4.27 | 0.82 | 11.48 |
| 2025-26 | NYR | 68 | 710:43 | 0.68 | 0.76 | 1.44 | 0.51 | 0.17 | 18.18 | 13.65 | 4.53 | 1.35 | 9.46 |
5v5 On Ice Stats
| Season | Team(s) | GP | TOI | SAF/60 | GF/60 | xGF/60 | SAA/60 | GA/60 | xGA/60 | GF% | xGF% | xGF Rel | xGA Rel | xGF% Rel |
|---|---|---|---|---|---|---|---|---|---|---|---|---|---|---|
| 2021-22 | CHI | 21 | 245:53 | 35.87 | 2.68 | 2.39 | 55.64 | 2.44 | 3.01 | 52.38 | 44.19 | 0.01 | 0.27 | -2.20 |
| 2021-22 | TBL | 53 | 511:31 | 38.83 | 2.70 | 2.44 | 38.12 | 1.88 | 2.23 | 58.97 | 52.22 | -0.29 | -0.23 | -0.37 |
| 2021-22 | CHI, TBL | 74 | 757:24 | 37.87 | 2.69 | 2.42 | 43.81 | 2.06 | 2.49 | 56.67 | 49.35 | -0.21 | -0.05 | -1.50 |
| 2022-23 | CHI | 78 | 1006:59 | 36.82 | 1.85 | 2.29 | 43.08 | 2.32 | 2.75 | 44.29 | 45.47 | 0.25 | -0.32 | 5.58 |
| 2023-24 | CHI | 73 | 872:29 | 37.20 | 1.03 | 2.07 | 47.45 | 2.27 | 2.77 | 31.25 | 42.78 | 0.02 | -0.08 | 0.97 |
| 2024-25 | WSH | 80 | 928:06 | 41.12 | 2.46 | 2.67 | 39.89 | 2.91 | 2.26 | 45.78 | 54.16 | 0.13 | -0.24 | 3.78 |
| 2025-26 | NYR | 68 | 710:43 | 34.87 | 2.11 | 1.98 | 41.70 | 1.60 | 2.41 | 56.82 | 45.08 | -0.45 | -0.15 | -3.60 |
NHL Edge Stats
| Skating | Shooting | Zone Time | |||||||||||
|---|---|---|---|---|---|---|---|---|---|---|---|---|---|
| Season | GP | Top Speed | Bursts>20/mi | Avg. Speed | Top Speed | Avg. Speed | %Long Range | %Mid Range | %High Danger | ES DZ% | ES NZ% | ES OZ% | |
| This table is for Basic and Premium subscribers only. To view please login to and/or subscribe to one of our subscription plans. | |||||||||||||
Legend
| Percentile 0-25 | Percentile 25-50 | Percentile 50-75 | Percentile 75-100 |
5v5 Lines
| Season | Teammate | Teammate | Team | TOI | GF/60 | GA/60 | GF% | xGF/60 | xGA/60 | xGF% | xGF Rel | xGA Rel | xGF% Rel |
|---|
Glossary
| Type | Statistic | Definition |
|---|---|---|
| Individual | G/60 | Goals Against per 60 minutes. |
| Individual | A/60 | Assists per 60 minutes. |
| Individual | Pts/60 | Points per 60 minutes. |
| Individual | xG/60 | Expected Goals per 60 minutes. |
| Individual | GAE/60 | Goals Above Expected (G/60 - xG/60). |
| Individual | Sh% | Shooting Percentage. |
| Individual | xSh% | Expected Shooting Percentage. |
| Individual | Sh%AE | Shooting percentage above expected (Sh% - xSh%). |
| Individual | %SA Rush | Percentage of shot attempts determined to be on the rush. |
| Individual | %SA Reb. | Percentage of shot attempts determined to be from rebounds. |
| On Ice | SAF/60 | Shot Attempts For per 60 minutes. |
| On Ice | GF/60 | Goals For per 60 minutes. |
| On Ice | xGF/60 | Expected Goals For per 60 minutes. |
| On Ice | SAA/60 | Shot Attempts Against per 60 minutes (lower is better). |
| On Ice | GA/60 | Goals Against per 60 minutes (lower is better). |
| On Ice | xGA/60 | Expected Goals Against per 60 minutes (lower is better). |
| On Ice | GF% | Goals For Percentage = Goals For / (Goals For + Goals Against) |
| On Ice | xGF% | Expected Goals For Percentage = Expected Goals For / (Expected Goals For + Expected Goals Against) |
| On Ice | xGF Rel | xGF/60 when On Ice - xGF/60 when not On Ice. |
| On Ice | xGA Rel | xGA/60 when On Ice - xGA/60 when not On Ice (lower is better). |
| On Ice | xGF% Rel | xGF% when On Ice - xGF% when not On Ice. |
News and Opinions
-
Taylor Raddysh emerging as obvious odd man out on crowded Rangers roster at Blue Line Station (Tue Jul 28, 2026)
-
New York Rangers’ 2025-26 Report Cards: Taylor Raddysh at The Hockey Writers (Mon Jul 13, 2026)
-
2025-2026 Taylor Raddysh report card at Blue Seat Blogs (Thu Jun 4, 2026)
-
New York Rangers report cards: Grading Gavrikov, off-season additions at Forever Blueshirts (Mon May 18, 2026)
-
2026 Rangers Report Card: Taylor Raddysh at Blue Shirt Banter (Sat May 9, 2026)
-
NYR/TBL 4/15 Review: GARAND THEFT AUTO Strikes Again; Rangers Mercifully Conclude Their Crappy Centennial Campaign, Bad Win For The Tankers (And Will Drury Trade The Pick?) – But A Great Win For The BABY BUCK BLUESHIRTS, Mika Named The MVP of This Mess, “WHO STAYS AND WHO GOES” – 2026-27 Edition, Get Dave Maloney A Cough Drop; Propaganda M$GN In Full Effect, What Lies Ahead & Much More at Blue Collar Blue Shirts (Thu Apr 16, 2026)
-
Rangers vs. Flyers: Lineups, storylines with Taylor Raddysh at father’s funeral at Forever Blueshirts (Mon Mar 9, 2026)
-
Why Taylor Raddysh is the next logical trade candidate for the Rangers at Blue Line Station (Fri Mar 6, 2026)
-
Rewatch Taylor Raddysh’s hat trick versus San Jose at Blue Seat Blogs (Sat Feb 28, 2026)
-
Avalanche should go after this player as part of Rangers’ impending fire sale at Mile High Sticking (Thu Jan 15, 2026)
-
Lightning end road trip with resounding 7-3 win over San Jose at Raw Charge (Sun Jan 4, 2026)
-
The 2025-26 New York Rangers Mid-Season Report Card: Grades & Detailed Reviews of Every Blueshirt, Thoughts at the 50% Mark of the Season, The Highs & Lows, Predictions, Looking at Last Year, “Same Old Rangers,” The Lack of Scoring, What Is Drury Doing, NYR v. NYI & More at Blue Collar Blue Shirts (Mon Dec 29, 2025)
-
Taylor Raddysh’s scratch becomes a needed wake-up call as pressure mounts to respond at Blue Line Station (Tue Dec 9, 2025)
-
Taylor Raddysh has disappeared for the Rangers since his hat trick night at Blue Line Station (Sun Nov 30, 2025)
-
Rangers lines tonight: Top line Taylor Raddysh at Blue Seat Blogs (Sun Oct 26, 2025)
-
Rangers Daily: Overlooked Taylor Raddysh hat trick; NHL trade rumors at Forever Blueshirts (Sat Oct 25, 2025)
-
Taylor Raddysh’s breakout showing gives Rangers something to build on at Blue Line Station (Sat Oct 25, 2025)
-
Taylor Raddysh and Macklin Celebrini have dueling hat tricks as Sharks beat Rangers for first victory of season at Russian Machine Never Breaks (Thu Oct 23, 2025)
-
Recap: Raddysh Nets Hat Trick but Rangers Fall 6-5 to Sharks in OT at Blue Shirt Banter (Thu Oct 23, 2025)
-
Sheary, Parssinen, and Raddysh will not take spots from the Rangers prospects long term at Blue Seat Blogs (Fri Oct 3, 2025)
-
2025 Rangers Season Previews: Taylor Raddysh at Blue Shirt Banter (Tue Sep 9, 2025)
-
Why Taylor Raddysh is 3rd-line anchor ahead of 1st season with Rangers at Forever Blueshirts (Thu Aug 28, 2025)
-
The center Rangers let slip away might be key to their 2025 success at Blue Line Station (Fri Jul 4, 2025)
-
Tampa Bay has potential to reunite two brothers in free agency at Bolts by the Bay (Tue Jul 1, 2025)
-
Taylor Raddysh 2024-25 Report Card at Stars and Sticks (Sat May 31, 2025)
Current Contract
Taylor Raddysh signed a $3,000,000 2-year contract with the New York Rangers and General Manager Chris Drury on July 1, 2025 with an AAV of $1,500,000. This contract will start in 2025-26 and end after the 2026-27 season. In the first season of the contract the cap hit was equivalent to 1.57% of the salary cap.
Standard Contract (UFA) ( ) (0 ratings)
Taylor Raddysh signed a $1,000,000 1-year contract with the Washington Capitals and General Manager Brian MacLellan on July 1, 2024 with an AAV of $1,000,000. This contract will start in 2024-25 and end after the 2024-25 season. In the first season of the contract the cap hit was equivalent to 1.14% of the salary cap.
Standard Contract (UFA) ( ) (0 ratings)
| Season | Age* | Clause | Cap Hit | AAV | Perf. Bonus | Sign. Bonus | Salary | Compensation | Minors Salary | Status | |
|---|---|---|---|---|---|---|---|---|---|---|---|
| 2024-25 | 26 | $1,000,000 | $1,000,000 | - | - | $1,000,000 | $1,000,000 | $1,000,000 | RFA-arb | ||
| Total | - | - | $1,000,000 | $1,000,000 | $1,000,000 |
Taylor Raddysh signed a $2,275,000 3-year contract with the Tampa Bay Lightning and General Manager Julien Brisebois on July 30, 2021 with an AAV of $758,333. This contract will start in 2021-22 and end after the 2023-24 season. In the first season of the contract the cap hit was equivalent to 0.93% of the salary cap.
Standard Contract (RFA) ( ) (0 ratings)
| Season | Age* | Clause | Cap Hit | AAV | Perf. Bonus | Sign. Bonus | Salary | Compensation | Minors Salary | Status | |
|---|---|---|---|---|---|---|---|---|---|---|---|
| 2021-22 | 23 | $758,333 | $758,333 | - | - | $750,000 | $750,000 | $100,000 | RFA | ||
| 2022-23 | 24 | $758,333 | $758,333 | - | - | $750,000 | $750,000 | $750,000 | RFA-arb | ||
| 2023-24 | 25 | $758,333 | $758,333 | - | - | $775,000 | $775,000 | $775,000 | RFA-arb | ||
| Total | - | - | $2,275,000 | $2,275,000 | $1,625,000 |
Taylor Raddysh signed a $2,592,500 3-year contract with the Tampa Bay Lightning and General Manager Steve Yzerman on May 15, 2017 with an AAV of $846,167. This contract will start in 2017-18 and end after the 2020-21 season. In the first season of the contract the cap hit was equivalent to 1.13% of the salary cap.
Entry Level Contract ( ) (0 ratings)
| Season | Age* | Clause | Cap Hit | AAV | Perf. Bonus | Sign. Bonus | Salary | Compensation | Minors Salary | Status | |
|---|---|---|---|---|---|---|---|---|---|---|---|
| 2017-18 | 19 | $846,167 | $925,000 | - | $92,500 | - | $92,500 | - | ELC | ||
| 2018-19 | 20 | $833,333 | $894,167 | $182,500 | $92,500 | $650,000 | $742,500 | $70,000 | ELC | ||
| 2019-20 | 21 | $833,333 | $894,167 | - | $92,500 | $832,500 | $925,000 | $70,000 | ELC | ||
| 2020-21 | 22 | $833,333 | $894,167 | - | - | $832,500 | $832,500 | $70,000 | ELC | ||
| Total | $182,500 | $277,500 | $2,315,000 | $2,592,500 | $210,000 |
Career Statistics
| Regular Season | Playoffs | |||||||||||||||||||
|---|---|---|---|---|---|---|---|---|---|---|---|---|---|---|---|---|---|---|---|---|
| Season | League | Team | GP | G | A | Pts | +/- | PIM | Shots | Sh% | TOI/G | GP | G | A | Pts | +/- | PIM | Shots | Sh% | TOI/G |
| 2013-14 | GTHL | Tor. Marlboros | 31 | 25 | 27 | 52 | 28 | 14 | 3 | 4 | 7 | 10 | ||||||||
| 2013-14 | Other | Tor. Marlboros | 7 | 5 | 9 | 14 | 14 | |||||||||||||
| 2014-15 | OHL | Erie | 58 | 21 | 6 | 27 | -8 | 13 | 20 | 3 | 3 | 6 | -1 | 8 | ||||||
| 2015-16 | OHL | Erie | 67 | 24 | 49 | 73 | +19 | 18 | 226 | 1,060.0 | 12 | 4 | 6 | 10 | +4 | 2 | 29 | 1,380.0 | ||
| 2016-17 | WJC-20 | Canada U20 | 7 | 5 | 1 | 6 | +3 | 4 | ||||||||||||
| 2016-17 | M-Cup | Erie Otters | 5 | 5 | 6 | 11 | +2 | |||||||||||||
| 2016-17 | OHL | Erie Otters | 58 | 42 | 67 | 109 | +67 | 37 | 22 | 12 | 19 | 31 | +16 | 18 | ||||||
| 2017-18 | OHL | Erie Otters | 30 | 15 | 29 | 44 | +10 | 16 | ||||||||||||
| 2017-18 | WJC-20 | Canada U20 | 7 | 2 | 3 | 5 | +5 | 4 | ||||||||||||
| 2017-18 | OHL | Soo Greyhounds | 28 | 18 | 21 | 39 | +14 | 14 | 24 | 13 | 21 | 34 | -6 | 14 | ||||||
| 2018-19 | AHL | Syracuse Crunch | 70 | 18 | 28 | 46 | +14 | 34 | 4 | -3 | 2 | |||||||||
| 2019-20 | AHL | Syracuse Crunch | 62 | 19 | 16 | 35 | -13 | 20 | ||||||||||||
| 2020-21 | AHL | Syracuse Crunch | 27 | 12 | 17 | 29 | +2 | 10 | ||||||||||||
| 2021-22 | NHL | Tampa Bay Lightning | 53 | 5 | 7 | 12 | +5 | 8 | 61 | 8.2 | 11:03 | |||||||||
| 2021-22 | NHL | Chicago Blackhawks | 21 | 6 | 4 | 10 | -4 | 2 | 43 | 14.0 | 15:34 | |||||||||
| 2022-23 | NHL | Chicago Blackhawks | 78 | 20 | 17 | 37 | -28 | 16 | 129 | 15.5 | 16:34 | |||||||||
| 2023-24 | NHL | Chicago Blackhawks | 73 | 5 | 9 | 14 | -19 | 22 | 120 | 4.2 | 15:53 | |||||||||
| 2024-25 | NHL | Washington Capitals | 80 | 7 | 20 | 27 | -7 | 18 | 93 | 7.5 | 12:22 | 7 | 1 | 1 | -1 | 4 | 6 | 0.0 | 11:11 | |
| 2025-26 | NHL | New York Rangers | 68 | 9 | 10 | 19 | +5 | 12 | 53 | 17.0 | 11:51 | |||||||||
| NHL Career | 373 | 52 | 67 | 119 | -48 | 78 | 499 | 10.4 | 13:50 | 7 | 1 | 1 | -1 | 4 | 6 | 0.0 | 11:11 | |||