
 Stefan Noesen
| Position | Left Wing / Right Wing | Current Team | New Jersey Devils |
| Shoots | Right | Current Contract | 3 years ($2.8M CapHit) |
| Height | 6'1" | Expires | 2026-27 |
| Weight (lbs) | 205 | Expiry Age (Jun 30) | 34 |
| Age (DOB) | 33 (Feb 12, 1993) | Expiry Status | UFA |
| Drafted | 2011, Round 1, Overall 21 (OTT) |
| Date | Team | Transaction | |
|---|---|---|---|
| Jan 10, 2026 | New Jersey Devils | Placed on LTIR | |
| Oct 22, 2025 | New Jersey Devils | Activated from IR | |
| Oct 6, 2025 | New Jersey Devils | Placed on IR | |
| Oct 6, 2025 | Nashville Predators | Placed on IR | |
| Jul 1, 2024 | New Jersey Devils | Signed 3 years @ $2.750M AAV starting in 2024-25 | |
| Jul 12, 2022 | Carolina Hurricanes | Signed 2 years @ $762K AAV starting in 2022-23 | |
| Aug 1, 2021 | Carolina Hurricanes | Signed 1 year @ $750K AAV starting in 2021-22 | |
| Oct 9, 2020 | San Jose Sharks | Signed 1 year @ $925K AAV starting in 2020-21 | |
| Dec 3, 2019 | Pittsburgh Penguins | Signed 1 year @ $700K AAV starting in 2019-20 | |
| Jul 17, 2018 | New Jersey Devils | Signed 1 year @ $1.725M AAV starting in 2018-19 | |
| Jul 26, 2017 | New Jersey Devils | Signed 1 year @ $600K AAV starting in 2017-18 | |
| Jul 23, 2016 | Anaheim Ducks | Signed 1 year @ $600K AAV starting in 2016-17 | |
| Dec 22, 2011 | Ottawa Senators | Signed to an entry level contract. |
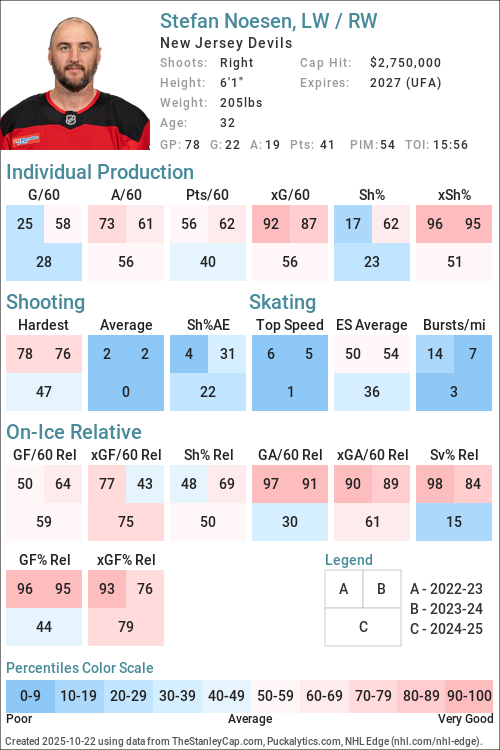
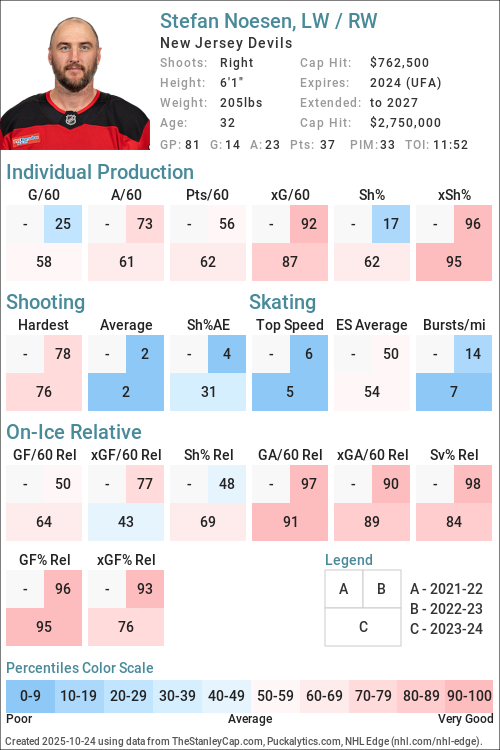
Player Card(s)

URL: https://thestanleycap.com/cdn/player_cards/20252026/stefan-noesen-8476474.png
URL: https://thestanleycap.com/cdn/player_cards/20242025/stefan-noesen-8476474.png
URL: https://thestanleycap.com/cdn/player_cards/20232024/stefan-noesen-8476474.png
About Player Cards
Player cards present an infographic of a players performance using a series of Player Archetypes developed for Puckalytics.com and TheStanleyCap.com. The boxes in the rink image show the archetype ratings for the season specified in the card while the graphs to the right show the five-year trends for those archetypes.
Except for Faceoffs, the values shown are the players z-score (standard deviation from the mean) for the specific metric used to calculate the archetype values. When calculating z-scores forwards were compared to forwards and defensemen were compared to defensemen. Positive values indicate the player is above average and shaded in blue, while negative values indicate the player is below average and shaded in pink. The five year trend charts show a range of -4.0 to 4.0.
The value shown for Faceoffs is the faceoff winning percentage rather than their z-score with winning percentages below 50 in pink shades and above 50 in blue shades.
All archetypes are 5v5 except 5v4 TOI, 4v5 TOI, Skating (even strength) and Faceoffs (all situations). Archetypes use regular season data only.
Archetypes Summary
- Sniper - Measures the to score above the expected goal rate.
- Rebound - Measures the percent of a players shot attempts that come from rebounds (forwards only).
- 5v4 TOI - Powerplay ice time, calculated as the percentage of his teams 5v4 ice time that the player was on the ice for.
- Shooter - Measures whether a players points come from shots (goals or assists on rebounds from his shots).
- Producer - Measures a players ability to produce goals and assists, adjusted for quality of teammates.
- Playmaker - Measures whether a players points come from passes.
- Drive - Measures a players ability to drive puck possession and generate shot attempts for his team.
- Rush - Measures the percent of a players shot attempts that come from rush plays
- Possession - An indicator of a players ability to improve his teams puck possession game.
- Faceoffs - Faceoff Winning Percentage (min. 75 faceoffs taken).
- 5v5 TOI - The percentage of his teams 5v5 TOI that the player was on the ice for.
- Suppress - Measures a players ability to suppress opponent puck possession and shot attempts against.
- Skating - An indicator of a players skating ability, or speed bursts above 20mph per mile skated.
- Defend - An indicator of a players ability to suppress shot quality against.
- 4v5 TOI - Penalty Kill ice time, calculated as the percentage of his teams 4v5 ice time that the player was on the ice for.
Data Sources
- Salary data is from TheStanleyCap.com
- Skating data is from NHL Edge
- Other statistics are from Puckalytics.com and derived from data from NHL.com
Terms of Use
You are free to use include player cards in written articles, share on social media, or on other public websites under the following conditions:
- You credit TheStanleyCap.com as the source and provide a link back to TheStanleyCap.com or this player page.
- You do not mass copy/duplicate/publish dozens or hundreds of player cards. A few, or a handful for a written article is fine. Be reasonable. Fair use rules apply.
- If you are a high-traffic website you must download and host the image(s) on your site rather than overload TheStanleyCap servers with traffic.
Note: Player cards will update daily throughout the season so if you want to include snapshot then you must download the image.
If you have any questions, send an e-mail to the e-mail address at the top of this page.
Read Introducing Player Archetypes on HockeyAnalysis.com for more details on archetype calculations.
Core Archetypes
| Season | Team(s) | GP | TOI | Producer | Playmaker | Shooter | Sniper | Rebound | Rush | Skating | Defend |
|---|---|---|---|---|---|---|---|---|---|---|---|
| 2015-16 | ANA | 1 | - | - | - | - | - | - | - | 0.04 | |
| 2016-17 | ANA, NJD | 44 | -0.35 | -1.37 | 2.18 | 0.98 | 1.75 | -1.33 | - | 2.93 | |
| 2017-18 | NJD | 72 | 0.14 | 0.02 | 0.04 | 0.01 | 0.61 | -1.69 | - | 0.74 | |
| 2018-19 | NJD | 41 | -1.30 | -0.49 | -1.23 | -2.74 | 2.47 | 0.39 | - | -1.57 | |
| 2019-20 | PIT, SJS | 40 | -0.36 | -1.44 | 1.99 | -0.01 | 0.34 | -0.11 | - | 1.68 | |
| 2020-21 | SJS, TOR | 6 | - | - | - | -1.19 | -2.02 | 7.59 | - | 5.96 | |
| 2021-22 | CAR | 2 | -2.20 | -1.69 | -1.54 | -3.76 | 2.38 | -2.04 | -1.63 | 6.52 | |
| 2022-23 | CAR | 78 | -0.02 | 0.24 | -0.54 | -1.44 | 0.81 | -1.20 | -0.94 | 1.98 | |
| 2023-24 | CAR | 81 | 0.14 | 0.27 | -0.20 | -0.43 | 2.06 | -1.19 | -1.16 | 0.94 | |
| 2024-25 | NJD | 78 | -0.49 | 0.00 | -0.75 | -0.50 | 1.69 | -0.75 | -1.43 | -0.95 | |
| 2025-26 | NJD | 38 | -1.39 | -1.17 | -0.82 | -0.90 | 1.55 | -1.69 | -1.44 | 1.00 |
Situational and Secondary Archetypes
| Season | Team(s) | GP | TOI | 5v5 TOI | 5v4 TOI | 4v5 TOI | Possession | Drive | Suppress | Faceoffs |
|---|---|---|---|---|---|---|---|---|---|---|
| 2015-16 | ANA | 1 | -1.68 | -1.21 | -1.54 | 0.35 | -0.20 | 1.99 | - | |
| 2016-17 | ANA, NJD | 44 | -0.94 | -1.89 | -1.47 | 0.98 | 0.15 | 1.66 | - | |
| 2017-18 | NJD | 72 | 0.19 | -1.77 | -1.89 | 1.09 | 0.20 | 1.65 | - | |
| 2018-19 | NJD | 41 | -0.23 | -1.37 | -1.95 | -1.01 | -1.02 | -0.18 | - | |
| 2019-20 | PIT, SJS | 40 | -1.05 | -1.17 | -1.92 | 0.10 | -0.03 | 0.19 | - | |
| 2020-21 | SJS, TOR | 6 | -1.44 | -2.09 | -1.97 | -1.83 | -4.27 | 3.26 | - | |
| 2021-22 | CAR | 2 | 0.40 | -0.74 | -2.02 | 2.32 | 1.47 | 2.88 | - | |
| 2022-23 | CAR | 78 | -1.56 | 0.62 | -1.93 | 1.41 | 0.54 | 1.43 | 49.1 | |
| 2023-24 | CAR | 81 | -1.15 | -0.34 | -2.00 | 0.76 | -0.23 | 1.43 | 42.2 | |
| 2024-25 | NJD | 78 | 0.05 | 0.48 | -1.34 | 0.83 | 0.61 | 0.47 | 48.2 | |
| 2025-26 | NJD | 38 | -1.57 | -0.14 | -1.89 | -2.08 | -1.69 | -0.88 | - |
5v5 Individual Stats
| Season | Team(s) | GP | TOI | G/60 | A/60 | Pts/60 | xG/60 | GAE/60 | Sh% | xSh% | Sh%AE | %SA Rush | %SA Reb. |
|---|---|---|---|---|---|---|---|---|---|---|---|---|---|
| 2015-16 | ANA | 1 | 6:35 | 0.00 | 0.00 | 0.00 | 0.00 | 0.00 | - | - | - | - | - |
| 2016-17 | ANA | 12 | 71:49 | 1.67 | 0.00 | 1.67 | 0.69 | 0.98 | 22.22 | 9.20 | 13.02 | 0.00 | 18.18 |
| 2016-17 | NJD | 32 | 376:39 | 0.96 | 0.32 | 1.27 | 0.83 | 0.12 | 12.24 | 10.66 | 1.58 | 1.49 | 7.46 |
| 2016-17 | ANA, NJD | 44 | 448:28 | 1.07 | 0.27 | 1.34 | 0.81 | 0.26 | 13.79 | 10.44 | 3.36 | 1.28 | 8.97 |
| 2017-18 | NJD | 72 | 886:12 | 0.74 | 0.95 | 1.69 | 0.74 | 0.00 | 9.02 | 8.99 | 0.03 | 0.63 | 6.29 |
| 2018-19 | NJD | 41 | 472:54 | 0.25 | 0.51 | 0.76 | 0.96 | -0.71 | 3.39 | 12.85 | -9.46 | 4.88 | 10.98 |
| 2019-20 | SJS | 34 | 365:09 | 0.82 | 0.33 | 1.15 | 0.92 | -0.10 | 9.09 | 10.21 | -1.12 | 1.35 | 6.76 |
| 2019-20 | PIT | 6 | 54:22 | 1.10 | 0.00 | 1.10 | 0.53 | 0.57 | 12.50 | 6.02 | 6.48 | 22.22 | 11.11 |
| 2019-20 | PIT, SJS | 40 | 419:31 | 0.86 | 0.29 | 1.14 | 0.87 | -0.01 | 9.52 | 9.68 | -0.16 | 3.61 | 7.23 |
| 2020-21 | SJS | 5 | 46:36 | 0.00 | 0.00 | 0.00 | 0.32 | -0.32 | 0.00 | 4.94 | -4.94 | 20.00 | 0.00 |
| 2020-21 | TOR | 1 | 9:02 | 0.00 | 0.00 | 0.00 | 0.00 | 0.00 | - | - | - | - | - |
| 2020-21 | SJS, TOR | 6 | 55:38 | 0.00 | 0.00 | 0.00 | 0.27 | -0.27 | 0.00 | 4.94 | -4.94 | 20.00 | 0.00 |
| 2021-22 | CAR | 2 | 26:01 | 0.00 | 0.00 | 0.00 | 1.26 | -1.26 | 0.00 | 13.65 | -13.65 | 0.00 | 12.50 |
| 2022-23 | CAR | 78 | 734:31 | 0.49 | 1.23 | 1.72 | 0.92 | -0.43 | 6.59 | 12.40 | -5.81 | 1.40 | 9.79 |
| 2023-24 | CAR | 81 | 809:12 | 0.74 | 1.04 | 1.78 | 0.84 | -0.10 | 11.24 | 12.79 | -1.55 | 1.37 | 14.38 |
| 2024-25 | NJD | 78 | 970:15 | 0.49 | 0.93 | 1.42 | 0.62 | -0.13 | 7.92 | 9.93 | -2.01 | 1.28 | 12.18 |
| 2025-26 | NJD | 38 | 374:31 | 0.32 | 0.32 | 0.64 | 0.59 | -0.27 | 5.26 | 9.67 | -4.40 | 0.00 | 13.04 |
5v5 On Ice Stats
| Season | Team(s) | GP | TOI | SAF/60 | GF/60 | xGF/60 | SAA/60 | GA/60 | xGA/60 | GF% | xGF% | xGF Rel | xGA Rel | xGF% Rel |
|---|---|---|---|---|---|---|---|---|---|---|---|---|---|---|
| 2015-16 | ANA | 1 | 6:35 | 18.23 | 0.00 | 0.46 | 45.57 | 0.00 | 1.94 | - | 19.26 | -0.20 | -0.15 | -4.76 |
| 2016-17 | ANA | 12 | 71:49 | 34.25 | 2.51 | 1.72 | 31.75 | 0.84 | 1.55 | 75.00 | 52.54 | -0.59 | -0.61 | 0.94 |
| 2016-17 | NJD | 32 | 376:39 | 41.10 | 2.07 | 2.38 | 38.39 | 1.43 | 2.14 | 59.09 | 52.60 | 0.08 | -0.22 | 3.25 |
| 2016-17 | ANA, NJD | 44 | 448:28 | 40.00 | 2.14 | 2.27 | 37.33 | 1.34 | 2.05 | 61.54 | 52.59 | -0.03 | -0.25 | 2.61 |
| 2017-18 | NJD | 72 | 886:12 | 43.13 | 2.51 | 2.50 | 38.93 | 1.96 | 2.03 | 56.06 | 55.13 | 0.10 | -0.40 | 5.52 |
| 2018-19 | NJD | 41 | 472:54 | 38.44 | 1.14 | 2.50 | 44.03 | 3.04 | 2.63 | 27.27 | 48.75 | -0.11 | 0.21 | -3.18 |
| 2019-20 | SJS | 34 | 365:09 | 42.89 | 1.48 | 2.26 | 39.93 | 1.48 | 2.04 | 50.00 | 52.65 | -0.36 | -0.53 | 2.01 |
| 2019-20 | PIT | 6 | 54:22 | 36.42 | 1.10 | 1.61 | 35.32 | 1.10 | 2.64 | 50.00 | 37.81 | -0.84 | 0.96 | -21.44 |
| 2019-20 | PIT, SJS | 40 | 419:31 | 42.05 | 1.43 | 2.18 | 39.33 | 1.43 | 2.11 | 50.00 | 50.75 | -0.42 | -0.31 | -0.98 |
| 2020-21 | SJS | 5 | 46:36 | 25.75 | 0.00 | 1.42 | 37.34 | 0.00 | 1.73 | - | 45.15 | -0.81 | -1.10 | 1.00 |
| 2020-21 | TOR | 1 | 9:02 | 39.85 | 0.00 | 4.35 | 39.85 | 0.00 | 5.21 | - | 45.51 | 0.27 | 2.89 | -18.22 |
| 2020-21 | SJS, TOR | 6 | 55:38 | 28.04 | 0.00 | 1.90 | 37.75 | 0.00 | 2.29 | - | 45.28 | -0.66 | -0.44 | -3.09 |
| 2021-22 | CAR | 2 | 26:01 | 57.66 | 2.31 | 4.25 | 41.51 | 0.00 | 3.29 | 100.00 | 56.41 | 0.63 | -0.77 | 9.21 |
| 2022-23 | CAR | 78 | 734:31 | 51.71 | 2.61 | 3.18 | 30.22 | 1.23 | 1.91 | 68.09 | 62.54 | 0.24 | -0.28 | 5.14 |
| 2023-24 | CAR | 81 | 809:12 | 48.94 | 2.74 | 2.87 | 31.88 | 1.63 | 1.97 | 62.71 | 59.30 | -0.03 | -0.32 | 3.40 |
| 2024-25 | NJD | 78 | 970:15 | 42.30 | 2.41 | 2.51 | 38.34 | 2.47 | 2.25 | 49.37 | 52.66 | 0.19 | -0.07 | 2.67 |
| 2025-26 | NJD | 38 | 374:31 | 34.28 | 0.96 | 1.92 | 42.45 | 2.40 | 2.46 | 28.57 | 43.86 | -0.62 | -0.19 | -5.07 |
NHL Edge Stats
| Skating | Shooting | Zone Time | |||||||||||
|---|---|---|---|---|---|---|---|---|---|---|---|---|---|
| Season | GP | Top Speed | Bursts>20/mi | Avg. Speed | Top Speed | Avg. Speed | %Long Range | %Mid Range | %High Danger | ES DZ% | ES NZ% | ES OZ% | |
| This table is for Basic and Premium subscribers only. To view please login to and/or subscribe to one of our subscription plans. | |||||||||||||
Legend
| Percentile 0-25 | Percentile 25-50 | Percentile 50-75 | Percentile 75-100 |
5v5 Lines
| Season | Teammate | Teammate | Team | TOI | GF/60 | GA/60 | GF% | xGF/60 | xGA/60 | xGF% | xGF Rel | xGA Rel | xGF% Rel |
|---|
Glossary
| Type | Statistic | Definition |
|---|---|---|
| Individual | G/60 | Goals Against per 60 minutes. |
| Individual | A/60 | Assists per 60 minutes. |
| Individual | Pts/60 | Points per 60 minutes. |
| Individual | xG/60 | Expected Goals per 60 minutes. |
| Individual | GAE/60 | Goals Above Expected (G/60 - xG/60). |
| Individual | Sh% | Shooting Percentage. |
| Individual | xSh% | Expected Shooting Percentage. |
| Individual | Sh%AE | Shooting percentage above expected (Sh% - xSh%). |
| Individual | %SA Rush | Percentage of shot attempts determined to be on the rush. |
| Individual | %SA Reb. | Percentage of shot attempts determined to be from rebounds. |
| On Ice | SAF/60 | Shot Attempts For per 60 minutes. |
| On Ice | GF/60 | Goals For per 60 minutes. |
| On Ice | xGF/60 | Expected Goals For per 60 minutes. |
| On Ice | SAA/60 | Shot Attempts Against per 60 minutes (lower is better). |
| On Ice | GA/60 | Goals Against per 60 minutes (lower is better). |
| On Ice | xGA/60 | Expected Goals Against per 60 minutes (lower is better). |
| On Ice | GF% | Goals For Percentage = Goals For / (Goals For + Goals Against) |
| On Ice | xGF% | Expected Goals For Percentage = Expected Goals For / (Expected Goals For + Expected Goals Against) |
| On Ice | xGF Rel | xGF/60 when On Ice - xGF/60 when not On Ice. |
| On Ice | xGA Rel | xGA/60 when On Ice - xGA/60 when not On Ice (lower is better). |
| On Ice | xGF% Rel | xGF% when On Ice - xGF% when not On Ice. |
News and Opinions
-
An Exercise in Analytics: What Would the Ideal Devils Forward Lineup Be? at All About the Jersey (Sat Jul 4, 2026)
-
Assessing the value of Stefan Noesen after a down season with the New Jersey Devils at Pucks and Pitchforks (Thu May 28, 2026)
-
New Jersey Devils’ 2025-26 Report Cards: Stefan Noesen at The Hockey Writers (Tue Apr 28, 2026)
-
Stefan Noesen's fit on the New Jersey Devils only gets more complicated at Pucks and Pitchforks (Sat Apr 25, 2026)
-
Sheldon Keefe just gave two major injury updates, and neither are good at Pucks and Pitchforks (Sun Mar 22, 2026)
-
Struggling New Jersey Devils forward to miss extended time following knee surgery at Pucks and Pitchforks (Sat Jan 10, 2026)
-
Devils’ Stefan Noesen to Undergo Knee Surgery at The Hockey Writers (Sat Jan 10, 2026)
-
Devils Start the New Year Right With Convincing 4-1 Win Over Mammoth at All About the Jersey (Sat Jan 3, 2026)
-
CBJ 5, NJ 3: Monahan Scores Twice As Blue Jackets Fight Their Way To Victory Over Devils at 1st Ohio Battery (Mon Dec 1, 2025)
-
The November 2025 Month in Review of the New Jersey Devils at All About the Jersey (Sun Nov 30, 2025)
-
Thompson takes justice into own hands to settle old beef at Sabres Noise (Sat Nov 29, 2025)
-
Tage Thompson fights Stefan Noesen in Sabres’ shutout loss to Devils; Mattias Samuelsson leaves injured at Sabres Space (Sat Nov 29, 2025)
-
Tage Thompson fights Stefan Noesen himself avenging dirty hit from last season: ‘I figured I’d take care my own business’ at Russian Machine Never Breaks (Sat Nov 29, 2025)
-
Sabres’ Tage Thompson settles old score by engaging Devils’ Stefan Noesen in a fight at Sabres Space (Sat Nov 29, 2025)
-
Buffalo Sabres star settles a score a year in the making versus New Jersey Devils at Pucks and Pitchforks (Fri Nov 28, 2025)
-
Tage Thompson fights Stefan Noesen in Sabres’ shutout loss to Devils; Mattias Samuelsson leaves injured at Buffalo Hockey Beat (Fri Nov 28, 2025)
-
Sabres' Thompson evens beef with Devils' Noesen at ESPN (Fri Nov 28, 2025)
-
Red Wings-Devils Tweetcap: defensive mistakes bedevil the Wings, but grit, scrappy demeanor nearly yields another comeback at The Malik Report (Mon Nov 24, 2025)
-
New Jersey Devils can still drive offense with this revamped lineup at Pucks and Pitchforks (Mon Nov 10, 2025)
-
Jake Allen Dominant in Goal in 2-1 Devils Shootout Win Over Penguins at All About the Jersey (Sat Nov 8, 2025)
-
Jacob Markstrom Dethrones the Kings, Delivering 4-1 Devils Win at All About the Jersey (Sun Nov 2, 2025)
-
The Next Alternate Jersey Should Be a Road One, and Thoughts on the Fourth Line at All About the Jersey (Sun Oct 19, 2025)
-
The Noesen Question at All About the Jersey (Fri Oct 10, 2025)
-
Where Does Stefan Noesen Fit in the Devils’ Lineup Upon Return From Injury? at New Jersey Hockey Now (Wed Oct 8, 2025)
-
Devils 2025-26 Player Previews: Stefan Noesen at The Hockey Writers (Sat Sep 13, 2025)
-
How the New Jersey Devils can maximize Stefan Noesen in a lesser role at Pucks and Pitchforks (Wed Jul 30, 2025)
-
It's surprisingly hard to find Stefan Noesen's role for New Jersey Devils at Pucks and Pitchforks (Tue Jul 29, 2025)
-
5 under-the-radar free agent additions that paid off for the Carolina Hurricanes at Cardiac Cane (Thu Jul 24, 2025)
-
Where Can the Devils Get Enough Offense to Make Them Contenders? at All About the Jersey (Sun Jul 20, 2025)
-
Almost a year later, the Hurricanes came out on the right side of 2024's free agency at Cardiac Cane (Sat Jun 7, 2025)
-
Behind A Defensive Masterclass, Devils Shutout Penguins 3-0 at Devils Army (Sun Dec 22, 2024)
-
Stefan Noesen Having A Career Year In His Homecoming To New Jersey at Devils Army (Mon Nov 25, 2024)
-
Devils Dismantle Ducks In 6-2 Thrashing at Devils Army (Mon Oct 28, 2024)
-
Analyzing the Devils’ Restricted Free Agents at Devils Army (Mon Apr 22, 2019)
-
Devils Sign Texan Duo Blake Coleman, Stefan Noesen at Devils Army (Wed Jul 18, 2018)
-
Blake Coleman, Stefan Noesen File For Salary Arbitration at Devils Army (Fri Jul 6, 2018)
-
Stefan Noesen and Co. Spoil Adam Henrique’s Return To New Jersey at Devils Army (Tue Dec 19, 2017)
-
Recap: Miscues Doom Devils Once Again at Devils Army (Fri Jan 27, 2017)
-
Devils Claim Ex-first Round Pick Stefan Noesen at Devils Army (Thu Jan 26, 2017)
Current Contract
Stefan Noesen signed a $7,350,000 3-year contract with the New Jersey Devils and General Manager Tom Fitzgerald on July 1, 2024 with an AAV of $2,750,000. This contract will start in 2024-25 and end after the 2026-27 season. In the first season of the contract the cap hit was equivalent to 3.13% of the salary cap.
Standard Contract (UFA) ( ) (0 ratings)
Stefan Noesen signed a $1,525,000 2-year contract with the Carolina Hurricanes and General Manager Don Waddell on July 12, 2022 with an AAV of $762,500. This contract will start in 2022-23 and end after the 2023-24 season. In the first season of the contract the cap hit was equivalent to 0.92% of the salary cap.
Standard Contract (UFA) ( ) (0 ratings)
| Season | Age* | Clause | Cap Hit | AAV | Perf. Bonus | Sign. Bonus | Salary | Compensation | Minors Salary | Status | |
|---|---|---|---|---|---|---|---|---|---|---|---|
| 2022-23 | 29 | $762,500 | $762,500 | - | - | $750,000 | $750,000 | $500,000 | UFA | ||
| 2023-24 | 30 | $762,500 | $762,500 | - | - | $775,000 | $775,000 | $775,000 | UFA | ||
| Total | - | - | $1,525,000 | $1,525,000 | $1,275,000 |
Stefan Noesen signed a $750,000 1-year contract with the Carolina Hurricanes and General Manager Don Waddell on August 1, 2021 with an AAV of $750,000. This contract will start in 2021-22 and end after the 2021-22 season. In the first season of the contract the cap hit was equivalent to 0.92% of the salary cap.
Standard Contract (UFA) ( ) (0 ratings)
| Season | Age* | Clause | Cap Hit | AAV | Perf. Bonus | Sign. Bonus | Salary | Compensation | Minors Salary | Status | |
|---|---|---|---|---|---|---|---|---|---|---|---|
| 2021-22 | 28 | $750,000 | $750,000 | - | - | $750,000 | $750,000 | $250,000 | UFA | ||
| Total | - | - | $750,000 | $750,000 | $250,000 |
Stefan Noesen signed a $925,000 1-year contract with the San Jose Sharks and General Manager Doug Wilson on October 9, 2020 with an AAV of $925,000. This contract will start in 2020-21 and end after the 2020-21 season. In the first season of the contract the cap hit was equivalent to 1.13% of the salary cap.
Standard Contract (UFA) ( ) (0 ratings)
| Season | Age* | Clause | Cap Hit | AAV | Perf. Bonus | Sign. Bonus | Salary | Compensation | Minors Salary | Status | |
|---|---|---|---|---|---|---|---|---|---|---|---|
| 2020-21 | 27 | $925,000 | $925,000 | - | - | $925,000 | $925,000 | $925,000 | UFA | ||
| Total | - | - | $925,000 | $925,000 | $925,000 |
Stefan Noesen signed a $700,000 1-year contract with the Pittsburgh Penguins and General Manager Jim Rutherford on December 3, 2019 with an AAV of $700,000. This contract will start in 2019-20 and end after the 2019-20 season. In the first season of the contract the cap hit was equivalent to 0.86% of the salary cap.
Standard Contract (UFA) ( ) (0 ratings)
| Season | Age* | Clause | Cap Hit | AAV | Perf. Bonus | Sign. Bonus | Salary | Compensation | Minors Salary | Status | |
|---|---|---|---|---|---|---|---|---|---|---|---|
| 2019-20 | 26 | $700,000 | $700,000 | - | - | $700,000 | $700,000 | $250,000 | RFA-arb | ||
| Total | - | - | $700,000 | $700,000 | $250,000 |
Stefan Noesen signed a $1,725,000 1-year contract with the New Jersey Devils and General Manager Ray Shero on July 17, 2018 with an AAV of $1,725,000. This contract will start in 2018-19 and end after the 2018-19 season. In the first season of the contract the cap hit was equivalent to 2.17% of the salary cap.
Standard Contract (RFA) ( ) (0 ratings)
| Season | Age* | Clause | Cap Hit | AAV | Perf. Bonus | Sign. Bonus | Salary | Compensation | Minors Salary | Status | |
|---|---|---|---|---|---|---|---|---|---|---|---|
| 2018-19 | 25 | $1,725,000 | $1,725,000 | - | - | $1,725,000 | $1,725,000 | $1,725,000 | RFA-arb | ||
| Total | - | - | $1,725,000 | $1,725,000 | $1,725,000 |
Stefan Noesen signed a $600,000 1-year contract with the New Jersey Devils and General Manager Ray Shero on July 26, 2017 with an AAV of $600,000. This contract will start in 2017-18 and end after the 2017-18 season. In the first season of the contract the cap hit was equivalent to 0.80% of the salary cap.
Standard Contract (RFA) ( ) (0 ratings)
| Season | Age* | Clause | Cap Hit | AAV | Perf. Bonus | Sign. Bonus | Salary | Compensation | Minors Salary | Status | |
|---|---|---|---|---|---|---|---|---|---|---|---|
| 2017-18 | 24 | $600,000 | $600,000 | - | - | $600,000 | $600,000 | $70,000 | RFA | ||
| Total | - | - | $600,000 | $600,000 | $70,000 |
Stefan Noesen signed a $600,000 1-year contract with the Anaheim Ducks and General Manager Bob Murray on July 23, 2016 with an AAV of $600,000. This contract will start in 2016-17 and end after the 2016-17 season. In the first season of the contract the cap hit was equivalent to 0.82% of the salary cap.
Standard Contract (RFA) ( ) (0 ratings)
| Season | Age* | Clause | Cap Hit | AAV | Perf. Bonus | Sign. Bonus | Salary | Compensation | Minors Salary | Status | |
|---|---|---|---|---|---|---|---|---|---|---|---|
| 2016-17 | 23 | $600,000 | $600,000 | - | - | $600,000 | $600,000 | $70,000 | 10.2(c) | ||
| Total | - | - | $600,000 | $600,000 | $70,000 |
Stefan Noesen signed a $2,775,000 3-year contract with the Ottawa Senators and General Manager Bryan Murray on December 22, 2011 with an AAV of $925,000. This contract will start in 2011-12 and end after the 2015-16 season. In the first season of the contract the cap hit was equivalent to 1.44% of the salary cap.
Entry Level Contract ( ) (0 ratings)
| Season | Age* | Clause | Cap Hit | AAV | Perf. Bonus | Sign. Bonus | Salary | Compensation | Minors Salary | Status | |
|---|---|---|---|---|---|---|---|---|---|---|---|
| 2011-12 | 18 | $925,000 | $1,137,500 | - | $92,500 | - | $92,500 | - | ELC | ||
| 2012-13 | 19 | $894,167 | $1,106,667 | - | $92,500 | - | $92,500 | - | ELC | ||
| 2013-14 | 20 | $863,333 | $1,075,833 | $212,500 | $92,500 | $832,500 | $925,000 | $70,000 | ELC | ||
| 2014-15 | 21 | $863,333 | $1,075,833 | $212,500 | - | $832,500 | $832,500 | $70,000 | ELC | ||
| 2015-16 | 22 | $863,333 | $1,075,833 | $212,500 | - | $832,500 | $832,500 | $70,000 | ELC | ||
| Total | $637,500 | $277,500 | $2,497,500 | $2,775,000 | $210,000 |
Career Statistics
| Regular Season | Playoffs | |||||||||||||||||||
|---|---|---|---|---|---|---|---|---|---|---|---|---|---|---|---|---|---|---|---|---|
| Season | League | Team | GP | G | A | Pts | +/- | PIM | Shots | Sh% | TOI/G | GP | G | A | Pts | +/- | PIM | Shots | Sh% | TOI/G |
| 2006-07 | Minor-TX | Dal. Ice Jets | 52 | 78 | 60 | 138 | 78 | |||||||||||||
| 2007-08 | MWEHL | Det. Compuware | 31 | 31 | 14 | 45 | 54 | |||||||||||||
| 2007-08 | Exhib. | Det. Compuware | 4 | 3 | 2 | 5 | 4 | |||||||||||||
| 2008-09 | Exhib. | Det. Compuware | 20 | 6 | 10 | 16 | ||||||||||||||
| 2008-09 | T1EHL | Det. Compuware | 28 | 14 | 9 | 23 | 67 | 5 | 4 | 5 | 9 | |||||||||
| 2009-10 | OHL | Plymouth | 33 | 3 | 5 | 8 | +1 | 4 | ||||||||||||
| 2010-11 | OHL | Plymouth | 68 | 33 | 44 | 77 | +14 | 80 | 11 | 6 | 5 | 11 | -4 | 16 | ||||||
| 2011-12 | OHL | Plymouth | 63 | 38 | 44 | 82 | +18 | 74 | 7 | 7 | 8 | 15 | +1 | 4 | ||||||
| 2012-13 | OHL | Plymouth | 51 | 25 | 28 | 53 | +7 | 43 | 15 | 7 | 12 | 19 | +15 | 24 | ||||||
| 2013-14 | AHL | Norfolk | 2 | 0 | 0 | 0 | 4 | 6 | 0.0 | 4 | 4 | 4 | +1 | 4 | 15 | 0.0 | ||||
| 2014-15 | AHL | Norfolk | 27 | 7 | 9 | 16 | -5 | 27 | 79 | 890.0 | ||||||||||
| 2014-15 | NHL | Anaheim Ducks | 1 | 0 | 0 | 0 | 0.0 | 6:54 | ||||||||||||
| 2015-16 | NHL | Anaheim Ducks | 1 | 0 | 0 | 0 | 0.0 | 10:02 | ||||||||||||
| 2015-16 | AHL | San Diego | 65 | 10 | 22 | 32 | -5 | 56 | 123 | 810.0 | 9 | 2 | 5 | 7 | +1 | 2 | 11 | 1,820.0 | ||
| 2016-17 | NHL | New Jersey Devils | 32 | 6 | 2 | 8 | +4 | 22 | 51 | 11.8 | 12:50 | |||||||||
| 2016-17 | AHL | San Diego Gulls | 22 | 6 | 9 | 15 | +2 | 40 | ||||||||||||
| 2016-17 | NHL | Anaheim Ducks | 12 | 2 | 0 | 2 | +2 | 2 | 12 | 16.7 | 6:33 | |||||||||
| 2017-18 | NHL | New Jersey Devils | 72 | 13 | 14 | 27 | +12 | 36 | 127 | 10.2 | 13:17 | 4 | 1 | 1 | +1 | 4 | 9 | 11.1 | 14:19 | |
| 2018-19 | NHL | New Jersey Devils | 41 | 3 | 5 | 8 | -19 | 28 | 64 | 4.7 | 12:44 | |||||||||
| 2019-20 | NHL | San Jose Sharks | 34 | 6 | 2 | 8 | -1 | 32 | 59 | 10.2 | 11:50 | |||||||||
| 2019-20 | AHL | Wilkes-Barre/Scranton Penguins | 22 | 14 | 8 | 22 | +8 | 58 | ||||||||||||
| 2019-20 | NHL | Pittsburgh Penguins | 6 | 1 | 0 | 1 | 8 | 12.5 | 9:51 | |||||||||||
| 2020-21 | AHL | San Jose Barracuda | 12 | 2 | 4 | 6 | -2 | 23 | ||||||||||||
| 2020-21 | NHL | San Jose Sharks | 5 | 0 | 0 | 0 | 2 | 5 | 0.0 | 9:32 | ||||||||||
| 2020-21 | AHL | Toronto Marlies | 4 | 1 | 2 | 3 | +1 | 9 | ||||||||||||
| 2020-21 | NHL | Toronto Maple Leafs | 1 | 0 | 0 | 0 | 0.0 | 10:00 | ||||||||||||
| 2021-22 | NHL | Carolina Hurricanes | 2 | 0 | 0 | 0 | +1 | 4 | 0.0 | 14:20 | ||||||||||
| 2021-22 | AHL | Chicago Wolves | 70 | 48 | 37 | 85 | +35 | 112 | 18 | 9 | 16 | 25 | +10 | 18 | ||||||
| 2022-23 | NHL | Carolina Hurricanes | 78 | 13 | 23 | 36 | +11 | 32 | 134 | 9.7 | 12:20 | 15 | 4 | 4 | 8 | -3 | 11 | 24 | 16.7 | 17:02 |
| 2023-24 | NHL | Carolina Hurricanes | 81 | 14 | 23 | 37 | +13 | 33 | 111 | 12.6 | 11:52 | 11 | 4 | 4 | +1 | 21 | 11 | 36.4 | 9:22 | |
| 2024-25 | NHL | New Jersey Devils | 78 | 22 | 19 | 41 | -8 | 54 | 165 | 13.3 | 15:56 | 5 | 1 | 1 | 2 | -4 | 10 | 7 | 14.3 | 16:30 |
| 2025-26 | NHL | New Jersey Devils | 38 | 3 | 4 | 7 | -12 | 33 | 52 | 5.8 | 11:45 | |||||||||
| NHL Career | 482 | 83 | 92 | 175 | +3 | 274 | 792 | 10.5 | 12:45 | 35 | 10 | 5 | 15 | -5 | 46 | 51 | 19.6 | 14:14 | ||