
 Sidney Crosby
| Position | Center | Current Team | Pittsburgh Penguins |
| Shoots | Left | Current Contract | 2 years ($8.7M CapHit) |
| Height | 5'11" | Expires | 2026-27 |
| Weight (lbs) | 200 | Expiry Age (Jun 30) | 39 |
| Age (DOB) | 38 (Aug 7, 1987) | Expiry Status | UFA |
| Drafted | 2005, Round 1, Overall 1 (PIT) |
| Date | Team | Transaction | |
|---|---|---|---|
| Mar 18, 2026 | Pittsburgh Penguins | Activated from IR | |
| Feb 25, 2026 | Pittsburgh Penguins | Placed on IR | |
| Sep 16, 2024 | Pittsburgh Penguins | Signed 2 years @ $8.700M AAV starting in 2025-26 | |
| Jul 1, 2012 | Pittsburgh Penguins | Signed 12 years @ $8.700M AAV starting in 2013-14 | |
| Jul 7, 2007 | Pittsburgh Penguins | Signed 5 years @ $8.700M AAV starting in 2008-9 | |
| Sep 9, 2005 | Pittsburgh Penguins | Signed to an entry level contract. |
Player Card(s)
URL: https://thestanleycap.com/cdn/player_cards/20252026/sidney-crosby-8471675.png
URL: https://thestanleycap.com/cdn/player_cards/20242025/sidney-crosby-8471675.png
URL: https://thestanleycap.com/cdn/player_cards/20232024/sidney-crosby-8471675.png
About Player Cards
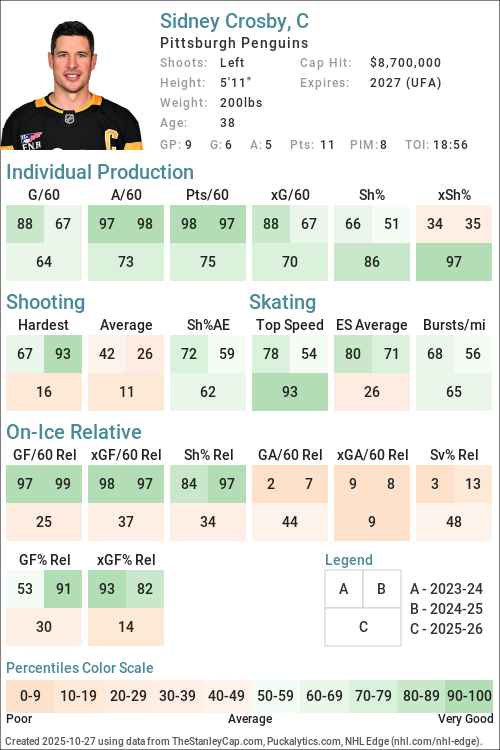
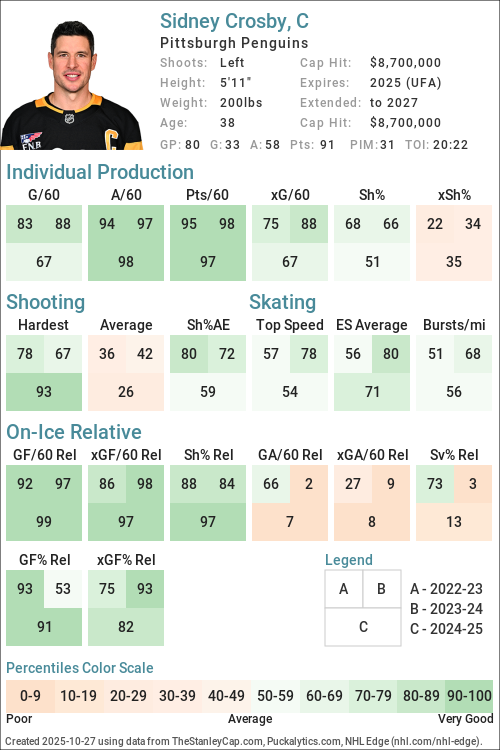
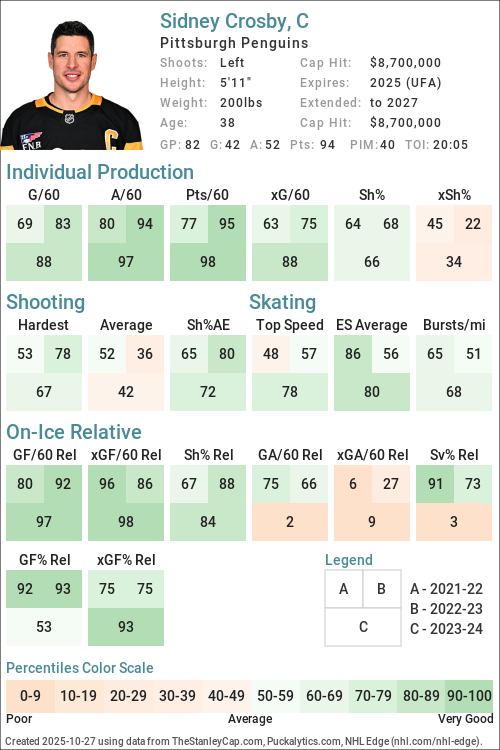
Player cards present an infographic of a players performance using a series of Player Archetypes developed for Puckalytics.com and TheStanleyCap.com. The boxes in the rink image show the archetype ratings for the season specified in the card while the graphs to the right show the five-year trends for those archetypes.
Except for Faceoffs, the values shown are the players z-score (standard deviation from the mean) for the specific metric used to calculate the archetype values. When calculating z-scores forwards were compared to forwards and defensemen were compared to defensemen. Positive values indicate the player is above average and shaded in blue, while negative values indicate the player is below average and shaded in pink. The five year trend charts show a range of -4.0 to 4.0.
The value shown for Faceoffs is the faceoff winning percentage rather than their z-score with winning percentages below 50 in pink shades and above 50 in blue shades.
All archetypes are 5v5 except 5v4 TOI, 4v5 TOI, Skating (even strength) and Faceoffs (all situations). Archetypes use regular season data only.
Archetypes Summary
- Sniper - Measures the to score above the expected goal rate.
- Rebound - Measures the percent of a players shot attempts that come from rebounds (forwards only).
- 5v4 TOI - Powerplay ice time, calculated as the percentage of his teams 5v4 ice time that the player was on the ice for.
- Shooter - Measures whether a players points come from shots (goals or assists on rebounds from his shots).
- Producer - Measures a players ability to produce goals and assists, adjusted for quality of teammates.
- Playmaker - Measures whether a players points come from passes.
- Drive - Measures a players ability to drive puck possession and generate shot attempts for his team.
- Rush - Measures the percent of a players shot attempts that come from rush plays
- Possession - An indicator of a players ability to improve his teams puck possession game.
- Faceoffs - Faceoff Winning Percentage (min. 75 faceoffs taken).
- 5v5 TOI - The percentage of his teams 5v5 TOI that the player was on the ice for.
- Suppress - Measures a players ability to suppress opponent puck possession and shot attempts against.
- Skating - An indicator of a players skating ability, or speed bursts above 20mph per mile skated.
- Defend - An indicator of a players ability to suppress shot quality against.
- 4v5 TOI - Penalty Kill ice time, calculated as the percentage of his teams 4v5 ice time that the player was on the ice for.
Data Sources
- Salary data is from TheStanleyCap.com
- Skating data is from NHL Edge
- Other statistics are from Puckalytics.com and derived from data from NHL.com
Terms of Use
You are free to use include player cards in written articles, share on social media, or on other public websites under the following conditions:
- You credit TheStanleyCap.com as the source and provide a link back to TheStanleyCap.com or this player page.
- You do not mass copy/duplicate/publish dozens or hundreds of player cards. A few, or a handful for a written article is fine. Be reasonable. Fair use rules apply.
- If you are a high-traffic website you must download and host the image(s) on your site rather than overload TheStanleyCap servers with traffic.
Note: Player cards will update daily throughout the season so if you want to include snapshot then you must download the image.
If you have any questions, send an e-mail to the e-mail address at the top of this page.
Read Introducing Player Archetypes on HockeyAnalysis.com for more details on archetype calculations.
Core Archetypes
| Season | Team(s) | GP | TOI | Producer | Playmaker | Shooter | Sniper | Rebound | Rush | Skating | Defend |
|---|---|---|---|---|---|---|---|---|---|---|---|
| 2015-16 | PIT | 80 | 2.66 | 2.60 | 0.74 | 0.70 | -0.43 | 0.67 | - | -0.58 | |
| 2016-17 | PIT | 75 | 2.66 | 0.11 | 3.31 | 1.63 | 1.07 | -0.60 | - | -0.38 | |
| 2017-18 | PIT | 82 | 0.17 | 0.94 | -0.74 | -1.21 | 0.39 | 1.60 | - | 0.14 | |
| 2018-19 | PIT | 79 | 2.11 | 2.71 | -0.03 | 0.23 | 1.03 | 0.73 | - | -0.37 | |
| 2019-20 | PIT | 41 | 2.70 | 2.81 | 0.57 | 0.53 | -0.03 | 0.11 | - | -0.62 | |
| 2020-21 | PIT | 55 | 0.31 | -0.01 | 0.18 | 0.06 | -0.58 | -0.43 | - | 0.30 | |
| 2021-22 | PIT | 69 | 0.63 | 0.83 | -0.03 | 0.27 | -0.23 | 0.51 | 0.21 | 1.38 | |
| 2022-23 | PIT | 82 | 2.27 | 1.24 | 1.34 | 0.99 | 1.44 | 1.57 | -0.17 | 0.67 | |
| 2023-24 | PIT | 82 | 2.00 | 1.76 | 0.76 | 0.49 | -0.40 | 0.13 | 0.35 | -1.79 | |
| 2024-25 | PIT | 80 | 2.18 | 2.84 | 0.01 | -0.00 | 0.80 | -0.73 | -0.00 | -1.09 | |
| 2025-26 | PIT | 68 | 1.67 | 1.44 | 0.62 | 1.49 | 0.59 | 1.30 | 0.19 | -0.62 |
Situational and Secondary Archetypes
| Season | Team(s) | GP | TOI | 5v5 TOI | 5v4 TOI | 4v5 TOI | Possession | Drive | Suppress | Faceoffs |
|---|---|---|---|---|---|---|---|---|---|---|
| 2015-16 | PIT | 80 | 1.76 | 1.61 | -1.36 | 0.60 | 1.05 | -0.40 | 51.7 | |
| 2016-17 | PIT | 75 | 1.50 | 1.68 | -1.85 | 1.13 | 2.04 | -0.68 | 48.2 | |
| 2017-18 | PIT | 82 | 1.85 | 1.68 | -1.68 | 1.88 | 2.02 | 0.67 | 53.0 | |
| 2018-19 | PIT | 79 | 1.79 | 1.57 | -1.11 | 2.17 | 1.91 | 1.02 | 55.4 | |
| 2019-20 | PIT | 41 | 1.52 | 1.53 | -1.48 | 0.88 | 1.98 | -1.27 | 55.6 | |
| 2020-21 | PIT | 55 | 2.06 | 1.47 | -1.94 | 0.56 | 1.02 | -0.39 | 53.6 | |
| 2021-22 | PIT | 69 | 1.59 | 1.46 | -1.87 | 0.45 | 1.57 | -1.46 | 52.4 | |
| 2022-23 | PIT | 82 | 1.75 | 1.27 | -1.87 | 0.57 | 1.34 | -0.84 | 53.0 | |
| 2023-24 | PIT | 82 | 1.64 | 1.20 | -1.91 | 1.27 | 2.34 | -1.09 | 58.2 | |
| 2024-25 | PIT | 80 | 1.89 | 1.21 | -2.03 | 0.84 | 1.73 | -1.10 | 57.0 | |
| 2025-26 | PIT | 68 | 1.32 | 1.25 | -1.94 | 0.13 | 0.59 | -0.59 | 55.2 |
5v5 Individual Stats
| Season | Team(s) | GP | TOI | G/60 | A/60 | Pts/60 | xG/60 | GAE/60 | Sh% | xSh% | Sh%AE | %SA Rush | %SA Reb. |
|---|---|---|---|---|---|---|---|---|---|---|---|---|---|
| 2015-16 | PIT | 80 | 1192:45 | 0.91 | 1.66 | 2.57 | 0.74 | 0.16 | 11.46 | 9.41 | 2.06 | 5.36 | 4.02 |
| 2016-17 | PIT | 75 | 1101:16 | 1.42 | 1.25 | 2.67 | 0.89 | 0.53 | 15.20 | 9.56 | 5.64 | 2.79 | 7.44 |
| 2017-18 | PIT | 82 | 1231:00 | 0.49 | 1.12 | 1.61 | 0.82 | -0.33 | 6.14 | 10.26 | -4.12 | 7.14 | 5.80 |
| 2018-19 | PIT | 79 | 1224:18 | 0.83 | 2.01 | 2.84 | 0.79 | 0.05 | 11.56 | 10.93 | 0.64 | 5.58 | 7.61 |
| 2019-20 | PIT | 41 | 609:43 | 0.89 | 1.77 | 2.66 | 0.75 | 0.13 | 11.69 | 9.91 | 1.78 | 4.08 | 6.12 |
| 2020-21 | PIT | 55 | 874:09 | 0.76 | 1.10 | 1.85 | 0.73 | 0.03 | 10.28 | 9.91 | 0.37 | 2.80 | 4.20 |
| 2021-22 | PIT | 69 | 1036:12 | 0.87 | 1.27 | 2.14 | 0.80 | 0.07 | 11.19 | 10.27 | 0.92 | 5.03 | 5.59 |
| 2022-23 | PIT | 82 | 1224:02 | 1.08 | 1.62 | 2.70 | 0.81 | 0.27 | 12.22 | 9.17 | 3.05 | 6.91 | 11.79 |
| 2023-24 | PIT | 82 | 1239:42 | 1.06 | 1.65 | 2.71 | 0.89 | 0.18 | 11.58 | 9.66 | 1.92 | 4.15 | 6.79 |
| 2024-25 | PIT | 80 | 1250:12 | 0.77 | 1.87 | 2.64 | 0.78 | -0.01 | 10.67 | 10.80 | -0.13 | 1.32 | 9.65 |
| 2025-26 | PIT | 68 | 998:53 | 0.96 | 1.56 | 2.52 | 0.64 | 0.32 | 16.33 | 10.87 | 5.45 | 4.67 | 10.00 |
5v5 On Ice Stats
| Season | Team(s) | GP | TOI | SAF/60 | GF/60 | xGF/60 | SAA/60 | GA/60 | xGA/60 | GF% | xGF% | xGF Rel | xGA Rel | xGF% Rel |
|---|---|---|---|---|---|---|---|---|---|---|---|---|---|---|
| 2015-16 | PIT | 80 | 1192:45 | 47.19 | 3.12 | 2.74 | 39.24 | 2.16 | 2.22 | 59.05 | 55.28 | 0.27 | 0.27 | -0.64 |
| 2016-17 | PIT | 75 | 1101:16 | 50.67 | 3.32 | 3.36 | 42.77 | 2.40 | 2.53 | 58.10 | 57.10 | 0.86 | 0.20 | 5.22 |
| 2017-18 | PIT | 82 | 1231:00 | 52.20 | 2.24 | 3.04 | 39.09 | 2.53 | 2.33 | 46.94 | 56.64 | 0.58 | -0.02 | 5.44 |
| 2018-19 | PIT | 79 | 1224:18 | 49.69 | 3.87 | 3.01 | 41.66 | 2.06 | 2.40 | 65.29 | 55.67 | 0.45 | -0.22 | 6.21 |
| 2019-20 | PIT | 41 | 609:43 | 48.12 | 2.95 | 2.98 | 42.41 | 2.95 | 2.79 | 50.00 | 51.67 | 0.84 | 0.66 | 1.58 |
| 2020-21 | PIT | 55 | 874:09 | 42.01 | 2.75 | 2.49 | 38.92 | 2.06 | 2.34 | 57.14 | 51.61 | 0.35 | 0.02 | 3.55 |
| 2021-22 | PIT | 69 | 1036:12 | 50.78 | 3.13 | 3.37 | 43.54 | 2.03 | 2.73 | 60.67 | 55.29 | 0.88 | 0.42 | 3.29 |
| 2022-23 | PIT | 82 | 1224:02 | 51.03 | 3.28 | 3.30 | 44.75 | 2.50 | 2.81 | 56.78 | 53.97 | 0.43 | 0.16 | 2.06 |
| 2023-24 | PIT | 82 | 1239:42 | 53.92 | 3.63 | 3.40 | 46.41 | 3.53 | 2.88 | 50.68 | 54.13 | 1.03 | 0.42 | 5.12 |
| 2024-25 | PIT | 80 | 1250:12 | 47.32 | 3.46 | 3.04 | 44.73 | 3.36 | 2.83 | 50.70 | 51.84 | 0.86 | 0.36 | 4.89 |
| 2025-26 | PIT | 68 | 998:53 | 43.97 | 3.42 | 2.88 | 41.39 | 2.76 | 2.78 | 55.34 | 50.85 | 0.09 | 0.32 | -2.31 |
NHL Edge Stats
| Skating | Shooting | Zone Time | |||||||||||
|---|---|---|---|---|---|---|---|---|---|---|---|---|---|
| Season | GP | Top Speed | Bursts>20/mi | Avg. Speed | Top Speed | Avg. Speed | %Long Range | %Mid Range | %High Danger | ES DZ% | ES NZ% | ES OZ% | |
| This table is for Basic and Premium subscribers only. To view please login to and/or subscribe to one of our subscription plans. | |||||||||||||
Legend
| Percentile 0-25 | Percentile 25-50 | Percentile 50-75 | Percentile 75-100 |
5v5 Lines
| Season | Teammate | Teammate | Team | TOI | GF/60 | GA/60 | GF% | xGF/60 | xGA/60 | xGF% | xGF Rel | xGA Rel | xGF% Rel |
|---|
Glossary
| Type | Statistic | Definition |
|---|---|---|
| Individual | G/60 | Goals Against per 60 minutes. |
| Individual | A/60 | Assists per 60 minutes. |
| Individual | Pts/60 | Points per 60 minutes. |
| Individual | xG/60 | Expected Goals per 60 minutes. |
| Individual | GAE/60 | Goals Above Expected (G/60 - xG/60). |
| Individual | Sh% | Shooting Percentage. |
| Individual | xSh% | Expected Shooting Percentage. |
| Individual | Sh%AE | Shooting percentage above expected (Sh% - xSh%). |
| Individual | %SA Rush | Percentage of shot attempts determined to be on the rush. |
| Individual | %SA Reb. | Percentage of shot attempts determined to be from rebounds. |
| On Ice | SAF/60 | Shot Attempts For per 60 minutes. |
| On Ice | GF/60 | Goals For per 60 minutes. |
| On Ice | xGF/60 | Expected Goals For per 60 minutes. |
| On Ice | SAA/60 | Shot Attempts Against per 60 minutes (lower is better). |
| On Ice | GA/60 | Goals Against per 60 minutes (lower is better). |
| On Ice | xGA/60 | Expected Goals Against per 60 minutes (lower is better). |
| On Ice | GF% | Goals For Percentage = Goals For / (Goals For + Goals Against) |
| On Ice | xGF% | Expected Goals For Percentage = Expected Goals For / (Expected Goals For + Expected Goals Against) |
| On Ice | xGF Rel | xGF/60 when On Ice - xGF/60 when not On Ice. |
| On Ice | xGA Rel | xGA/60 when On Ice - xGA/60 when not On Ice (lower is better). |
| On Ice | xGF% Rel | xGF% when On Ice - xGF% when not On Ice. |
News and Opinions
-
Best NHL Players by Age in 2026-27 at The Hockey Writers (Wed Jul 22, 2026)
-
Penguins Should Target Elias Pettersson in Canucks Trade at The Hockey Writers (Wed Jul 22, 2026)
-
Penguins’ 5 Reasons for Optimism Entering 2026-27 at The Hockey Writers (Tue Jul 21, 2026)
-
From The Archive: EMPEROR PENGUIN at Yahoo Sports NHL (Mon Jul 20, 2026)
-
Sidney Crosby and Brad Marchand celebrated the Toronto Marlies' Calder Cup win at Editor in Leaf (Mon Jul 20, 2026)
-
10 Must-Watch Canucks Games in 2026-27 at The Hockey Writers (Sun Jul 19, 2026)
-
Penguins’ 5 Can’t-Miss Games on 2026-27 Schedule at The Hockey Writers (Fri Jul 17, 2026)
-
From The Archive: GREATNESS IN THE SHADOW at Yahoo Sports NHL (Thu Jul 16, 2026)
-
From The Archive: PEN DEMIC at Yahoo Sports NHL (Wed Jul 15, 2026)
-
Penguins’ 3 Best Contracts Entering 2026-27 at The Hockey Writers (Tue Jul 14, 2026)
-
Penguins’ Metro Gap Shows Dubas’ Work Is Not Done at The Hockey Writers (Mon Jul 13, 2026)
-
Penguins’ Trade Board Shows Dubas Needs Bigger Swing at The Hockey Writers (Thu Jul 9, 2026)
-
2025-26 Season in Review: Sidney Crosby at Pens Burgh (Fri Jun 19, 2026)
-
2025-26 Season in Review: Sidney Crosby at Yahoo Sports NHL (Fri Jun 19, 2026)
-
Ranking the Last 10 Conn Smythe Winners at The Hockey Writers (Thu Jun 18, 2026)
-
Hurricanes star Jordan Staal wins Conn Smythe Trophy as Stanley Cup playoff MVP at Yahoo Sports NHL (Mon Jun 15, 2026)
-
Ilya Protas describes getting to match up against Sidney Crosby, winning a faceoff against him: ‘I finally got the matchup, won a draw. Definitely memorable.’ at Russian Machine Never Breaks (Sat Jun 13, 2026)
-
8 times the Washington Capitals have lost in the playoffs to the eventual Stanley Cup Champions at Stars and Sticks (Sat Jun 6, 2026)
-
Connor McDavid Canadiens speculation intensifies after player agent points interest away from Sidney Crosby at Habs Fanatics (Tue Jun 2, 2026)
-
Recapping Penguins’ Performances at the 2026 World Championships at The Hockey Writers (Sun May 31, 2026)
-
Sidney Crosby’s quest for double Triple Gold at Pens Burgh (Sat May 30, 2026)
-
Celebrini Faces USA in Do-or-Die Game Again, Talks Close Relationship With Crosby at San Jose Hockey Now (Wed May 27, 2026)
-
Evgeni Malkin reste à Pittsburgh : oubliez Sidney Crosby à Montréal l’an prochain at Dans Les Coulisses (Tue May 26, 2026)
-
NHL Rumors: Devon Levi, Ilya Mikheyev, and Sidney Crosby at NHL Rumors (Sat May 23, 2026)
-
Quand Sidney Crosby s'incline devant le talent de Juraj Slafkovsky at HABSolument Fan (Sat May 23, 2026)
-
Sidney Crosby makes major decision on his NHL future with Penguins at Habs Fanatics (Fri May 22, 2026)
-
Wild's free agent backup plan may have been foiled by Sidney Crosby at Gone Puck Wild (Fri May 22, 2026)
-
Juraj Slafkovsky a impressionné Sidney Crosby hier soir at Dans Les Coulisses (Fri May 22, 2026)
-
Why Penguins' Sidney Crosby Extending His Career Will Only Strengthen His NHL Legacy at The Hockey News (Fri May 22, 2026)
-
Sid Isn't Done Yet -- And Neither Is The 2,000-Point Discussion at Yahoo Sports NHL (Fri May 22, 2026)
-
Sidney Crosby has no plans on retiring from the NHL any time soon: ‘I definitely want to keep playing for as many years as possible’ at Russian Machine Never Breaks (Thu May 21, 2026)
-
Sidney Crosby réagit aux rumeurs de retraite at HABSolument Fan (Thu May 21, 2026)
-
NHL Rumors: Crosby Extension, Babcock and Oilers, Nemec Trade? at The Hockey Writers (Thu May 21, 2026)
-
What age-39 performance could look like for Sidney Crosby at Pens Burgh (Wed May 20, 2026)
-
Porter Martone keeps turning heads for Canada at Worlds at Broad Street Hockey (Mon May 18, 2026)
-
REPORT: Crosby Pushed for Celebrini To Remain Canada Captain at San Jose Hockey Now (Sun May 17, 2026)
-
5 Moments That Defined the Penguins’ Season at The Hockey Writers (Sun May 17, 2026)
-
Flyers fan immortalizes Sidney Crosby’s first-ever playoff dive with paint outline on the ice at Xfinity Mobile Arena: ‘RIP Bozo’ at Russian Machine Never Breaks (Sat May 16, 2026)
-
Brooks Laich believes early-career Alex Ovechkin competed at a level that not even Sidney Crosby could match: ‘He had just ferocity in his eyes, and he could kill you’ at Russian Machine Never Breaks (Sat May 16, 2026)
-
On this date in Penguins history: Crosby’s OT winner in the Eastern Conference Final at Pens Burgh (Sat May 16, 2026)
-
On this date in Penguins history: Crosby’s OT winner in the Eastern Conference Final at Yahoo Sports NHL (Sat May 16, 2026)
-
World hockey championships players to watch: Matthew Tkachuk, Sidney Crosby lead at Yahoo Sports NHL (Fri May 15, 2026)
-
Lemieux, Crosby named No. 1 and 2 CHL players of all-time at Pens Burgh (Fri May 15, 2026)
-
SJHN Daily: Celebrini Remains Canada Captain, Sharks Will Have No. 20 Pick in 2026 Draft at San Jose Hockey Now (Fri May 15, 2026)
-
Lemieux, Crosby Assert CHL Glory Atop All-Time List at Yahoo Sports NHL (Fri May 15, 2026)
-
Les Penguins ont attendu trop longtemps avant de tourner la page at Dans Les Coulisses (Thu May 14, 2026)
-
Pittsburgh Penguins Rumors – Cap Space, Evgeni Malkin, and Sidney Crosby at NHL Rumors (Thu May 14, 2026)
-
You'd Think Sidney Crosby Would Be Too Old (And Too Tired) To Represent Canada At Worlds at The Hockey News (Wed May 13, 2026)
-
Boston Bruins News: Sidney Crosby, Fraser Minten, Charlie McAvoy suspension fallout at Causway Crowd (Wed May 13, 2026)
-
2025-26 Season in Review: Rickard Rakell at Pens Burgh (Wed May 13, 2026)
-
2025-26 Season in Review: Rickard Rakell at Yahoo Sports NHL (Wed May 13, 2026)
-
Crosby to join Team Canada for World Championships at Pens Burgh (Tue May 12, 2026)
-
Sidney Crosby s’en va au CDM : Le Canada a un problème entre les mains at Dans Les Coulisses (Tue May 12, 2026)
-
Analyzing The Penguins' Rebuild: Are The Penguins Close To Sustainable Contention? at Yahoo Sports NHL (Tue May 12, 2026)
-
2025-26 Season in Review: Bryan Rust at Pens Burgh (Mon May 11, 2026)
-
2025-26 Season in Review: Bryan Rust at Yahoo Sports NHL (Mon May 11, 2026)
-
Sidney Crosby in ‘wait and see’ mode for plans beyond 2026-27 at Yahoo Sports NHL (Sun May 3, 2026)
-
Sidney Crosby in ‘wait and see’ mode for plans beyond 2026-27 at Pens Burgh (Sun May 3, 2026)
-
The Penguins needed Sidney Crosby to do Sidney Crosby things against Philadelphia. The captain delivered at NBC Sports (Tue Apr 28, 2026)
-
The Penguins needed Sidney Crosby to do Sidney Crosby things against Philadelphia. The captain delivered at Yahoo Sports NHL (Tue Apr 28, 2026)
-
3 Takeaways From the Penguins’ Game 5 Win vs. Flyers at The Hockey Writers (Tue Apr 28, 2026)
-
Penguins Beat Flyers – This is Coming Back to Philly at Flyers Nitty Gritty (Tue Apr 28, 2026)
-
3 Takeaways: Behind Strong Defensive Effort, Penguins Take Game 5 Against Flyers And Climb Back Into Series at Yahoo Sports NHL (Tue Apr 28, 2026)
-
The Penguins needed Sidney Crosby to do Sidney Crosby things against Philly. The captain delivered at Yahoo Sports NHL (Tue Apr 28, 2026)
-
Sidney Crosby quitte le match après un tir violent alors que les tensions explosent à Pittsburgh at HABSolument Fan (Mon Apr 27, 2026)
-
Sidney Crosby, Penguins aim to extend season again vs. Flyers. Mammoth look for 3-1 lead on Golden Knights at Yahoo Sports NHL (Mon Apr 27, 2026)
-
Sidney Crosby, Penguins aim to extend season again vs. Flyers. Mammoth look for 3-1 lead on Golden Knights at NBC Sports (Mon Apr 27, 2026)
-
Game Preview: Philadelphia Flyers @ Pittsburgh Penguins , Round 1 Game 5, 4/27/2026 at Yahoo Sports NHL (Mon Apr 27, 2026)
-
Game Preview: Philadelphia Flyers @ Pittsburgh Penguins , Round 1 Game 5, 4/27/2026 at Pens Burgh (Mon Apr 27, 2026)
-
Flyers vs Penguins Prediction, Picks & Odds for Monday's NHL Playoffs Game 5 at Yahoo Sports NHL (Sun Apr 26, 2026)
-
Séries en bref : Ce soir, le Lightning tentera de faire comme le Wild at Dans Les Coulisses (Sun Apr 26, 2026)
-
Penguins' Sidney Crosby And Kris Letang Proved They Aren't Done Yet Vs. Flyers at The Hockey News (Sun Apr 26, 2026)
-
Crosby and Letang strike as the Penguins stave off a sweep with a 4-2 Game 4 win over Flyers at Yahoo Sports NHL (Sun Apr 26, 2026)
-
Crosby and Letang strike as the Penguins stave off a sweep with a 4-2 Game 4 win over Flyers at NBC Sports (Sun Apr 26, 2026)
-
Takeaways: Flyers suffer 4-2 loss to Penguins in Game 4 during sweep opportunity at Broad Street Hockey (Sun Apr 26, 2026)
-
Penguins/Flyers Game 4 Recap: Not done yet, Crosby helps Pens win, extend season at Yahoo Sports NHL (Sun Apr 26, 2026)
-
Crosby and Letang strike as the Penguins stave off a sweep with a 4-2 Game 4 win over Flyers at Yahoo Sports NHL (Sun Apr 26, 2026)
-
Sidney Crosby pushes back on embellishment call in Game 3 against Flyers: ‘I don’t know what else you want me to tell you’ at Russian Machine Never Breaks (Fri Apr 24, 2026)
-
Sidney Crosby on his embellishment call: Flyers player 'got away with it' at Yahoo Sports NHL (Fri Apr 24, 2026)
-
Owen Tippett trolls Sidney Crosby with ‘Crosby sucks’ message on signed puck at Broad Street Hockey (Fri Apr 24, 2026)
-
Daily Bean: Bruins Gameday, Sweezey Extended; Crosby Embellishment, Johnston 2OT Winner at Boston Hockey Now (Thu Apr 23, 2026)
-
Takeaways: Penguins' Strong Start Goes Sideways As Flyers Take Commanding 3-0 Series Lead at Yahoo Sports NHL (Thu Apr 23, 2026)
-
The real difference between Sidney Crosby and Sean Couturier is impossible to ignore at Broad Street Buzz (Thu Apr 23, 2026)
-
SÉRIES 2026: Sidney Crosby et les Pens déjà au bord du précipice at HABSolument Fan (Thu Apr 23, 2026)
-
Flyers Beat Penguins in Game 3 – One Win Away at Flyers Nitty Gritty (Thu Apr 23, 2026)
-
Takeaways: Flyers win Game 3 against Penguins in feisty 5-2 win at home at Broad Street Hockey (Thu Apr 23, 2026)
-
Sidney Crosby gets called for diving for the first time in his career, which is honestly shocking at Russian Machine Never Breaks (Wed Apr 22, 2026)
-
Did Sidney Crosby embellish reaction to high stick? Referees say yes. at Yahoo Sports NHL (Wed Apr 22, 2026)
-
Pens' Crosby: 'Urgency is heightened' down 0-2 at ESPN (Wed Apr 22, 2026)
-
Pens' Crosby: 'Urgency is heightened' down 2-0 at ESPN (Wed Apr 22, 2026)
-
Sidney Crosby fumes over controversial call after Flyers’ Game 3 win at Broad Street Hockey (Wed Apr 22, 2026)
-
Flyers desperately need Travis Sanheim to do it again in Game 2 at Broad Street Hockey (Mon Apr 20, 2026)
-
Stanley Cup Playoffs Flyers Take Game 1 in Pittsburgh at Flyers Nitty Gritty (Sun Apr 19, 2026)
-
Takeaways: Flyers snatch Game 1 in gutsy 3-2 win over Penguins at Broad Street Hockey (Sun Apr 19, 2026)
-
Sidney Crosby Led His Pittsburgh Penguins Back to the Stanley Cup Playoffs at NHL Rumors (Sat Apr 18, 2026)
-
Flyers Penguins Series Preview – From The Heart at Flyers Nitty Gritty (Sat Apr 18, 2026)
-
Strengths and Weaknesses: How the Flyers can Win and Lose the Series vs. the Penguins at Philly Hockey Now (Fri Apr 17, 2026)
-
'This Is What You Play For': Penguins Thrilled To Be Back In Playoff Picture, Confident About Identity at Yahoo Sports NHL (Fri Apr 17, 2026)
-
Sidney Crosby envious of Alex Ovechkin’s voracious diet: ‘I wish I could do that’ at Russian Machine Never Breaks (Thu Apr 16, 2026)
-
Sidney Crosby and the Pittsburgh Penguins have surprised everyone but themselves with playoff return at Yahoo Sports NHL (Thu Apr 16, 2026)
-
Flyers vs. Penguins: Breaking down the forward matchup ahead of the playoffs at Broad Street Hockey (Thu Apr 16, 2026)
-
3 bold predictions for Flyers vs. Penguins playoff series at Broad Street Hockey (Wed Apr 15, 2026)
-
Remembering some Penguins vs. Flyers playoff moments at Pens Burgh (Wed Apr 15, 2026)
-
Game Preview: Pittsburgh Penguins @ St. Louis Blues, 4/14/2026 at Pens Burgh (Tue Apr 14, 2026)
-
The 100th Meeting Between Ovi and Sid Isn't the Last at Stars and Sticks (Mon Apr 13, 2026)
-
The 5 Biggest Moments From the Historic Crosby/Ovechkin Rivalry at The Hockey Writers (Mon Apr 13, 2026)
-
Daily Bean: Bruins Win, Crosby vs. Ovechkin x100, Islanders Eliminated at Boston Hockey Now (Mon Apr 13, 2026)
-
21 Years, 21 Stats: Factoids From The Crosby-Ovechkin Rivalry at Yahoo Sports NHL (Sun Apr 12, 2026)
-
Ovi lauds Penguins but waves off farewell shakes at ESPN (Sun Apr 12, 2026)
-
Alex Ovechkin and Sidney Crosby take opening faceoff in potential final matchup at Russian Machine Never Breaks (Sun Apr 12, 2026)
-
Alex Ovechkin poses for legendary photo with Sidney Crosby, Evgeni Malkin, and Kris Letang before potential final game against Penguins at Russian Machine Never Breaks (Sun Apr 12, 2026)
-
Sidney Crosby, Alex Ovechkin set for 100th meeting in what could be final showdown against each other at Russian Machine Never Breaks (Sun Apr 12, 2026)
-
Penguins sit stars Crosby, Malkin vs. Ovi, Capitals at ESPN (Sat Apr 11, 2026)
-
Sidney Crosby, Evgeni Malkin, and Kris Letang all being held out of Saturday’s game against Capitals after Penguins clinched playoff spot at Russian Machine Never Breaks (Sat Apr 11, 2026)
-
Penguins sit stars Sidney Crosby and Evgeni Malkin ahead of visit by Alex Ovechkin and the Capitals at Yahoo Sports NHL (Sat Apr 11, 2026)
-
Game Preview: Washington Capitals @ Pittsburgh Penguins, 4/11/2026 at Pens Burgh (Sat Apr 11, 2026)
-
Game Preview: Washington Capitals @ Pittsburgh Penguins, 4/11/2026 at Yahoo Sports NHL (Sat Apr 11, 2026)
-
Takeaways: Penguins Take Care Of Business, Clinch Playoff Berth With 5-2 Win Over New Jersey Devils at Yahoo Sports NHL (Fri Apr 10, 2026)
-
Alex Ovechkin reflects on rivalry with Sidney Crosby ahead of potential last matchup: ‘It’s history, what we have for 20 years’ at Russian Machine Never Breaks (Fri Apr 10, 2026)
-
Capitals' Alex Ovechkin Looks Back At Rivalry With Sidney Crosby: 'It's History' at The Hockey News (Fri Apr 10, 2026)
-
Malkin, Crosby and Letang help the Penguins beat the Devils to clinch a playoff spot at Yahoo Sports NHL (Thu Apr 9, 2026)
-
Sid and Ovi through the years: A look at the Crosby-Ovechkin rivalry as its final acts loom at Yahoo Sports NHL (Thu Apr 9, 2026)
-
Revisiting the ‘playoffs or finish in last place’ preseason thought exercise with the Penguins at Yahoo Sports NHL (Wed Apr 8, 2026)
-
Revisiting the ‘playoffs or finish in last place’ preseason thought exercise with the Penguins at Pens Burgh (Wed Apr 8, 2026)
-
The NHL’s Over-35 Team for 2025-26 at The Hockey Writers (Mon Apr 6, 2026)
-
Top-5 : Les Flyers dans les séries ce matin at Dans Les Coulisses (Mon Apr 6, 2026)
-
Takeaways: Penguins Pounce Panthers To Sweep Weekend Back-To-Back at Yahoo Sports NHL (Mon Apr 6, 2026)
-
Penguins' Sidney Crosby, Evgeni Malkin Continue To Rewrite NHL History With Dominant Weekend at The Hockey News (Sun Apr 5, 2026)
-
NHL Notebook: Islanders fire Patrick Roy, hire Pete DeBoer at Flames Nation (Sun Apr 5, 2026)
-
Top-5 : les Kings narguent solidement les Leafs sur les réseaux sociaux at Dans Les Coulisses (Sun Apr 5, 2026)
-
Takeaways: Malkin's Hat Trick, Milestones Lead Penguins' Offensive Explosion In 9-4 Over Panthers at Yahoo Sports NHL (Sat Apr 4, 2026)
-
Sidney Crosby Surpasses Steve Yzerman, Climbs NHL All-Time Scoring List at Yahoo Sports NHL (Sat Apr 4, 2026)
-
Game Preview: Pittsburgh Penguins @ Tampa Bay Lightning 4/2/2026 at Pens Burgh (Thu Apr 2, 2026)
-
Game Preview: Pittsburgh Penguins @ Tampa Bay Lightning 4/2/2026 at Yahoo Sports NHL (Thu Apr 2, 2026)
-
Anthony Mantha’s Resurgence Is Fueling Penguins’ Playoff Push at The Hockey Writers (Wed Apr 1, 2026)
-
Macklin Celebrini's 100-Point Season Only Strengthens Sidney Crosby Comparisons at The Hockey News (Tue Mar 31, 2026)
-
Top-5 : Max Domi règle le cas de Radko Gudas at Dans Les Coulisses (Tue Mar 31, 2026)
-
Game Preview: Detroit Red Wings @ Pittsburgh Penguins 3/31/2026 at Yahoo Sports NHL (Tue Mar 31, 2026)
-
Takeaways: Penguins Stomp Islanders In Dominant Effort For Biggest Win Of The Season at Yahoo Sports NHL (Tue Mar 31, 2026)
-
Crosby Climbs Two All-Time Lists In Big Win Over Islanders at Yahoo Sports NHL (Tue Mar 31, 2026)
-
Penguins/Islanders Recap: Pens chase Sorokin, demolish Islanders 8-3 at Pens Burgh (Mon Mar 30, 2026)
-
Penguins/Islanders Recap: Pens chase Sorokin, demolish Islanders 8-3 at Yahoo Sports NHL (Mon Mar 30, 2026)
-
Crosby back from injury as Penguins visit Isles at ESPN (Mon Mar 30, 2026)
-
Penguins captain Sidney Crosby returns from brief injury absence in time to face the Islanders at Yahoo Sports NHL (Mon Mar 30, 2026)
-
Crosby's Status Up-In-The-Air For Biggest Game Of Season Against New York Islanders at Yahoo Sports NHL (Mon Mar 30, 2026)
-
Sidney Crosby and Evgeni Malkin return to practice ahead of pivotal game vs. Islanders at Yahoo Sports NHL (Mon Mar 30, 2026)
-
Sidney Crosby and Evgeni Malkin return to practice ahead of pivotal game vs. Islanders at Pens Burgh (Mon Mar 30, 2026)
-
Game Preview: Pittsburgh Penguins @ NY Islanders 3/30/2026 at Yahoo Sports NHL (Mon Mar 30, 2026)
-
Penguins Notebook: Crosby, Malkin Return To Practice Ahead Of Monday's Massive Game On Long Island at Yahoo Sports NHL (Sun Mar 29, 2026)
-
Takeaways: Penalties Costly As Penguins Lose Key Game In Regulation To Dallas Stars at Yahoo Sports NHL (Sun Mar 29, 2026)
Current Contract
Sidney Crosby signed a $17,400,000 2-year contract with the Pittsburgh Penguins and General Manager Kyle Dubas on September 16, 2024 with an AAV of $8,700,000. This contract will start in 2025-26 and end after the 2026-27 season. In the first season of the contract the cap hit was equivalent to 9.11% of the salary cap.
35+ Contract ( ) (0 ratings)
Sidney Crosby signed a $104,400,000 12-year contract with the Pittsburgh Penguins and General Manager Ray Shero on July 1, 2012 with an AAV of $8,700,000. This contract will start in 2013-14 and end after the 2024-25 season. In the first season of the contract the cap hit was equivalent to 13.53% of the salary cap.
Standard Contract (UFA) ( ) (0 ratings)
| Season | Age* | Clause | Cap Hit | AAV | Perf. Bonus | Sign. Bonus | Salary | Compensation | Minors Salary | Status | |
|---|---|---|---|---|---|---|---|---|---|---|---|
| 2013-14 | 26 | NMC | $8,700,000 | $8,700,000 | - | - | $12,000,000 | $12,000,000 | $12,000,000 | UFA | |
| 2014-15 | 27 | NMC | $8,700,000 | $8,700,000 | - | - | $12,000,000 | $12,000,000 | $12,000,000 | UFA | |
| 2015-16 | 28 | NMC | $8,700,000 | $8,700,000 | - | - | $12,000,000 | $12,000,000 | $12,000,000 | UFA | |
| 2016-17 | 29 | NMC | $8,700,000 | $8,700,000 | - | - | $10,900,000 | $10,900,000 | $10,900,000 | UFA | |
| 2017-18 | 30 | NMC | $8,700,000 | $8,700,000 | - | - | $10,900,000 | $10,900,000 | $10,900,000 | UFA | |
| 2018-19 | 31 | NMC | $8,700,000 | $8,700,000 | - | - | $10,000,000 | $10,000,000 | $10,000,000 | UFA | |
| 2019-20 | 32 | NMC | $8,700,000 | $8,700,000 | - | - | $9,000,000 | $9,000,000 | $9,000,000 | UFA | |
| 2020-21 | 33 | NMC | $8,700,000 | $8,700,000 | - | - | $9,600,000 | $9,600,000 | $9,600,000 | UFA | |
| 2021-22 | 34 | NMC | $8,700,000 | $8,700,000 | - | - | $9,000,000 | $9,000,000 | $9,000,000 | UFA | |
| 2022-23 | 35 | NMC | $8,700,000 | $8,700,000 | - | - | $3,000,000 | $3,000,000 | $3,000,000 | UFA | |
| 2023-24 | 36 | NMC | $8,700,000 | $8,700,000 | - | - | $3,000,000 | $3,000,000 | $3,000,000 | UFA | |
| 2024-25 | 37 | NMC | $8,700,000 | $8,700,000 | - | - | $3,000,000 | $3,000,000 | $3,000,000 | UFA | |
| Total | - | - | $104,400,000 | $104,400,000 | $104,400,000 |
Sidney Crosby signed a $43,500,000 5-year contract with the Pittsburgh Penguins and General Manager Ray Shero on July 7, 2007 with an AAV of $8,700,000. This contract will start in 2008-09 and end after the 2012-13 season. In the first season of the contract the cap hit was equivalent to 15.34% of the salary cap.
Standard Contract (RFA) ( ) (0 ratings)
| Season | Age* | Clause | Cap Hit | AAV | Perf. Bonus | Sign. Bonus | Salary | Compensation | Minors Salary | Status | |
|---|---|---|---|---|---|---|---|---|---|---|---|
| 2008-09 | 21 | $8,700,000 | $8,700,000 | - | - | $9,000,000 | $9,000,000 | $9,000,000 | RFA | ||
| 2009-10 | 22 | $8,700,000 | $8,700,000 | - | - | $9,000,000 | $9,000,000 | $9,000,000 | RFA-arb | ||
| 2010-11 | 23 | $8,700,000 | $8,700,000 | - | - | $9,000,000 | $9,000,000 | $9,000,000 | RFA-arb | ||
| 2011-12 | 24 | $8,700,000 | $8,700,000 | - | - | $9,000,000 | $9,000,000 | $9,000,000 | RFA-arb | ||
| 2012-13 | 25 | NMC | $8,700,000 | $8,700,000 | - | - | $7,500,000 | $7,500,000 | $7,500,000 | UFA | |
| Total | - | - | $43,500,000 | $43,500,000 | $43,500,000 |
Sidney Crosby signed a $2,550,000 3-year contract with the Pittsburgh Penguins and General Manager Craig Patrick on September 9, 2005 with an AAV of $850,000. This contract will start in 2005-06 and end after the 2007-08 season. In the first season of the contract the cap hit was equivalent to 2.18% of the salary cap.
Entry Level Contract ( ) (0 ratings)
| Season | Age* | Clause | Cap Hit | AAV | Perf. Bonus | Sign. Bonus | Salary | Compensation | Minors Salary | Status | |
|---|---|---|---|---|---|---|---|---|---|---|---|
| 2005-06 | 18 | $850,000 | $3,700,000 | $2,850,000 | $85,000 | $765,000 | $850,000 | $62,500 | ELC | ||
| 2006-07 | 19 | $850,000 | $3,700,000 | $2,850,000 | $85,000 | $765,000 | $850,000 | $62,500 | ELC | ||
| 2007-08 | 20 | $850,000 | $3,700,000 | $2,850,000 | $85,000 | $765,000 | $850,000 | $62,500 | ELC | ||
| Total | $8,550,000 | $255,000 | $2,295,000 | $2,550,000 | $187,500 |
Career Statistics
| Regular Season | Playoffs | |||||||||||||||||||
|---|---|---|---|---|---|---|---|---|---|---|---|---|---|---|---|---|---|---|---|---|
| Season | League | Team | GP | G | A | Pts | +/- | PIM | Shots | Sh% | TOI/G | GP | G | A | Pts | +/- | PIM | Shots | Sh% | TOI/G |
| 2001-02 | NSMHL | Dartmouth | 74 | 95 | 98 | 193 | 114 | |||||||||||||
| 2001-02 | NSU18MHL | Dartmouth Subways | 7 | 11 | 13 | 24 | ||||||||||||||
| 2002-03 | High-MN | Shat.-St. Mary's | 57 | 72 | 90 | 162 | ||||||||||||||
| 2003-04 | WJC-A | Canada | 6 | 2 | 3 | 5 | 4 | |||||||||||||
| 2003-04 | QMJHL | Rimouski | 59 | 54 | 81 | 135 | 74 | 9 | 7 | 9 | 16 | 10 | ||||||||
| 2004-05 | WJC-A | Canada | 6 | 6 | 3 | 9 | 4 | |||||||||||||
| 2004-05 | QMJHL | Rimouski | 62 | 66 | 102 | 168 | 84 | 13 | 14 | 17 | 31 | 16 | ||||||||
| 2004-05 | M-Cup | Rimouski | 5 | 6 | 5 | 11 | 6 | 5 | 6 | 5 | 11 | 6 | ||||||||
| 2005-06 | NHL | Pittsburgh Penguins | 81 | 39 | 63 | 102 | -1 | 110 | 278 | 14.0 | 20:08 | |||||||||
| 2005-06 | WC-A | Canada | 9 | 8 | 8 | 16 | 10 | |||||||||||||
| 2006-07 | NHL | Pittsburgh Penguins | 79 | 36 | 84 | 120 | +10 | 60 | 250 | 14.4 | 20:46 | 5 | 3 | 2 | 5 | 4 | 20 | 15.0 | 21:40 | |
| 2007-08 | NHL | Pittsburgh Penguins | 53 | 24 | 48 | 72 | +18 | 39 | 173 | 13.9 | 20:51 | 20 | 6 | 21 | 27 | +7 | 12 | 59 | 10.2 | 20:42 |
| 2008-09 | NHL | Pittsburgh Penguins | 77 | 33 | 70 | 103 | +3 | 76 | 238 | 13.9 | 21:57 | 24 | 15 | 16 | 31 | +9 | 14 | 79 | 19.0 | 20:49 |
| 2009-10 | Olympics | Canada | 7 | 4 | 3 | 7 | 4 | |||||||||||||
| 2009-10 | NHL | Pittsburgh Penguins | 81 | 51 | 58 | 109 | +15 | 71 | 298 | 17.1 | 21:57 | 13 | 6 | 13 | 19 | +6 | 6 | 41 | 14.6 | 23:32 |
| 2010-11 | NHL | Pittsburgh Penguins | 41 | 32 | 34 | 66 | +20 | 31 | 161 | 19.9 | 21:55 | |||||||||
| 2011-12 | NHL | Pittsburgh Penguins | 22 | 8 | 29 | 37 | +15 | 14 | 75 | 10.7 | 18:28 | 6 | 3 | 5 | 8 | -3 | 9 | 13 | 23.1 | 20:37 |
| 2012-13 | NHL | Pittsburgh Penguins | 36 | 15 | 41 | 56 | +26 | 16 | 124 | 12.1 | 21:06 | 14 | 7 | 8 | 15 | -3 | 8 | 59 | 11.9 | 23:05 |
| 2013-14 | Olympics | Canada | 6 | 1 | 2 | 3 | +4 | 11 | ||||||||||||
| 2013-14 | NHL | Pittsburgh Penguins | 80 | 36 | 68 | 104 | +18 | 46 | 259 | 13.9 | 21:58 | 13 | 1 | 8 | 9 | -4 | 4 | 38 | 2.6 | 21:19 |
| 2014-15 | WC-A | Canada | 9 | 4 | 7 | 11 | +1 | 2 | 22 | |||||||||||
| 2014-15 | NHL | Pittsburgh Penguins | 77 | 28 | 56 | 84 | +5 | 47 | 237 | 11.8 | 19:58 | 5 | 2 | 2 | 4 | +1 | 10 | 20.0 | 20:09 | |
| 2015-16 | NHL | Pittsburgh Penguins | 80 | 36 | 49 | 85 | +19 | 42 | 248 | 14.5 | 20:28 | 24 | 6 | 13 | 19 | -2 | 4 | 69 | 8.7 | 20:26 |
| 2016-17 | WCup | Canada | 6 | 3 | 7 | 10 | +8 | |||||||||||||
| 2016-17 | NHL | Pittsburgh Penguins | 75 | 44 | 45 | 89 | +17 | 24 | 255 | 17.2 | 19:53 | 24 | 8 | 19 | 27 | +4 | 10 | 63 | 12.7 | 19:24 |
| 2017-18 | NHL | Pittsburgh Penguins | 82 | 29 | 60 | 89 | 46 | 247 | 11.7 | 20:41 | 12 | 9 | 12 | 21 | +7 | 6 | 29 | 31.0 | 20:18 | |
| 2018-19 | NHL | Pittsburgh Penguins | 79 | 35 | 65 | 100 | +18 | 36 | 220 | 15.9 | 21:00 | 4 | 1 | 1 | -4 | 2 | 6 | 0.0 | 22:24 | |
| 2019-20 | NHL | Pittsburgh Penguins | 41 | 16 | 31 | 47 | -8 | 15 | 109 | 14.7 | 20:16 | 4 | 2 | 1 | 3 | 13 | 15.4 | 20:46 | ||
| 2020-21 | NHL | Pittsburgh Penguins | 55 | 24 | 38 | 62 | +8 | 26 | 159 | 15.1 | 20:24 | 6 | 1 | 1 | 2 | -2 | 2 | 21 | 4.8 | 20:06 |
| 2021-22 | NHL | Pittsburgh Penguins | 69 | 31 | 53 | 84 | +19 | 32 | 208 | 14.9 | 19:58 | 6 | 2 | 8 | 10 | +2 | 2 | 22 | 9.1 | 20:26 |
| 2022-23 | NHL | Pittsburgh Penguins | 82 | 33 | 60 | 93 | +8 | 52 | 255 | 12.9 | 20:09 | |||||||||
| 2023-24 | NHL | Pittsburgh Penguins | 82 | 42 | 52 | 94 | +7 | 40 | 278 | 15.1 | 20:05 | |||||||||
| 2024-25 | NHL | Pittsburgh Penguins | 80 | 33 | 58 | 91 | -20 | 31 | 227 | 14.5 | 20:22 | |||||||||
| 2024-25 | WC | Canada | 8 | 4 | 8 | 12 | +8 | 6 | ||||||||||||
| 2024-25 | 4 Nations | Canada | 4 | 1 | 4 | 5 | +2 | 2 | 3 | 33.0 | 17:34 | |||||||||
| 2025-26 | OG | Canada | 4 | 2 | 4 | 6 | +3 | 10 | 20.0 | 12:51 | ||||||||||
| 2025-26 | NHL | Pittsburgh Penguins | 68 | 29 | 45 | 74 | 44 | 160 | 18.1 | 19:14 | 6 | 1 | 4 | 5 | -1 | 6 | 19 | 5.3 | 20:57 | |
| NHL Career | 1420 | 654 | 1107 | 1761 | +197 | 898 | 4459 | 14.7 | 20:36 | 186 | 72 | 134 | 206 | +17 | 89 | 561 | 12.8 | 20:56 | ||