
Ryan Suter
| Position | Left Defense | Current Team | |
| Shoots | Left | Current Contract | |
| Height | 6'1" | Expires | |
| Weight (lbs) | 201 | Expiry Age (Jun 30) | |
| Age (DOB) | 41 (Jan 21, 1985) | Expiry Status | |
| Drafted | 2003, Round 1, Overall 7 (NSH) |
| Date | Team | Transaction | |
|---|---|---|---|
| Jul 10, 2024 | St. Louis Blues | Signed 1 year @ $3.000M AAV starting in 2024-25 | |
| Jun 28, 2024 | Dallas Stars | Contract bought out | |
| Jul 28, 2021 | Dallas Stars | Signed 4 years @ $3.650M AAV starting in 2021-22 | |
| Jul 13, 2021 | Minnesota Wild | Contract bought out | |
| Jul 4, 2012 | Minnesota Wild | Signed 13 years @ $7.538M AAV starting in 2012-13 | |
| Jun 16, 2008 | Nashville Predators | Signed 4 years @ $3.500M AAV starting in 2008-9 | |
| Sep 8, 2004 | Nashville Predators | Signed to an entry level contract. |
Player Card(s)
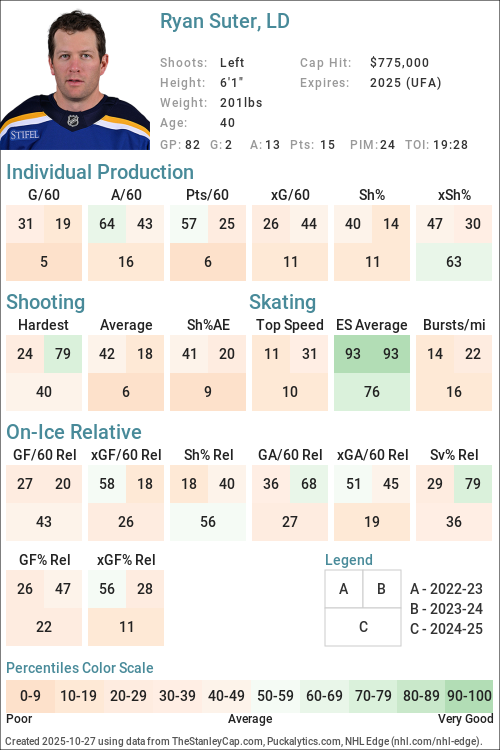
URL: https://thestanleycap.com/cdn/player_cards/20242025/ryan-suter-8470600.png
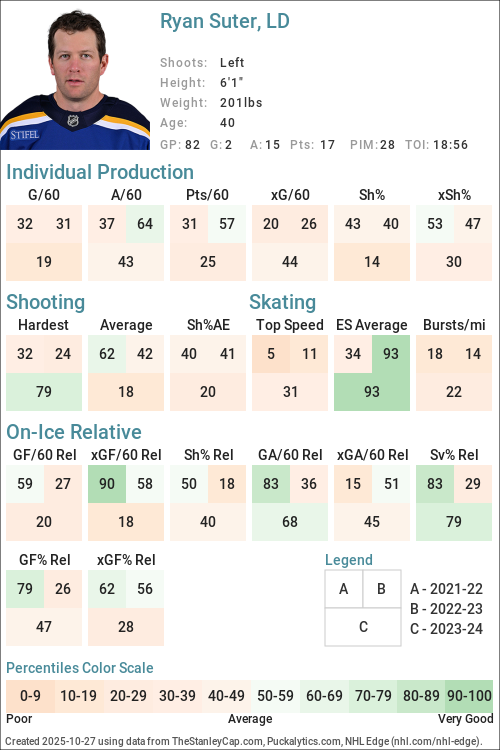
URL: https://thestanleycap.com/cdn/player_cards/20232024/ryan-suter-8470600.png
About Player Cards
Player cards present an infographic of a players performance using a series of Player Archetypes developed for Puckalytics.com and TheStanleyCap.com. The boxes in the rink image show the archetype ratings for the season specified in the card while the graphs to the right show the five-year trends for those archetypes.
Except for Faceoffs, the values shown are the players z-score (standard deviation from the mean) for the specific metric used to calculate the archetype values. When calculating z-scores forwards were compared to forwards and defensemen were compared to defensemen. Positive values indicate the player is above average and shaded in blue, while negative values indicate the player is below average and shaded in pink. The five year trend charts show a range of -4.0 to 4.0.
The value shown for Faceoffs is the faceoff winning percentage rather than their z-score with winning percentages below 50 in pink shades and above 50 in blue shades.
All archetypes are 5v5 except 5v4 TOI, 4v5 TOI, Skating (even strength) and Faceoffs (all situations). Archetypes use regular season data only.
Archetypes Summary
- Sniper - Measures the to score above the expected goal rate.
- Rebound - Measures the percent of a players shot attempts that come from rebounds (forwards only).
- 5v4 TOI - Powerplay ice time, calculated as the percentage of his teams 5v4 ice time that the player was on the ice for.
- Shooter - Measures whether a players points come from shots (goals or assists on rebounds from his shots).
- Producer - Measures a players ability to produce goals and assists, adjusted for quality of teammates.
- Playmaker - Measures whether a players points come from passes.
- Drive - Measures a players ability to drive puck possession and generate shot attempts for his team.
- Rush - Measures the percent of a players shot attempts that come from rush plays
- Possession - An indicator of a players ability to improve his teams puck possession game.
- Faceoffs - Faceoff Winning Percentage (min. 75 faceoffs taken).
- 5v5 TOI - The percentage of his teams 5v5 TOI that the player was on the ice for.
- Suppress - Measures a players ability to suppress opponent puck possession and shot attempts against.
- Skating - An indicator of a players skating ability, or speed bursts above 20mph per mile skated.
- Defend - An indicator of a players ability to suppress shot quality against.
- 4v5 TOI - Penalty Kill ice time, calculated as the percentage of his teams 4v5 ice time that the player was on the ice for.
Data Sources
- Salary data is from TheStanleyCap.com
- Skating data is from NHL Edge
- Other statistics are from Puckalytics.com and derived from data from NHL.com
Terms of Use
You are free to use include player cards in written articles, share on social media, or on other public websites under the following conditions:
- You credit TheStanleyCap.com as the source and provide a link back to TheStanleyCap.com or this player page.
- You do not mass copy/duplicate/publish dozens or hundreds of player cards. A few, or a handful for a written article is fine. Be reasonable. Fair use rules apply.
- If you are a high-traffic website you must download and host the image(s) on your site rather than overload TheStanleyCap servers with traffic.
Note: Player cards will update daily throughout the season so if you want to include snapshot then you must download the image.
If you have any questions, send an e-mail to the e-mail address at the top of this page.
Read Introducing Player Archetypes on HockeyAnalysis.com for more details on archetype calculations.
Core Archetypes
| Season | Team(s) | GP | TOI | Producer | Playmaker | Shooter | Sniper | Rebound | Rush | Skating | Defend |
|---|---|---|---|---|---|---|---|---|---|---|---|
| 2015-16 | MIN | 82 | 0.08 | 0.10 | -0.22 | 0.27 | - | 0.30 | - | -0.22 | |
| 2016-17 | MIN | 82 | -0.28 | -0.05 | -0.45 | -0.16 | - | 0.94 | - | 0.66 | |
| 2017-18 | MIN | 78 | 0.32 | 0.11 | 0.02 | 0.41 | - | -0.36 | - | -0.37 | |
| 2018-19 | MIN | 82 | 0.06 | 0.45 | -0.56 | -0.73 | - | 0.18 | - | 0.42 | |
| 2019-20 | MIN | 69 | 1.14 | 1.04 | 0.27 | 1.62 | - | -0.03 | - | -0.76 | |
| 2020-21 | MIN | 56 | -0.90 | -0.74 | -0.59 | 0.18 | - | 0.14 | - | -0.14 | |
| 2021-22 | DAL | 82 | -0.57 | -0.24 | -0.72 | -0.27 | - | -0.31 | -0.97 | 0.88 | |
| 2022-23 | DAL | 82 | 0.02 | 0.38 | -0.55 | -0.11 | - | -0.22 | -1.01 | -0.47 | |
| 2023-24 | DAL | 82 | -0.80 | -0.63 | -0.76 | -0.77 | - | 0.18 | -0.84 | 0.88 | |
| 2024-25 | STL | 82 | -1.23 | -1.19 | -0.80 | -1.67 | - | -0.68 | -0.93 | -0.35 |
Situational and Secondary Archetypes
| Season | Team(s) | GP | TOI | 5v5 TOI | 5v4 TOI | 4v5 TOI | Possession | Drive | Suppress | Faceoffs |
|---|---|---|---|---|---|---|---|---|---|---|
| 2015-16 | MIN | 82 | 2.77 | 1.50 | 0.75 | 1.53 | 1.62 | 0.58 | - | |
| 2016-17 | MIN | 82 | 2.31 | 1.20 | 1.01 | 0.49 | 0.73 | -0.03 | - | |
| 2017-18 | MIN | 78 | 1.92 | 1.42 | 1.03 | 0.92 | 1.21 | 0.01 | - | |
| 2018-19 | MIN | 82 | 2.08 | 1.14 | 0.48 | 0.17 | 1.62 | -1.48 | - | |
| 2019-20 | MIN | 69 | 1.08 | 0.90 | 0.72 | -0.33 | 0.80 | -1.40 | - | |
| 2020-21 | MIN | 56 | 0.50 | 0.48 | 0.16 | 0.29 | 1.30 | -1.01 | - | |
| 2021-22 | DAL | 82 | 1.23 | 0.54 | 0.05 | 0.34 | 0.87 | -0.49 | - | |
| 2022-23 | DAL | 82 | 0.30 | 0.01 | -0.45 | 0.42 | 0.26 | 0.38 | - | |
| 2023-24 | DAL | 82 | 0.40 | -1.40 | -0.54 | -0.79 | -0.57 | -0.57 | - | |
| 2024-25 | STL | 82 | 0.05 | -1.41 | 0.86 | -1.04 | -0.65 | -0.82 | - |
5v5 Individual Stats
| Season | Team(s) | GP | TOI | G/60 | A/60 | Pts/60 | xG/60 | GAE/60 | Sh% | xSh% | Sh%AE | %SA Rush | %SA Reb. |
|---|---|---|---|---|---|---|---|---|---|---|---|---|---|
| 2015-16 | MIN | 82 | 1663:53 | 0.14 | 0.61 | 0.76 | 0.12 | 0.02 | 3.42 | 2.92 | 0.50 | 1.23 | 3.09 |
| 2016-17 | MIN | 82 | 1623:40 | 0.15 | 0.67 | 0.81 | 0.16 | -0.02 | 3.96 | 4.40 | -0.44 | 2.17 | 3.62 |
| 2017-18 | MIN | 78 | 1484:43 | 0.16 | 0.65 | 0.81 | 0.11 | 0.05 | 4.44 | 3.14 | 1.30 | 0.79 | 2.38 |
| 2018-19 | MIN | 82 | 1599:50 | 0.11 | 0.75 | 0.86 | 0.18 | -0.06 | 3.26 | 5.10 | -1.84 | 1.34 | 4.03 |
| 2019-20 | MIN | 69 | 1200:26 | 0.25 | 1.00 | 1.25 | 0.11 | 0.14 | 6.67 | 3.03 | 3.63 | 0.94 | 3.77 |
| 2020-21 | MIN | 56 | 949:01 | 0.13 | 0.51 | 0.63 | 0.12 | 0.01 | 3.45 | 3.16 | 0.29 | 1.15 | 2.30 |
| 2021-22 | DAL | 82 | 1529:13 | 0.12 | 0.59 | 0.71 | 0.15 | -0.03 | 3.49 | 4.36 | -0.88 | 0.72 | 3.60 |
| 2022-23 | DAL | 82 | 1363:31 | 0.13 | 0.75 | 0.88 | 0.15 | -0.02 | 3.66 | 4.13 | -0.48 | 0.74 | 6.67 |
| 2023-24 | DAL | 82 | 1392:09 | 0.09 | 0.60 | 0.69 | 0.15 | -0.07 | 2.02 | 3.59 | -1.57 | 1.27 | 4.43 |
| 2024-25 | STL | 82 | 1386:19 | 0.04 | 0.43 | 0.48 | 0.14 | -0.10 | 1.75 | 5.63 | -3.88 | 0.00 | 2.25 |
5v5 On Ice Stats
| Season | Team(s) | GP | TOI | SAF/60 | GF/60 | xGF/60 | SAA/60 | GA/60 | xGA/60 | GF% | xGF% | xGF Rel | xGA Rel | xGF% Rel |
|---|---|---|---|---|---|---|---|---|---|---|---|---|---|---|
| 2015-16 | MIN | 82 | 1663:53 | 40.71 | 2.34 | 2.17 | 38.91 | 1.88 | 1.88 | 55.56 | 53.48 | 0.27 | -0.15 | 5.32 |
| 2016-17 | MIN | 82 | 1623:40 | 42.46 | 3.03 | 2.60 | 41.46 | 2.07 | 1.85 | 59.42 | 58.40 | 0.43 | -0.16 | 6.57 |
| 2017-18 | MIN | 78 | 1484:43 | 41.66 | 1.98 | 2.31 | 42.67 | 2.38 | 1.98 | 45.37 | 53.85 | 0.19 | -0.12 | 3.55 |
| 2018-19 | MIN | 82 | 1599:50 | 46.80 | 2.44 | 2.78 | 43.35 | 2.40 | 2.27 | 50.39 | 55.06 | 0.61 | 0.30 | 2.70 |
| 2019-20 | MIN | 69 | 1200:26 | 43.08 | 3.05 | 2.50 | 44.78 | 3.00 | 2.25 | 50.41 | 52.63 | 0.27 | 0.29 | -0.66 |
| 2020-21 | MIN | 56 | 949:01 | 40.59 | 3.03 | 2.38 | 43.88 | 2.59 | 2.21 | 53.93 | 51.91 | 0.18 | 0.06 | 1.24 |
| 2021-22 | DAL | 82 | 1529:13 | 42.37 | 2.31 | 2.74 | 42.85 | 2.16 | 2.58 | 51.75 | 51.49 | 0.25 | 0.22 | 0.16 |
| 2022-23 | DAL | 82 | 1363:31 | 42.73 | 2.42 | 2.73 | 40.00 | 2.29 | 2.40 | 51.40 | 53.20 | 0.03 | -0.10 | 1.31 |
| 2023-24 | DAL | 82 | 1392:09 | 43.27 | 2.63 | 2.51 | 40.77 | 2.24 | 2.19 | 53.98 | 53.37 | -0.23 | 0.02 | -2.42 |
| 2024-25 | STL | 82 | 1386:19 | 35.06 | 2.42 | 2.10 | 40.73 | 2.34 | 2.34 | 50.91 | 47.27 | -0.23 | 0.24 | -5.28 |
NHL Edge Stats
| Skating | Shooting | Zone Time | |||||||||||
|---|---|---|---|---|---|---|---|---|---|---|---|---|---|
| Season | GP | Top Speed | Bursts>20/mi | Avg. Speed | Top Speed | Avg. Speed | %Long Range | %Mid Range | %High Danger | ES DZ% | ES NZ% | ES OZ% | |
| This table is for Basic and Premium subscribers only. To view please login to and/or subscribe to one of our subscription plans. | |||||||||||||
Legend
| Percentile 0-25 | Percentile 25-50 | Percentile 50-75 | Percentile 75-100 |
5v5 Defense Pairs
| Season | Teammate | Team | TOI | GF/60 | GA/60 | GF% | xGF/60 | xGA/60 | xGF% | xGF Rel | xGA Rel | xGF% Rel |
|---|
Glossary
| Type | Statistic | Definition |
|---|---|---|
| Individual | G/60 | Goals Against per 60 minutes. |
| Individual | A/60 | Assists per 60 minutes. |
| Individual | Pts/60 | Points per 60 minutes. |
| Individual | xG/60 | Expected Goals per 60 minutes. |
| Individual | GAE/60 | Goals Above Expected (G/60 - xG/60). |
| Individual | Sh% | Shooting Percentage. |
| Individual | xSh% | Expected Shooting Percentage. |
| Individual | Sh%AE | Shooting percentage above expected (Sh% - xSh%). |
| Individual | %SA Rush | Percentage of shot attempts determined to be on the rush. |
| Individual | %SA Reb. | Percentage of shot attempts determined to be from rebounds. |
| On Ice | SAF/60 | Shot Attempts For per 60 minutes. |
| On Ice | GF/60 | Goals For per 60 minutes. |
| On Ice | xGF/60 | Expected Goals For per 60 minutes. |
| On Ice | SAA/60 | Shot Attempts Against per 60 minutes (lower is better). |
| On Ice | GA/60 | Goals Against per 60 minutes (lower is better). |
| On Ice | xGA/60 | Expected Goals Against per 60 minutes (lower is better). |
| On Ice | GF% | Goals For Percentage = Goals For / (Goals For + Goals Against) |
| On Ice | xGF% | Expected Goals For Percentage = Expected Goals For / (Expected Goals For + Expected Goals Against) |
| On Ice | xGF Rel | xGF/60 when On Ice - xGF/60 when not On Ice. |
| On Ice | xGA Rel | xGA/60 when On Ice - xGA/60 when not On Ice (lower is better). |
| On Ice | xGF% Rel | xGF% when On Ice - xGF% when not On Ice. |
News and Opinions
-
Zach Parise and Ryan Suter weren't the disaster they seemed for the Minnesota Wild at Gone Puck Wild (Thu Jul 16, 2026)
-
There's No Reason To Worry About A Parise/Suter Repeat For the Wild at Hockey Wilderness (Mon Feb 9, 2026)
-
Former Blues Defenseman Remains Without A Contract; Isn't Forcing It at Yahoo Sports NHL (Fri Sep 19, 2025)
-
Nashville Predators should consider reunion with Ryan Suter to close out NHL Free Agency at Pred Lines (Tue Jul 29, 2025)
Current Contract
Player does not currently have a contract.Ryan Suter signed a $775,000 1-year contract with the St. Louis Blues and General Manager Doug Armstrong on July 10, 2024 with an AAV of $775,000. This contract will start in 2024-25 and end after the 2024-25 season. In the first season of the contract the cap hit was equivalent to 0.88% of the salary cap.
Standard Contract (UFA) ( ) (0 ratings)
| Season | Age* | Clause | Cap Hit | AAV | Perf. Bonus | Sign. Bonus | Salary | Compensation | Minors Salary | Status | |
|---|---|---|---|---|---|---|---|---|---|---|---|
| 2024-25 | 39 | $775,000 | $3,000,000 | $2,225,000 | - | $775,000 | $775,000 | $775,000 | UFA | ||
| Total | $2,225,000 | - | $775,000 | $775,000 | $775,000 |
Ryan Suter signed a $14,600,000 4-year contract with the Dallas Stars and General Manager Jim Nill on July 28, 2021 with an AAV of $3,650,000. This contract will start in 2021-22 and end after the 2024-25 season. In the first season of the contract the cap hit was equivalent to 4.48% of the salary cap. The Dallas Stars bought out this contract on June 28, 2024.
Standard Contract (UFA) ( ) (0 ratings)
| Season | Age* | Clause | Cap Hit | AAV | Perf. Bonus | Sign. Bonus | Salary | Compensation | Minors Salary | Status | |
|---|---|---|---|---|---|---|---|---|---|---|---|
| 2021-22 | 36 | NMC | $3,650,000 | $3,650,000 | - | $1,000,000 | $1,000,000 | $2,000,000 | $2,000,000 | UFA | |
| 2022-23 | 37 | NMC | $3,650,000 | $3,650,000 | - | - | $4,000,000 | $4,000,000 | $4,000,000 | UFA | |
| 2023-24 | 38 | NMC | $3,650,000 | $3,650,000 | - | - | $4,300,000 | $4,300,000 | $4,300,000 | UFA | |
| 2024-25 | 39 | NMC | $3,650,000 | $3,650,000 | - | - | $4,300,000 | $4,300,000 | $4,300,000 | UFA | |
| Total | - | $1,000,000 | $13,600,000 | $14,600,000 | $14,600,000 |
Ryan Suter signed a $98,000,000 13-year contract with the Minnesota Wild and General Manager Chuck Fletcher on July 4, 2012 with an AAV of $7,538,462. This contract will start in 2012-13 and end after the 2024-25 season. In the first season of the contract the cap hit was equivalent to 12.56% of the salary cap. The Minnesota Wild bought out this contract on July 13, 2021.
Standard Contract (UFA) ( ) (0 ratings)
| Season | Age* | Clause | Cap Hit | AAV | Perf. Bonus | Sign. Bonus | Salary | Compensation | Minors Salary | Status | |
|---|---|---|---|---|---|---|---|---|---|---|---|
| 2012-13 | 27 | NMC | $7,538,462 | $7,538,462 | - | $10,000,000 | $2,000,000 | $12,000,000 | $12,000,000 | UFA | |
| 2013-14 | 28 | NMC | $7,538,462 | $7,538,462 | - | $10,000,000 | $2,000,000 | $12,000,000 | $12,000,000 | UFA | |
| 2014-15 | 29 | NMC | $7,538,462 | $7,538,462 | - | $5,000,000 | $6,000,000 | $11,000,000 | $11,000,000 | UFA | |
| 2015-16 | 30 | NMC | $7,538,462 | $7,538,462 | - | - | $9,000,000 | $9,000,000 | $9,000,000 | UFA | |
| 2016-17 | 31 | NMC | $7,538,462 | $7,538,462 | - | - | $9,000,000 | $9,000,000 | $9,000,000 | UFA | |
| 2017-18 | 32 | NMC | $7,538,462 | $7,538,462 | - | - | $9,000,000 | $9,000,000 | $9,000,000 | UFA | |
| 2018-19 | 33 | NMC | $7,538,462 | $7,538,462 | - | - | $9,000,000 | $9,000,000 | $9,000,000 | UFA | |
| 2019-20 | 34 | NMC | $7,538,462 | $7,538,462 | - | - | $9,000,000 | $9,000,000 | $9,000,000 | UFA | |
| 2020-21 | 35 | NMC | $7,538,462 | $7,538,462 | - | - | $8,000,000 | $8,000,000 | $8,000,000 | UFA | |
| 2021-22 | 36 | NMC | $7,538,462 | $7,538,462 | - | - | $6,000,000 | $6,000,000 | $6,000,000 | UFA | |
| 2022-23 | 37 | NMC | $7,538,462 | $7,538,462 | - | - | $2,000,000 | $2,000,000 | $2,000,000 | UFA | |
| 2023-24 | 38 | NMC | $7,538,462 | $7,538,462 | - | - | $1,000,000 | $1,000,000 | $1,000,000 | UFA | |
| 2024-25 | 39 | NMC | $7,538,462 | $7,538,462 | - | - | $1,000,000 | $1,000,000 | $1,000,000 | UFA | |
| Total | - | $25,000,000 | $73,000,000 | $98,000,000 | $98,000,000 |
Ryan Suter signed a $14,000,000 4-year contract with the Nashville Predators and General Manager David Poile on June 16, 2008 with an AAV of $3,500,000. This contract will start in 2008-09 and end after the 2011-12 season. In the first season of the contract the cap hit was equivalent to 6.17% of the salary cap.
Standard Contract (RFA) ( ) (0 ratings)
| Season | Age* | Clause | Cap Hit | AAV | Perf. Bonus | Sign. Bonus | Salary | Compensation | Minors Salary | Status | |
|---|---|---|---|---|---|---|---|---|---|---|---|
| 2008-09 | 23 | $3,500,000 | $3,500,000 | - | - | $3,500,000 | $3,500,000 | $3,500,000 | RFA | ||
| 2009-10 | 24 | $3,500,000 | $3,500,000 | - | - | $3,500,000 | $3,500,000 | $3,500,000 | RFA-arb | ||
| 2010-11 | 25 | $3,500,000 | $3,500,000 | - | - | $3,500,000 | $3,500,000 | $3,500,000 | RFA-arb | ||
| 2011-12 | 26 | $3,500,000 | $3,500,000 | - | - | $3,500,000 | $3,500,000 | $3,500,000 | RFA-arb | ||
| Total | - | - | $14,000,000 | $14,000,000 | $14,000,000 |
Ryan Suter signed a $2,356,000 3-year contract with the Nashville Predators and General Manager David Poile on September 8, 2004 with an AAV of $785,333. This contract will start in 2005-06 and end after the 2007-08 season. In the first season of the contract the cap hit was equivalent to 2.01% of the salary cap.
Entry Level Contract ( ) (0 ratings)
| Season | Age* | Clause | Cap Hit | AAV | Perf. Bonus | Sign. Bonus | Salary | Compensation | Minors Salary | Status | |
|---|---|---|---|---|---|---|---|---|---|---|---|
| 2005-06 | 20 | $785,333 | $785,333 | - | - | $942,400 | $942,400 | - | ELC | ||
| 2006-07 | 21 | $785,333 | $785,333 | - | - | $471,200 | $471,200 | $92,500 | ELC | ||
| 2007-08 | 22 | $785,333 | $785,333 | - | - | $942,400 | $942,400 | $92,500 | ELC | ||
| Total | - | - | $2,356,000 | $2,356,000 | $185,000 |
Contract Buyout Details
Minnesota Wild
| Season | Original Compensation | Buyout Compensation | Compensation Savings | Original Caphit | Buyout Caphit | Caphit Savings |
|---|---|---|---|---|---|---|
| 2022-23 | $6,000,000 | $833,333 | $5,166,667 | $7,538,462 | $2,371,795 | $5,166,667 |
| 2023-24 | $2,000,000 | $833,333 | $1,166,667 | $7,538,462 | $6,371,795 | $1,166,667 |
| 2024-25 | $1,000,000 | $833,333 | $166,667 | $7,538,462 | $7,371,795 | $166,667 |
| 2025-26 | $1,000,000 | $833,333 | $166,667 | $7,538,462 | $7,371,795 | $166,667 |
| 2026-27 | - | $833,333 | $-833,333 | - | $833,333 | $-833,333 |
| 2027-28 | - | $833,333 | $-833,333 | - | $833,333 | $-833,333 |
| 2028-29 | - | $833,333 | $-833,333 | - | $833,333 | $-833,333 |
| 2029-30 | - | $833,333 | $-833,333 | - | $833,333 | $-833,333 |
Dallas Stars
| Season | Original Compensation | Buyout Compensation | Compensation Savings | Original Caphit | Buyout Caphit | Caphit Savings |
|---|---|---|---|---|---|---|
| 2025-26 | $4,300,000 | $1,433,333 | $2,866,667 | $3,650,000 | $783,333 | $2,866,667 |
| 2026-27 | - | $1,433,333 | $-1,433,333 | - | $1,433,333 | $-1,433,333 |
Career Statistics
| Regular Season | Playoffs | |||||||||||||||||||
|---|---|---|---|---|---|---|---|---|---|---|---|---|---|---|---|---|---|---|---|---|
| Season | League | Team | GP | G | A | Pts | +/- | PIM | Shots | Sh% | TOI/G | GP | G | A | Pts | +/- | PIM | Shots | Sh% | TOI/G |
| 2000-01 | High-IN | Culver Academy | 26 | 13 | 32 | 45 | ||||||||||||||
| 2001-02 | NAHL | USNTDP | 35 | 2 | 10 | 12 | 75 | |||||||||||||
| 2001-02 | U-18 | USNTDP | 27 | 4 | 10 | 14 | 6 | |||||||||||||
| 2001-02 | U-17 | USNTDP | 8 | 2 | 11 | 13 | 21 | |||||||||||||
| 2001-02 | WJ18-A | USA | 8 | 1 | 6 | 7 | 12 | |||||||||||||
| 2002-03 | U-18 | USNTDP | 42 | 7 | 17 | 24 | 124 | |||||||||||||
| 2002-03 | NAHL | USNTDP | 9 | 2 | 5 | 7 | 12 | |||||||||||||
| 2002-03 | WJC-A | USA | 7 | 2 | 1 | 3 | 2 | |||||||||||||
| 2002-03 | WJ18-A | USA | 6 | 1 | 3 | 4 | 22 | |||||||||||||
| 2003-04 | WCHA | U. Of Wisconsin | 39 | 3 | 16 | 19 | 93 | |||||||||||||
| 2003-04 | WJC-A | USA | 6 | 0 | 2 | 2 | 8 | |||||||||||||
| 2004-05 | WJC-A | USA | 7 | 1 | 7 | 8 | 20 | |||||||||||||
| 2004-05 | WC-A | USA | 1 | 0 | 0 | 0 | ||||||||||||||
| 2004-05 | AHL | Milwaukee | 63 | 7 | 16 | 23 | +10 | 70 | 7 | 1 | 5 | 6 | -4 | 16 | ||||||
| 2005-06 | NHL | Nashville Predators | 71 | 1 | 15 | 16 | +7 | 66 | 84 | 1.2 | 17:21 | |||||||||
| 2005-06 | WC-A | USA | 7 | 1 | 1 | 2 | 10 | |||||||||||||
| 2006-07 | WC-A | USA | 7 | 1 | 2 | 3 | 12 | |||||||||||||
| 2006-07 | NHL | Nashville Predators | 82 | 8 | 16 | 24 | +10 | 54 | 87 | 9.2 | 20:09 | 5 | 1 | 1 | 8 | 9 | 11.1 | 23:19 | ||
| 2007-08 | NHL | Nashville Predators | 76 | 7 | 24 | 31 | +3 | 71 | 138 | 5.1 | 20:35 | 6 | 1 | 1 | 2 | -2 | 4 | 6 | 16.7 | 21:12 |
| 2008-09 | NHL | Nashville Predators | 82 | 7 | 38 | 45 | -16 | 73 | 143 | 4.9 | 24:16 | |||||||||
| 2008-09 | WC-A | USA | 9 | 1 | 2 | 3 | 8 | |||||||||||||
| 2009-10 | Olympics | USA | 6 | 0 | 4 | 4 | 2 | |||||||||||||
| 2009-10 | NHL | Nashville Predators | 82 | 4 | 33 | 37 | +4 | 48 | 125 | 3.2 | 23:59 | 6 | -1 | 16 | 0.0 | 24:09 | ||||
| 2010-11 | NHL | Nashville Predators | 70 | 4 | 35 | 39 | +20 | 54 | 115 | 3.5 | 25:12 | 12 | 1 | 5 | 6 | +2 | 6 | 23 | 4.4 | 28:51 |
| 2011-12 | NHL | Nashville Predators | 79 | 7 | 39 | 46 | +15 | 30 | 134 | 5.2 | 26:30 | 10 | 1 | 3 | 4 | -3 | 4 | 30 | 3.3 | 28:50 |
| 2012-13 | NHL | Minnesota Wild | 48 | 4 | 28 | 32 | +2 | 24 | 91 | 4.4 | 27:17 | 5 | -5 | 4 | 5 | 0.0 | 31:37 | |||
| 2013-14 | Olympics | USA | 6 | 0 | 3 | 3 | +2 | 4 | 3 | |||||||||||
| 2013-14 | NHL | Minnesota Wild | 82 | 8 | 35 | 43 | +15 | 34 | 150 | 5.3 | 29:25 | 13 | 1 | 6 | 7 | -5 | 4 | 29 | 3.4 | 29:13 |
| 2014-15 | NHL | Minnesota Wild | 77 | 2 | 36 | 38 | +7 | 48 | 150 | 1.3 | 29:04 | 10 | 3 | 3 | -8 | 13 | 0.0 | 26:59 | ||
| 2015-16 | NHL | Minnesota Wild | 82 | 8 | 43 | 51 | +10 | 30 | 188 | 4.3 | 28:36 | 6 | 3 | 3 | +3 | 4 | 10 | 0.0 | 29:17 | |
| 2016-17 | WCup | USA | 3 | 0 | 1 | 1 | -2 | |||||||||||||
| 2016-17 | NHL | Minnesota Wild | 82 | 9 | 31 | 40 | +34 | 36 | 164 | 5.5 | 26:55 | 5 | 1 | 2 | 3 | -3 | 10 | 15 | 6.7 | 29:06 |
| 2017-18 | NHL | Minnesota Wild | 78 | 6 | 45 | 51 | -1 | 34 | 149 | 4.0 | 26:47 | |||||||||
| 2018-19 | NHL | Minnesota Wild | 82 | 7 | 40 | 47 | -8 | 41 | 136 | 5.2 | 26:42 | |||||||||
| 2018-19 | WC | USA | 8 | 0 | 5 | 5 | -2 | 4 | ||||||||||||
| 2019-20 | NHL | Minnesota Wild | 69 | 8 | 40 | 48 | -6 | 12 | 111 | 7.2 | 24:38 | 3 | 1 | 1 | +1 | 3 | 0.0 | 23:27 | ||
| 2020-21 | NHL | Minnesota Wild | 56 | 3 | 16 | 19 | +9 | 12 | 86 | 3.5 | 22:11 | 7 | 1 | 1 | -4 | 9 | 0.0 | 24:03 | ||
| 2021-22 | NHL | Dallas Stars | 82 | 7 | 25 | 32 | +1 | 40 | 118 | 5.9 | 23:39 | 7 | 3 | 3 | -1 | 2 | 6 | 0.0 | 23:38 | |
| 2022-23 | NHL | Dallas Stars | 82 | 3 | 22 | 25 | 26 | 92 | 3.3 | 20:23 | 19 | 6 | 6 | -3 | 18 | 21 | 0.0 | 23:21 | ||
| 2023-24 | NHL | Dallas Stars | 82 | 2 | 15 | 17 | +14 | 28 | 102 | 2.0 | 18:56 | 19 | 1 | 3 | 4 | +1 | 16 | 9 | 11.1 | 17:50 |
| 2024-25 | NHL | St. Louis Blues | 82 | 2 | 13 | 15 | +7 | 24 | 62 | 3.2 | 19:28 | 5 | 1 | 1 | -2 | 2 | 0.0 | 16:54 | ||
| NHL Career | 1526 | 107 | 589 | 696 | +127 | 785 | 2425 | 4.4 | 24:05 | 138 | 7 | 38 | 45 | -30 | 80 | 206 | 3.4 | 24:48 | ||