
 Ryan Graves
| Position | Left Defense | Current Team | Pittsburgh Penguins |
| Shoots | Left | Current Contract | 6 years ($4.5M CapHit) |
| Height | 6'5" | Expires | 2028-29 |
| Weight (lbs) | 225 | Expiry Age (Jun 30) | 34 |
| Age (DOB) | 31 (May 21, 1995) | Expiry Status | UFA |
| Drafted | 2013, Round 4, Overall 110 (NYR) |
| Date | Team | Transaction | |
|---|---|---|---|
| Mar 22, 2026 | Pittsburgh Penguins | Activated from IR | |
| Mar 19, 2026 | Pittsburgh Penguins | Placed on IR | |
| Mar 12, 2026 | Pittsburgh Penguins | Assigned to AHL for conditioning stint | |
| Feb 2, 2026 | Pittsburgh Penguins | Activated from IR | |
| Jan 13, 2026 | Pittsburgh Penguins | Recalled from AHL | |
| Dec 31, 2025 | Pittsburgh Penguins | Assigned to AHL | |
| Dec 31, 2025 | Pittsburgh Penguins | Cleared Waivers | |
| Dec 30, 2025 | Pittsburgh Penguins | Placed on Waivers | |
| Dec 29, 2025 | Pittsburgh Penguins | Placed on Non Roster Status | |
| Nov 4, 2025 | Pittsburgh Penguins | Recalled from AHL | |
| Oct 6, 2025 | Pittsburgh Penguins | Assigned to AHL | |
| Oct 5, 2025 | Pittsburgh Penguins | Cleared Waivers | |
| Oct 4, 2025 | Pittsburgh Penguins | Placed on Waivers | |
| Jul 1, 2023 | Pittsburgh Penguins | Signed 6 years @ $4.500M AAV starting in 2023-24 | |
| Oct 12, 2020 | Colorado Avalanche | Signed 3 years @ $3.167M AAV starting in 2020-21 | |
| Jul 8, 2019 | Colorado Avalanche | Signed 1 year @ $735K AAV starting in 2019-20 | |
| Jul 16, 2018 | Colorado Avalanche | Signed 1 year @ $650K AAV starting in 2018-19 | |
| Mar 17, 2014 | New York Rangers | Signed to an entry level contract. |
Player Card(s)

URL: https://thestanleycap.com/cdn/player_cards/20252026/ryan-graves-8477435.png
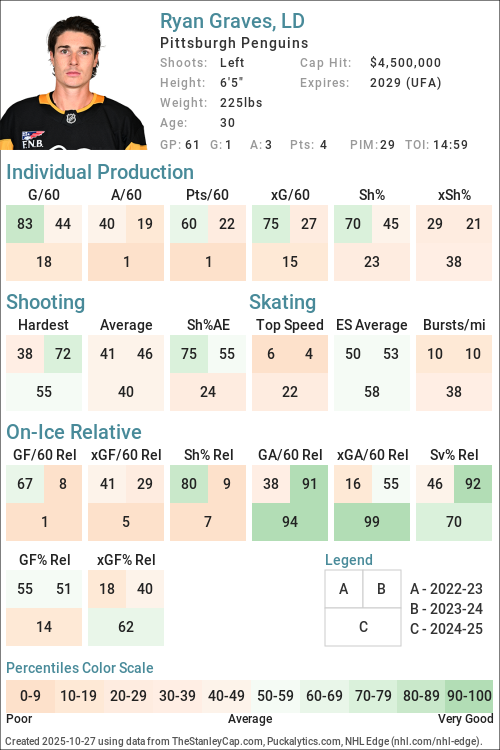
URL: https://thestanleycap.com/cdn/player_cards/20242025/ryan-graves-8477435.png
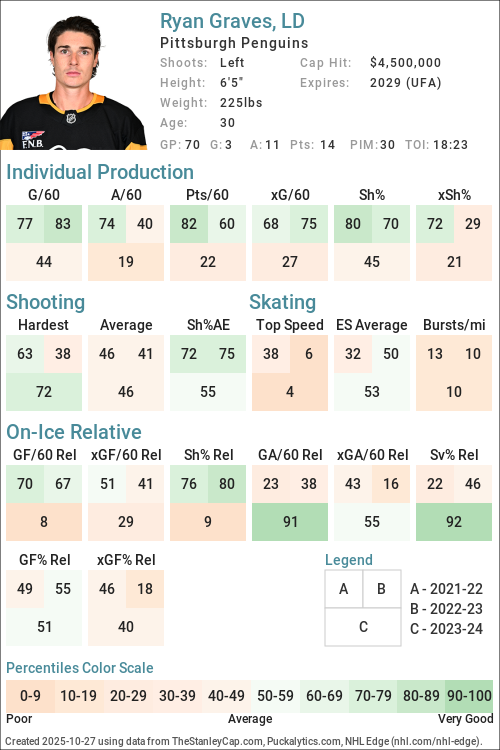
URL: https://thestanleycap.com/cdn/player_cards/20232024/ryan-graves-8477435.png
About Player Cards
Player cards present an infographic of a players performance using a series of Player Archetypes developed for Puckalytics.com and TheStanleyCap.com. The boxes in the rink image show the archetype ratings for the season specified in the card while the graphs to the right show the five-year trends for those archetypes.
Except for Faceoffs, the values shown are the players z-score (standard deviation from the mean) for the specific metric used to calculate the archetype values. When calculating z-scores forwards were compared to forwards and defensemen were compared to defensemen. Positive values indicate the player is above average and shaded in blue, while negative values indicate the player is below average and shaded in pink. The five year trend charts show a range of -4.0 to 4.0.
The value shown for Faceoffs is the faceoff winning percentage rather than their z-score with winning percentages below 50 in pink shades and above 50 in blue shades.
All archetypes are 5v5 except 5v4 TOI, 4v5 TOI, Skating (even strength) and Faceoffs (all situations). Archetypes use regular season data only.
Archetypes Summary
- Sniper - Measures the to score above the expected goal rate.
- Rebound - Measures the percent of a players shot attempts that come from rebounds (forwards only).
- 5v4 TOI - Powerplay ice time, calculated as the percentage of his teams 5v4 ice time that the player was on the ice for.
- Shooter - Measures whether a players points come from shots (goals or assists on rebounds from his shots).
- Producer - Measures a players ability to produce goals and assists, adjusted for quality of teammates.
- Playmaker - Measures whether a players points come from passes.
- Drive - Measures a players ability to drive puck possession and generate shot attempts for his team.
- Rush - Measures the percent of a players shot attempts that come from rush plays
- Possession - An indicator of a players ability to improve his teams puck possession game.
- Faceoffs - Faceoff Winning Percentage (min. 75 faceoffs taken).
- 5v5 TOI - The percentage of his teams 5v5 TOI that the player was on the ice for.
- Suppress - Measures a players ability to suppress opponent puck possession and shot attempts against.
- Skating - An indicator of a players skating ability, or speed bursts above 20mph per mile skated.
- Defend - An indicator of a players ability to suppress shot quality against.
- 4v5 TOI - Penalty Kill ice time, calculated as the percentage of his teams 4v5 ice time that the player was on the ice for.
Data Sources
- Salary data is from TheStanleyCap.com
- Skating data is from NHL Edge
- Other statistics are from Puckalytics.com and derived from data from NHL.com
Terms of Use
You are free to use include player cards in written articles, share on social media, or on other public websites under the following conditions:
- You credit TheStanleyCap.com as the source and provide a link back to TheStanleyCap.com or this player page.
- You do not mass copy/duplicate/publish dozens or hundreds of player cards. A few, or a handful for a written article is fine. Be reasonable. Fair use rules apply.
- If you are a high-traffic website you must download and host the image(s) on your site rather than overload TheStanleyCap servers with traffic.
Note: Player cards will update daily throughout the season so if you want to include snapshot then you must download the image.
If you have any questions, send an e-mail to the e-mail address at the top of this page.
Read Introducing Player Archetypes on HockeyAnalysis.com for more details on archetype calculations.
Core Archetypes
| Season | Team(s) | GP | TOI | Producer | Playmaker | Shooter | Sniper | Rebound | Rush | Skating | Defend |
|---|---|---|---|---|---|---|---|---|---|---|---|
| 2018-19 | COL | 26 | 0.33 | -0.72 | 2.40 | 2.62 | - | -1.03 | - | -1.67 | |
| 2019-20 | COL | 69 | 0.60 | -0.31 | 1.65 | 1.14 | - | 0.21 | - | 0.42 | |
| 2020-21 | COL | 54 | 0.64 | 0.39 | -0.07 | -0.47 | - | -0.81 | - | 0.07 | |
| 2021-22 | NJD | 75 | 0.67 | 0.01 | 0.88 | 0.44 | - | 1.81 | -1.04 | -0.58 | |
| 2022-23 | NJD | 78 | -0.23 | -0.55 | 0.32 | 0.57 | - | 1.23 | -1.09 | -0.05 | |
| 2023-24 | PIT | 70 | -0.65 | -0.54 | -0.55 | -0.03 | - | 0.89 | -1.14 | 1.52 | |
| 2024-25 | PIT | 61 | -1.44 | -1.33 | -0.81 | -0.49 | - | -0.68 | -0.49 | 0.55 | |
| 2025-26 | PIT | 22 | -1.59 | -1.61 | -0.40 | -0.17 | - | -0.70 | -0.55 | -1.31 |
Situational and Secondary Archetypes
| Season | Team(s) | GP | TOI | 5v5 TOI | 5v4 TOI | 4v5 TOI | Possession | Drive | Suppress | Faceoffs |
|---|---|---|---|---|---|---|---|---|---|---|
| 2018-19 | COL | 26 | -3.43 | -1.74 | -0.94 | 0.79 | 2.07 | -1.00 | - | |
| 2019-20 | COL | 69 | -0.20 | -1.74 | 1.13 | 0.28 | -0.12 | 0.54 | - | |
| 2020-21 | COL | 54 | -0.30 | -1.61 | 1.62 | -0.92 | -0.64 | -0.61 | - | |
| 2021-22 | NJD | 75 | 0.49 | -1.47 | 1.14 | -0.16 | -0.18 | -0.07 | - | |
| 2022-23 | NJD | 78 | 0.30 | -1.36 | 0.87 | -0.94 | -0.83 | -0.68 | - | |
| 2023-24 | PIT | 70 | -0.05 | -1.47 | 0.31 | -0.32 | -0.38 | -0.10 | - | |
| 2024-25 | PIT | 61 | -1.86 | -1.49 | -0.05 | -0.60 | -1.62 | 0.99 | - | |
| 2025-26 | PIT | 22 | -1.02 | -1.51 | -1.48 | 1.12 | -0.77 | 2.75 | - |
5v5 Individual Stats
| Season | Team(s) | GP | TOI | G/60 | A/60 | Pts/60 | xG/60 | GAE/60 | Sh% | xSh% | Sh%AE | %SA Rush | %SA Reb. |
|---|---|---|---|---|---|---|---|---|---|---|---|---|---|
| 2018-19 | COL | 26 | 248:42 | 0.48 | 0.48 | 0.96 | 0.19 | 0.29 | 8.70 | 3.41 | 5.28 | 0.00 | 5.26 |
| 2019-20 | COL | 69 | 1025:35 | 0.47 | 0.76 | 1.23 | 0.28 | 0.19 | 6.35 | 3.79 | 2.56 | 1.20 | 4.82 |
| 2020-21 | COL | 54 | 803:14 | 0.15 | 0.90 | 1.05 | 0.23 | -0.08 | 2.25 | 3.52 | -1.27 | 0.00 | 2.34 |
| 2021-22 | NJD | 75 | 1286:53 | 0.28 | 0.84 | 1.12 | 0.24 | 0.04 | 6.06 | 5.17 | 0.89 | 2.72 | 2.72 |
| 2022-23 | NJD | 78 | 1306:22 | 0.32 | 0.60 | 0.92 | 0.25 | 0.07 | 5.34 | 4.16 | 1.18 | 2.35 | 1.18 |
| 2023-24 | PIT | 70 | 1113:07 | 0.16 | 0.49 | 0.65 | 0.15 | 0.01 | 4.11 | 3.81 | 0.30 | 1.98 | 4.95 |
| 2024-25 | PIT | 61 | 796:15 | 0.08 | 0.23 | 0.30 | 0.11 | -0.03 | 2.56 | 3.74 | -1.18 | 0.00 | 0.00 |
| 2025-26 | PIT | 22 | 317:05 | 0.19 | 0.00 | 0.19 | 0.20 | -0.01 | 4.76 | 4.99 | -0.23 | 0.00 | 5.26 |
5v5 On Ice Stats
| Season | Team(s) | GP | TOI | SAF/60 | GF/60 | xGF/60 | SAA/60 | GA/60 | xGA/60 | GF% | xGF% | xGF Rel | xGA Rel | xGF% Rel |
|---|---|---|---|---|---|---|---|---|---|---|---|---|---|---|
| 2018-19 | COL | 26 | 248:42 | 49.46 | 2.65 | 2.38 | 44.87 | 2.41 | 2.77 | 52.38 | 46.12 | -0.07 | 0.60 | -6.79 |
| 2019-20 | COL | 69 | 1025:35 | 43.12 | 3.69 | 2.37 | 39.72 | 1.81 | 2.21 | 67.02 | 51.75 | -0.11 | -0.14 | 0.36 |
| 2020-21 | COL | 54 | 803:14 | 44.82 | 2.69 | 2.41 | 34.73 | 2.02 | 1.86 | 57.14 | 56.51 | -0.46 | -0.00 | -4.18 |
| 2021-22 | NJD | 75 | 1286:53 | 43.55 | 2.89 | 2.98 | 43.13 | 3.40 | 2.70 | 45.93 | 52.42 | 0.17 | 0.09 | 0.59 |
| 2022-23 | NJD | 78 | 1306:22 | 44.41 | 3.12 | 3.09 | 41.11 | 2.34 | 2.61 | 57.14 | 54.14 | -0.05 | 0.25 | -2.85 |
| 2023-24 | PIT | 70 | 1113:07 | 44.31 | 1.99 | 2.60 | 44.25 | 2.05 | 2.66 | 49.33 | 49.45 | -0.22 | 0.07 | -2.70 |
| 2024-25 | PIT | 61 | 796:15 | 37.15 | 1.58 | 2.12 | 39.26 | 2.49 | 2.21 | 38.89 | 48.96 | -0.58 | -0.56 | -0.44 |
| 2025-26 | PIT | 22 | 317:05 | 38.22 | 2.08 | 2.38 | 33.11 | 2.65 | 2.06 | 44.00 | 53.54 | -0.23 | -0.67 | 4.72 |
NHL Edge Stats
| Skating | Shooting | Zone Time | |||||||||||
|---|---|---|---|---|---|---|---|---|---|---|---|---|---|
| Season | GP | Top Speed | Bursts>20/mi | Avg. Speed | Top Speed | Avg. Speed | %Long Range | %Mid Range | %High Danger | ES DZ% | ES NZ% | ES OZ% | |
| This table is for Basic and Premium subscribers only. To view please login to and/or subscribe to one of our subscription plans. | |||||||||||||
Legend
| Percentile 0-25 | Percentile 25-50 | Percentile 50-75 | Percentile 75-100 |
5v5 Defense Pairs
| Season | Teammate | Team | TOI | GF/60 | GA/60 | GF% | xGF/60 | xGA/60 | xGF% | xGF Rel | xGA Rel | xGF% Rel |
|---|
Glossary
| Type | Statistic | Definition |
|---|---|---|
| Individual | G/60 | Goals Against per 60 minutes. |
| Individual | A/60 | Assists per 60 minutes. |
| Individual | Pts/60 | Points per 60 minutes. |
| Individual | xG/60 | Expected Goals per 60 minutes. |
| Individual | GAE/60 | Goals Above Expected (G/60 - xG/60). |
| Individual | Sh% | Shooting Percentage. |
| Individual | xSh% | Expected Shooting Percentage. |
| Individual | Sh%AE | Shooting percentage above expected (Sh% - xSh%). |
| Individual | %SA Rush | Percentage of shot attempts determined to be on the rush. |
| Individual | %SA Reb. | Percentage of shot attempts determined to be from rebounds. |
| On Ice | SAF/60 | Shot Attempts For per 60 minutes. |
| On Ice | GF/60 | Goals For per 60 minutes. |
| On Ice | xGF/60 | Expected Goals For per 60 minutes. |
| On Ice | SAA/60 | Shot Attempts Against per 60 minutes (lower is better). |
| On Ice | GA/60 | Goals Against per 60 minutes (lower is better). |
| On Ice | xGA/60 | Expected Goals Against per 60 minutes (lower is better). |
| On Ice | GF% | Goals For Percentage = Goals For / (Goals For + Goals Against) |
| On Ice | xGF% | Expected Goals For Percentage = Expected Goals For / (Expected Goals For + Expected Goals Against) |
| On Ice | xGF Rel | xGF/60 when On Ice - xGF/60 when not On Ice. |
| On Ice | xGA Rel | xGA/60 when On Ice - xGA/60 when not On Ice (lower is better). |
| On Ice | xGF% Rel | xGF% when On Ice - xGF% when not On Ice. |
News and Opinions
-
Penguins’ 5 Players With Most to Prove Entering 2026-27 at The Hockey Writers (Fri Jul 17, 2026)
-
Penguins’ 3 Worst Contracts Entering 2026-27 at The Hockey Writers (Wed Jul 15, 2026)
-
2025-26 Season in Review: Ryan Graves at Pens Burgh (Mon Jun 22, 2026)
-
Erik Karlsson to IR, Ryan Graves and Tristan Broz recalled from AHL at Pens Burgh (Tue Jan 13, 2026)
-
Red Wings must seriously consider claiming Pittsburgh Penguins castoff at Octopus Thrower (Wed Dec 31, 2025)
-
Pittsburgh Penguins Place Ryan Graves On NHL Waivers at The Hockey News (Tue Dec 30, 2025)
-
Rangers Continue to Be Haunted by Joe Sakic at The Hockey Writers (Sat Nov 29, 2025)
-
A Breakdown of Every Trade Tom Fitzgerald Has Made Since Becoming Devils General Manager at All About the Jersey (Wed Nov 19, 2025)
-
Heinen, Graves Look To Take Advantage Of Second-Chance Opportunity With Penguins at Yahoo Sports NHL (Thu Nov 6, 2025)
-
Penguins call up Heinen, Graves, Murashov; Jarry, Acciari, Brazeau to IR at Pens Burgh (Tue Nov 4, 2025)
-
Ryan Graves clears waivers, opening night roster takes shape at Pens Burgh (Sun Oct 5, 2025)
-
Graves, MacEwen Among 17 Players on Waivers – 10/04/25 at The Hockey Writers (Sat Oct 4, 2025)
-
Penguins waive Graves, send several young players to AHL at Pens Burgh (Sat Oct 4, 2025)
-
Les Penguins placent Ryan Graves au ballotage at HABSolument Fan (Sat Oct 4, 2025)
-
Can Penguins' Defenseman Bounce Back This Season? at Yahoo Sports (Sun Sep 7, 2025)
-
3 Ways Change Can Improve Penguins; From Coaches, Fans, to Defense at Yahoo Sports (Wed Aug 27, 2025)
-
What Will The Penguins' Left Side Look Like In 2025-26? at Yahoo Sports (Sun Aug 17, 2025)
-
Summer hypothetical: What does a bounce-back look like for Ryan Graves in 2025-26? at Pens Burgh (Wed Aug 6, 2025)
-
Summer hypothetical: What does a bounce-back look like for Ryan Graves in 2025-26? at Pens Burgh (Wed Aug 6, 2025)
-
What could a Ryan Graves bounce back look like in 2025-26? at Pens Burgh (Tue Aug 5, 2025)
-
Penguins Update: Can Ryan Graves (and His Game) Be Rebuilt? at PenguinPoop.com (Wed Jul 16, 2025)
-
Breaking Down The New Jersey Devils’ Unrestricted Free Agents at Devils Army (Mon Jun 5, 2023)
-
Devils Start Slow, Drop Game 1 In Carolina Big at Devils Army (Thu May 4, 2023)
-
Devils Fall to Clinical Lightning, Snap Three-Game Win Streak at Devils Army (Wed Mar 15, 2023)
-
Devils Stun Blue Jackets With Last-Second Victory at Devils Army (Wed Feb 15, 2023)
-
Vanecek, Hischier Lead Devils To Seventh-Straight Win at Devils Army (Wed Nov 9, 2022)
-
2021-2022 New Jersey Devils Team Awards at Devils Army (Mon May 2, 2022)
-
Pregame: Hamilton, Tatar Set To Make Preseason Debuts Against Rangers at Devils Army (Fri Oct 1, 2021)
-
Projecting The New Jersey Devils’ Protection List Ahead Of Saturday’s Deadline at Devils Army (Fri Jul 16, 2021)
-
New Jersey Devils Acquire Top-Four Defenseman Ryan Graves at Devils Army (Fri Jul 16, 2021)
Current Contract
Ryan Graves signed a $27,000,000 6-year contract with the Pittsburgh Penguins and General Manager Kyle Dubas on July 1, 2023 with an AAV of $4,500,000. This contract will start in 2023-24 and end after the 2028-29 season. In the first season of the contract the cap hit was equivalent to 5.39% of the salary cap.
Standard Contract (UFA) ( ) (0 ratings)
Ryan Graves signed a $9,500,000 3-year contract with the Colorado Avalanche and General Manager Joe Sakic on October 12, 2020 with an AAV of $3,166,667. This contract will start in 2020-21 and end after the 2022-23 season. In the first season of the contract the cap hit was equivalent to 3.89% of the salary cap.
Standard Contract (RFA) ( ) (0 ratings)
| Season | Age* | Clause | Cap Hit | AAV | Perf. Bonus | Sign. Bonus | Salary | Compensation | Minors Salary | Status | |
|---|---|---|---|---|---|---|---|---|---|---|---|
| 2020-21 | 25 | $3,166,667 | $3,166,667 | - | - | $2,500,000 | $2,500,000 | $2,500,000 | RFA-arb | ||
| 2021-22 | 26 | $3,166,667 | $3,166,667 | - | - | $3,000,000 | $3,000,000 | $3,000,000 | RFA-arb | ||
| 2022-23 | 27 | $3,166,667 | $3,166,667 | - | - | $4,000,000 | $4,000,000 | $4,000,000 | UFA | ||
| Total | - | - | $9,500,000 | $9,500,000 | $9,500,000 |
Ryan Graves signed a $735,000 1-year contract with the Colorado Avalanche and General Manager Joe Sakic on July 8, 2019 with an AAV of $735,000. This contract will start in 2019-20 and end after the 2019-20 season. In the first season of the contract the cap hit was equivalent to 0.90% of the salary cap.
Standard Contract (RFA) ( ) (0 ratings)
| Season | Age* | Clause | Cap Hit | AAV | Perf. Bonus | Sign. Bonus | Salary | Compensation | Minors Salary | Status | |
|---|---|---|---|---|---|---|---|---|---|---|---|
| 2019-20 | 24 | $735,000 | $735,000 | - | - | $735,000 | $735,000 | $350,000 | RFA-arb | ||
| Total | - | - | $735,000 | $735,000 | $350,000 |
Ryan Graves signed a $650,000 1-year contract with the Colorado Avalanche and General Manager Joe Sakic on July 16, 2018 with an AAV of $650,000. This contract will start in 2018-19 and end after the 2018-19 season. In the first season of the contract the cap hit was equivalent to 0.82% of the salary cap.
Standard Contract (RFA) ( ) (0 ratings)
| Season | Age* | Clause | Cap Hit | AAV | Perf. Bonus | Sign. Bonus | Salary | Compensation | Minors Salary | Status | |
|---|---|---|---|---|---|---|---|---|---|---|---|
| 2018-19 | 23 | $650,000 | $650,000 | - | - | $650,000 | $650,000 | $85,000 | RFA | ||
| Total | - | - | $650,000 | $650,000 | $85,000 |
Ryan Graves signed a $2,060,000 3-year contract with the New York Rangers and General Manager Glen Sather on March 17, 2014 with an AAV of $660,000. This contract will start in 2014-15 and end after the 2017-18 season. In the first season of the contract the cap hit was equivalent to 0.96% of the salary cap.
Entry Level Contract ( ) (0 ratings)
| Season | Age* | Clause | Cap Hit | AAV | Perf. Bonus | Sign. Bonus | Salary | Compensation | Minors Salary | Status | |
|---|---|---|---|---|---|---|---|---|---|---|---|
| 2014-15 | 19 | $660,000 | $850,000 | - | $90,000 | - | $90,000 | - | ELC | ||
| 2015-16 | 20 | $656,667 | $846,667 | $260,000 | $85,000 | $575,000 | $660,000 | $65,000 | ELC | ||
| 2016-17 | 21 | $656,667 | $846,667 | $190,000 | $80,000 | $580,000 | $660,000 | $67,500 | ELC | ||
| 2017-18 | 22 | $656,667 | $846,667 | $120,000 | - | $650,000 | $650,000 | $67,500 | ELC | ||
| Total | $570,000 | $255,000 | $1,805,000 | $2,060,000 | $200,000 |
Career Statistics
| Regular Season | Playoffs | |||||||||||||||||||
|---|---|---|---|---|---|---|---|---|---|---|---|---|---|---|---|---|---|---|---|---|
| Season | League | Team | GP | G | A | Pts | +/- | PIM | Shots | Sh% | TOI/G | GP | G | A | Pts | +/- | PIM | Shots | Sh% | TOI/G |
| 2010-11 | NSMHL | South Shore | 32 | 5 | 7 | 12 | 58 | 5 | 6 | 6 | 8 | |||||||||
| 2010-11 | MJrHL | Yarmouth | 1 | 0 | 0 | 0 | 2 | 3 | 2 | |||||||||||
| 2011-12 | QMJHL | P.E.I. | 62 | 2 | 7 | 9 | -23 | 34 | ||||||||||||
| 2012-13 | QMJHL | P.E.I. | 68 | 3 | 13 | 16 | +7 | 90 | 81 | 370.0 | 6 | -2 | 6 | 7 | 0.0 | |||||
| 2013-14 | QMJHL | Charlottetown | 39 | 3 | 9 | 12 | -2 | 52 | 101 | 300.0 | ||||||||||
| 2013-14 | QMJHL | Val-d'Or | 26 | 2 | 8 | 10 | +22 | 16 | 65 | 310.0 | 24 | 1 | 7 | 8 | +12 | 24 | ||||
| 2013-14 | M-Cup | Val-d'Or | 4 | 2 | 2 | +1 | 4 | |||||||||||||
| 2014-15 | QMJHL | Quebec | 50 | 15 | 24 | 39 | +17 | 49 | 160 | 940.0 | 21 | 5 | 6 | 11 | +11 | 25 | 60 | 830.0 | ||
| 2014-15 | M-Cup | Quebec | 5 | 2 | 3 | 5 | +1 | 4 | 11 | 1,820.0 | ||||||||||
| 2015-16 | AHL | Hartford | 74 | 9 | 12 | 21 | +6 | 53 | 150 | 600.0 | ||||||||||
| 2016-17 | AHL | Hartford Wolf Pack | 76 | 8 | 22 | 30 | -17 | 69 | ||||||||||||
| 2017-18 | AHL | Hartford Wolf Pack | 57 | 4 | 7 | 11 | -15 | 66 | ||||||||||||
| 2017-18 | AHL | San Antonio Rampage | 21 | 1 | 5 | 6 | -5 | 7 | ||||||||||||
| 2018-19 | AHL | Colorado Eagles | 32 | 2 | 7 | 9 | +4 | 26 | ||||||||||||
| 2018-19 | NHL | Colorado Avalanche | 26 | 3 | 2 | 5 | +4 | 2 | 26 | 11.5 | 11:06 | |||||||||
| 2019-20 | NHL | Colorado Avalanche | 69 | 9 | 17 | 26 | +40 | 45 | 134 | 6.7 | 18:57 | 15 | 1 | 2 | 3 | +9 | 6 | 33 | 3.0 | 20:11 |
| 2020-21 | NHL | Colorado Avalanche | 54 | 2 | 13 | 15 | +15 | 55 | 101 | 2.0 | 19:03 | 10 | 1 | 5 | 6 | +5 | 10 | 15 | 6.7 | 18:31 |
| 2021-22 | NHL | New Jersey Devils | 75 | 6 | 22 | 28 | -9 | 24 | 111 | 5.4 | 20:43 | |||||||||
| 2021-22 | WC | Canada | 10 | 2 | 5 | 7 | +8 | |||||||||||||
| 2022-23 | NHL | New Jersey Devils | 78 | 8 | 18 | 26 | +34 | 28 | 141 | 5.7 | 19:57 | 10 | 1 | 1 | -1 | 4 | 9 | 0.0 | 19:48 | |
| 2023-24 | NHL | Pittsburgh Penguins | 70 | 3 | 11 | 14 | +10 | 30 | 77 | 3.9 | 18:23 | |||||||||
| 2024-25 | NHL | Pittsburgh Penguins | 61 | 1 | 3 | 4 | -15 | 29 | 39 | 2.6 | 14:59 | |||||||||
| 2025-26 | NHL | Pittsburgh Penguins | 22 | 1 | 0 | 1 | -3 | 10 | 21 | 4.8 | 15:18 | |||||||||
| 2025-26 | AHL | Wilkes-Barre/Scranton Penguins | 15 | 3 | 7 | 10 | +4 | 4 | ||||||||||||
| NHL Career | 455 | 33 | 86 | 119 | +76 | 223 | 650 | 5.1 | 18:11 | 35 | 2 | 8 | 10 | +13 | 20 | 57 | 3.5 | 19:36 | ||