If you enjoy TheStanleyCap.com and want to keep it ad-free and support future growth please consider subscribing or making a donation.
Your support is greatly appreciated.
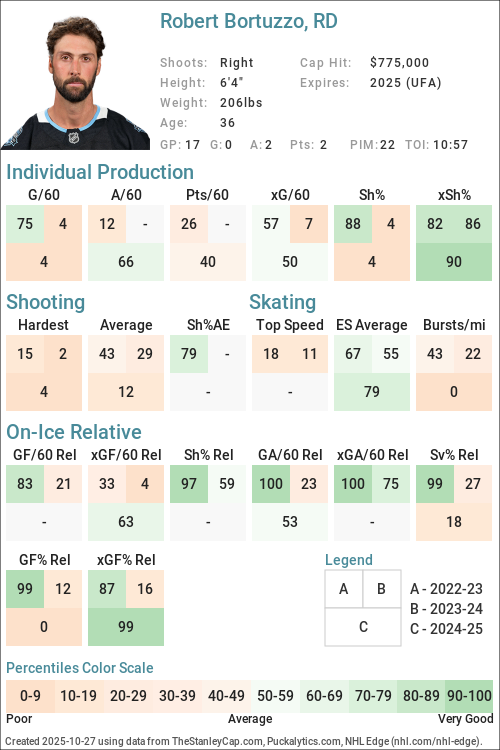
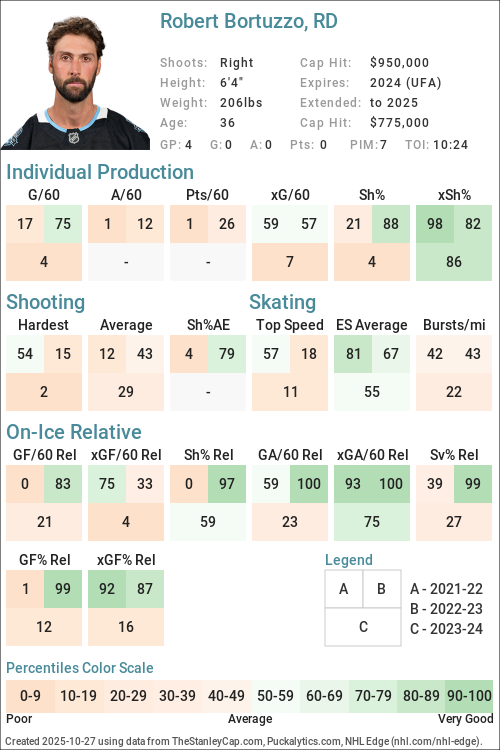
Player cards present an infographic of a players performance using a series of Player Archetypes
developed for Puckalytics.com and TheStanleyCap.com. The boxes in the rink image show the
archetype ratings for the season specified in the card while the graphs to the right show
the five-year trends for those archetypes.
Except for Faceoffs, the values shown are the players z-score (standard deviation from the mean) for the specific metric used to calculate the archetype values.
When calculating z-scores forwards were compared to forwards and defensemen were compared to defensemen.
Positive values indicate the player is above average and shaded in blue, while negative values indicate the player is below average and shaded in pink.
The five year trend charts show a range of -4.0 to 4.0.
The value shown for Faceoffs is the faceoff winning percentage rather than their z-score with winning percentages below 50 in pink shades and above 50 in blue shades.
All archetypes are 5v5 except 5v4 TOI, 4v5 TOI, Skating (even strength) and Faceoffs (all situations). Archetypes use regular season data only.
Archetypes Summary
Sniper - Measures the to score above the expected goal rate.
Rebound - Measures the percent of a players shot attempts that come from rebounds (forwards only).
5v4 TOI - Powerplay ice time, calculated as the percentage of his teams 5v4 ice time that the player was on the ice for.
Shooter - Measures whether a players points come from shots (goals or assists on rebounds from his shots).
Producer - Measures a players ability to produce goals and assists, adjusted for quality of teammates.
Playmaker - Measures whether a players points come from passes.
Drive - Measures a players ability to drive puck possession and generate shot attempts for his team.
Rush - Measures the percent of a players shot attempts that come from rush plays
Possession - An indicator of a players ability to improve his teams puck possession game.
You are free to use include player cards in written articles, share on social media, or on other public websites under the following conditions:
You credit TheStanleyCap.com as the source and provide a link back to TheStanleyCap.com or this player page.
You do not mass copy/duplicate/publish dozens or hundreds of player cards. A few, or a handful for a written article is fine. Be reasonable. Fair use rules apply.
If you are a high-traffic website you must download and host the image(s) on your site rather than overload TheStanleyCap servers with traffic.
Note: Player cards will update daily throughout the season so if you want to include snapshot then you must download the image.
If you have any questions, send an e-mail to the e-mail address at the top of this page.
This table is for Basic and Premium subscribers only.
To view please login to and/or subscribe to one of our subscription plans.
Legend
Percentile 0-25
Percentile 25-50
Percentile 50-75
Percentile 75-100
Forwards are compared with forwards and Defensemen are are compared with Defensemen.
5v5 Defense Pairs
Season
Season
Teammate
Team
TOI
GF/60
GA/60
GF%
xGF/60
xGA/60
xGF%
xGF Rel
xGA Rel
xGF% Rel
This table is for Basic and Premium subscribers only.
To view please login to and/or subscribe to one of our subscription plans.
2021-22 2022-23 2023-24 2024-25 2025-26 2026-27 2027-28 2028-29 2030-31 2031-32 2032-33 2033-34 2034-35
Glossary
Type
Statistic
Definition
Individual
G/60
Goals Against per 60 minutes.
Individual
A/60
Assists per 60 minutes.
Individual
Pts/60
Points per 60 minutes.
Individual
xG/60
Expected Goals per 60 minutes.
Individual
GAE/60
Goals Above Expected (G/60 - xG/60).
Individual
Sh%
Shooting Percentage.
Individual
xSh%
Expected Shooting Percentage.
Individual
Sh%AE
Shooting percentage above expected (Sh% - xSh%).
Individual
%SA Rush
Percentage of shot attempts determined to be on the rush.
Individual
%SA Reb.
Percentage of shot attempts determined to be from rebounds.
On Ice
SAF/60
Shot Attempts For per 60 minutes.
On Ice
GF/60
Goals For per 60 minutes.
On Ice
xGF/60
Expected Goals For per 60 minutes.
On Ice
SAA/60
Shot Attempts Against per 60 minutes (lower is better).
On Ice
GA/60
Goals Against per 60 minutes (lower is better).
On Ice
xGA/60
Expected Goals Against per 60 minutes (lower is better).
On Ice
GF%
Goals For Percentage = Goals For / (Goals For + Goals Against)
On Ice
xGF%
Expected Goals For Percentage = Expected Goals For / (Expected Goals For + Expected Goals Against)
On Ice
xGF Rel
xGF/60 when On Ice - xGF/60 when not On Ice.
On Ice
xGA Rel
xGA/60 when On Ice - xGA/60 when not On Ice (lower is better).
Robert Bortuzzo signed a $775,000 1-year contract with the Utah Hockey Club and General Manager Bill Armstrong on August 31, 2024 with an AAV of $775,000. This contract will start in 2024-25 and end after the 2024-25 season. In the first season of the contract the cap hit was equivalent to 0.88% of the salary cap.
Robert Bortuzzo signed a $1,900,000 2-year contract with the St. Louis Blues and General Manager Doug Armstrong on February 8, 2022 with an AAV of $950,000. This contract will start in 2022-23 and end after the 2023-24 season. In the first season of the contract the cap hit was equivalent to 1.15% of the salary cap.
Robert Bortuzzo signed a $4,125,000 3-year contract with the St. Louis Blues and General Manager Doug Armstrong on December 15, 2018 with an AAV of $1,375,000. This contract will start in 2019-20 and end after the 2021-22 season. In the first season of the contract the cap hit was equivalent to 1.69% of the salary cap.
Robert Bortuzzo signed a $2,300,000 2-year contract with the St. Louis Blues and General Manager Doug Armstrong on December 29, 2016 with an AAV of $1,150,000. This contract will start in 2017-18 and end after the 2018-19 season. In the first season of the contract the cap hit was equivalent to 1.53% of the salary cap.
Robert Bortuzzo signed a $2,100,000 2-year contract with the St. Louis Blues and General Manager Doug Armstrong on July 2, 2015 with an AAV of $1,050,000. This contract will start in 2015-16 and end after the 2016-17 season. In the first season of the contract the cap hit was equivalent to 1.47% of the salary cap.
Robert Bortuzzo signed a $1,200,000 2-year contract with the Pittsburgh Penguins and General Manager Ray Shero on June 24, 2013 with an AAV of $600,000. This contract will start in 2013-14 and end after the 2014-15 season. In the first season of the contract the cap hit was equivalent to 0.93% of the salary cap.
Robert Bortuzzo signed a $525,000 1-year contract with the Pittsburgh Penguins and General Manager Ray Shero on August 30, 2012 with an AAV of $525,000. This contract will start in 2012-13 and end after the 2012-13 season. In the first season of the contract the cap hit was equivalent to 0.88% of the salary cap.
Robert Bortuzzo signed a $1,605,000 3-year contract with the Pittsburgh Penguins and General Manager Ray Shero on March 23, 2009 with an AAV of $535,000. This contract will start in 2009-10 and end after the 2011-12 season. In the first season of the contract the cap hit was equivalent to 0.94% of the salary cap.