
 Pierre-Luc Dubois
| Position | Center | Current Team | Washington Capitals |
| Shoots | Left | Current Contract | 8 years ($8.5M CapHit) |
| Height | 6'4" | Expires | 2030-31 |
| Weight (lbs) | 220 | Expiry Age (Jun 30) | 33 |
| Age (DOB) | 28 (June 24, 1998) | Expiry Status | UFA |
| Drafted | 2016, Round 1, Overall 3 (CBJ) |
| Date | Team | Transaction | |
|---|---|---|---|
| Feb 5, 2026 | Washington Capitals | Activated from IR | |
| Nov 3, 2025 | Washington Capitals | Placed on IR | |
| Oct 25, 2025 | Washington Capitals | Activated from IR | |
| Oct 19, 2025 | Washington Capitals | Placed on IR | |
| Oct 18, 2025 | Washington Capitals | Placed on IR | |
| Jun 27, 2023 | Winnipeg Jets | Signed 8 years @ $8.500M AAV starting in 2023-24 | |
| Jul 22, 2022 | Winnipeg Jets | Signed 1 year @ $6.000M AAV starting in 2022-23 | |
| Dec 31, 2020 | Columbus Blue Jackets | Signed 2 years @ $5.000M AAV starting in 2020-21 | |
| Jun 29, 2016 | Columbus Blue Jackets | Signed to an entry level contract. |
Player Card(s)

URL: https://thestanleycap.com/cdn/player_cards/20252026/pierre-luc-dubois-8479400.png
URL: https://thestanleycap.com/cdn/player_cards/20242025/pierre-luc-dubois-8479400.png
URL: https://thestanleycap.com/cdn/player_cards/20232024/pierre-luc-dubois-8479400.png
About Player Cards
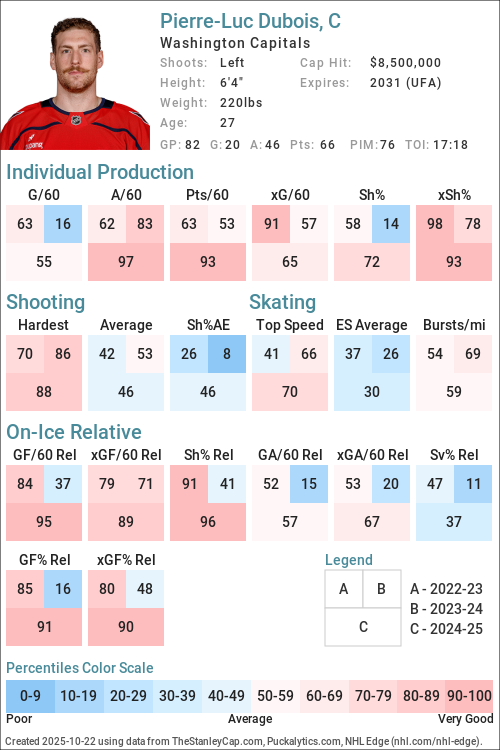
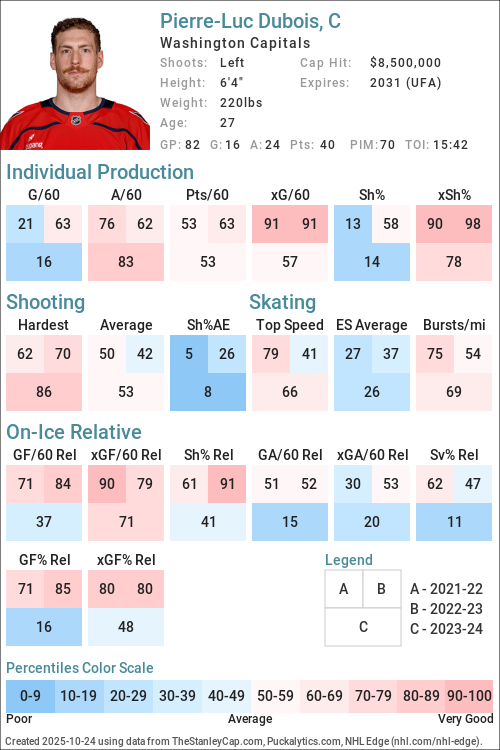
Player cards present an infographic of a players performance using a series of Player Archetypes developed for Puckalytics.com and TheStanleyCap.com. The boxes in the rink image show the archetype ratings for the season specified in the card while the graphs to the right show the five-year trends for those archetypes.
Except for Faceoffs, the values shown are the players z-score (standard deviation from the mean) for the specific metric used to calculate the archetype values. When calculating z-scores forwards were compared to forwards and defensemen were compared to defensemen. Positive values indicate the player is above average and shaded in blue, while negative values indicate the player is below average and shaded in pink. The five year trend charts show a range of -4.0 to 4.0.
The value shown for Faceoffs is the faceoff winning percentage rather than their z-score with winning percentages below 50 in pink shades and above 50 in blue shades.
All archetypes are 5v5 except 5v4 TOI, 4v5 TOI, Skating (even strength) and Faceoffs (all situations). Archetypes use regular season data only.
Archetypes Summary
- Sniper - Measures the to score above the expected goal rate.
- Rebound - Measures the percent of a players shot attempts that come from rebounds (forwards only).
- 5v4 TOI - Powerplay ice time, calculated as the percentage of his teams 5v4 ice time that the player was on the ice for.
- Shooter - Measures whether a players points come from shots (goals or assists on rebounds from his shots).
- Producer - Measures a players ability to produce goals and assists, adjusted for quality of teammates.
- Playmaker - Measures whether a players points come from passes.
- Drive - Measures a players ability to drive puck possession and generate shot attempts for his team.
- Rush - Measures the percent of a players shot attempts that come from rush plays
- Possession - An indicator of a players ability to improve his teams puck possession game.
- Faceoffs - Faceoff Winning Percentage (min. 75 faceoffs taken).
- 5v5 TOI - The percentage of his teams 5v5 TOI that the player was on the ice for.
- Suppress - Measures a players ability to suppress opponent puck possession and shot attempts against.
- Skating - An indicator of a players skating ability, or speed bursts above 20mph per mile skated.
- Defend - An indicator of a players ability to suppress shot quality against.
- 4v5 TOI - Penalty Kill ice time, calculated as the percentage of his teams 4v5 ice time that the player was on the ice for.
Data Sources
- Salary data is from TheStanleyCap.com
- Skating data is from NHL Edge
- Other statistics are from Puckalytics.com and derived from data from NHL.com
Terms of Use
You are free to use include player cards in written articles, share on social media, or on other public websites under the following conditions:
- You credit TheStanleyCap.com as the source and provide a link back to TheStanleyCap.com or this player page.
- You do not mass copy/duplicate/publish dozens or hundreds of player cards. A few, or a handful for a written article is fine. Be reasonable. Fair use rules apply.
- If you are a high-traffic website you must download and host the image(s) on your site rather than overload TheStanleyCap servers with traffic.
Note: Player cards will update daily throughout the season so if you want to include snapshot then you must download the image.
If you have any questions, send an e-mail to the e-mail address at the top of this page.
Read Introducing Player Archetypes on HockeyAnalysis.com for more details on archetype calculations.
Core Archetypes
| Season | Team(s) | GP | TOI | Producer | Playmaker | Shooter | Sniper | Rebound | Rush | Skating | Defend |
|---|---|---|---|---|---|---|---|---|---|---|---|
| 2017-18 | CBJ | 82 | -0.42 | -0.21 | -0.48 | -0.35 | -0.10 | -0.21 | - | 0.18 | |
| 2018-19 | CBJ | 82 | 0.40 | -0.09 | 0.48 | 0.70 | -0.16 | -0.59 | - | -0.64 | |
| 2019-20 | CBJ | 70 | 0.99 | -0.03 | 1.17 | 0.91 | -0.30 | 0.67 | - | -0.76 | |
| 2020-21 | CBJ, WPG | 46 | -0.71 | -0.92 | -0.04 | 0.22 | 0.27 | -0.50 | - | -1.22 | |
| 2021-22 | WPG | 81 | -0.16 | 0.21 | -0.67 | -1.67 | -0.51 | 0.85 | 0.59 | 0.27 | |
| 2022-23 | WPG | 73 | 0.09 | 0.20 | -0.23 | -0.51 | -0.39 | 0.61 | -0.09 | -0.05 | |
| 2023-24 | LAK | 82 | 0.23 | 1.02 | -0.74 | -1.42 | 0.70 | 0.15 | 0.38 | -1.13 | |
| 2024-25 | WSH | 82 | 1.01 | 1.93 | -0.51 | -0.31 | -0.28 | -0.41 | 0.09 | -0.32 | |
| 2025-26 | WSH | 29 | -0.12 | 1.88 | -1.27 | -1.10 | 0.44 | -0.16 | -0.10 | -1.89 |
Situational and Secondary Archetypes
| Season | Team(s) | GP | TOI | 5v5 TOI | 5v4 TOI | 4v5 TOI | Possession | Drive | Suppress | Faceoffs |
|---|---|---|---|---|---|---|---|---|---|---|
| 2017-18 | CBJ | 82 | 0.79 | 0.06 | -1.74 | 1.65 | 1.50 | 0.94 | 43.8 | |
| 2018-19 | CBJ | 82 | 0.99 | 0.47 | -1.65 | 0.97 | 1.51 | -0.47 | 43.5 | |
| 2019-20 | CBJ | 70 | 0.84 | 0.76 | -1.74 | 0.58 | 0.90 | -0.28 | 44.6 | |
| 2020-21 | CBJ, WPG | 46 | 0.20 | -0.33 | -2.18 | 1.26 | 0.78 | 1.24 | 43.5 | |
| 2021-22 | WPG | 81 | 1.38 | 1.06 | -1.99 | 0.54 | 1.03 | -0.64 | 46.9 | |
| 2022-23 | WPG | 73 | 1.05 | 1.10 | -1.84 | 0.67 | 0.61 | 0.25 | 48.9 | |
| 2023-24 | LAK | 82 | 0.42 | 0.13 | -1.96 | -0.41 | 0.01 | -0.78 | 49.7 | |
| 2024-25 | WSH | 82 | 0.92 | 0.22 | -1.96 | 1.07 | 0.98 | 0.38 | 49.7 | |
| 2025-26 | WSH | 29 | 0.63 | 0.22 | -1.71 | 0.41 | 0.37 | 0.10 | 47.3 |
5v5 Individual Stats
| Season | Team(s) | GP | TOI | G/60 | A/60 | Pts/60 | xG/60 | GAE/60 | Sh% | xSh% | Sh%AE | %SA Rush | %SA Reb. |
|---|---|---|---|---|---|---|---|---|---|---|---|---|---|
| 2017-18 | CBJ | 82 | 1137:41 | 0.63 | 0.90 | 1.53 | 0.72 | -0.08 | 9.30 | 10.51 | -1.21 | 3.55 | 4.73 |
| 2018-19 | CBJ | 82 | 1173:19 | 1.02 | 1.18 | 2.20 | 0.85 | 0.17 | 13.51 | 11.29 | 2.22 | 2.91 | 4.85 |
| 2019-20 | CBJ | 70 | 957:01 | 0.94 | 1.07 | 2.01 | 0.73 | 0.21 | 13.76 | 10.62 | 3.14 | 5.30 | 5.30 |
| 2020-21 | WPG | 41 | 529:09 | 0.57 | 0.68 | 1.25 | 0.56 | 0.01 | 9.62 | 9.52 | 0.10 | 2.99 | 7.46 |
| 2020-21 | CBJ | 5 | 62:40 | 0.96 | 0.00 | 0.96 | 0.44 | 0.51 | 16.67 | 7.72 | 8.94 | 0.00 | 0.00 |
| 2020-21 | CBJ, WPG | 46 | 591:49 | 0.61 | 0.61 | 1.22 | 0.55 | 0.06 | 10.34 | 9.33 | 1.01 | 2.67 | 6.67 |
| 2021-22 | WPG | 81 | 1188:14 | 0.45 | 1.21 | 1.67 | 0.95 | -0.49 | 5.66 | 11.78 | -6.12 | 5.70 | 4.82 |
| 2022-23 | WPG | 73 | 999:58 | 0.78 | 1.08 | 1.86 | 0.95 | -0.17 | 10.83 | 13.25 | -2.41 | 5.00 | 6.00 |
| 2023-24 | LAK | 82 | 1052:03 | 0.40 | 1.25 | 1.65 | 0.73 | -0.33 | 6.42 | 11.72 | -5.30 | 4.19 | 10.18 |
| 2024-25 | WSH | 82 | 1140:18 | 0.68 | 1.68 | 2.37 | 0.75 | -0.07 | 12.87 | 14.17 | -1.29 | 1.80 | 6.59 |
| 2025-26 | WSH | 29 | 372:51 | 0.32 | 1.45 | 1.77 | 0.56 | -0.24 | 7.14 | 12.36 | -5.22 | 2.38 | 9.52 |
5v5 On Ice Stats
| Season | Team(s) | GP | TOI | SAF/60 | GF/60 | xGF/60 | SAA/60 | GA/60 | xGA/60 | GF% | xGF% | xGF Rel | xGA Rel | xGF% Rel |
|---|---|---|---|---|---|---|---|---|---|---|---|---|---|---|
| 2017-18 | CBJ | 82 | 1137:41 | 50.73 | 2.64 | 2.91 | 39.24 | 2.16 | 2.46 | 54.95 | 54.23 | 0.46 | -0.00 | 4.33 |
| 2018-19 | CBJ | 82 | 1173:19 | 47.30 | 3.73 | 2.97 | 41.83 | 2.76 | 2.61 | 57.48 | 53.25 | 0.54 | 0.21 | 2.88 |
| 2019-20 | CBJ | 70 | 957:01 | 44.95 | 2.57 | 2.70 | 40.88 | 2.45 | 2.33 | 51.25 | 53.67 | 0.51 | 0.19 | 3.10 |
| 2020-21 | WPG | 41 | 529:09 | 40.48 | 2.15 | 2.28 | 38.44 | 2.61 | 2.59 | 45.24 | 46.87 | 0.18 | 0.04 | 1.58 |
| 2020-21 | CBJ | 5 | 62:40 | 35.43 | 0.96 | 1.66 | 39.26 | 1.91 | 1.95 | 33.33 | 45.86 | -0.19 | -0.26 | 0.37 |
| 2020-21 | CBJ, WPG | 46 | 591:49 | 39.94 | 2.03 | 2.22 | 38.53 | 2.53 | 2.52 | 44.44 | 46.78 | 0.14 | 0.01 | 1.48 |
| 2021-22 | WPG | 81 | 1188:14 | 46.46 | 2.63 | 3.00 | 44.69 | 2.47 | 2.73 | 51.49 | 52.31 | 0.49 | 0.09 | 3.64 |
| 2022-23 | WPG | 73 | 999:58 | 45.72 | 2.94 | 2.95 | 39.90 | 2.10 | 2.51 | 58.33 | 54.09 | 0.27 | 0.00 | 2.35 |
| 2023-24 | LAK | 82 | 1052:03 | 45.85 | 2.28 | 2.77 | 39.52 | 2.57 | 2.40 | 47.06 | 53.53 | 0.23 | 0.32 | -1.37 |
| 2024-25 | WSH | 82 | 1140:18 | 44.94 | 3.74 | 2.95 | 38.31 | 2.32 | 2.36 | 61.74 | 55.56 | 0.53 | -0.13 | 6.29 |
| 2025-26 | WSH | 29 | 372:51 | 39.75 | 3.06 | 2.86 | 40.39 | 2.90 | 2.54 | 51.35 | 52.95 | 0.19 | -0.14 | 3.03 |
NHL Edge Stats
| Skating | Shooting | Zone Time | |||||||||||
|---|---|---|---|---|---|---|---|---|---|---|---|---|---|
| Season | GP | Top Speed | Bursts>20/mi | Avg. Speed | Top Speed | Avg. Speed | %Long Range | %Mid Range | %High Danger | ES DZ% | ES NZ% | ES OZ% | |
| This table is for Basic and Premium subscribers only. To view please login to and/or subscribe to one of our subscription plans. | |||||||||||||
Legend
| Percentile 0-25 | Percentile 25-50 | Percentile 50-75 | Percentile 75-100 |
5v5 Lines
| Season | Teammate | Teammate | Team | TOI | GF/60 | GA/60 | GF% | xGF/60 | xGA/60 | xGF% | xGF Rel | xGA Rel | xGF% Rel |
|---|
Glossary
| Type | Statistic | Definition |
|---|---|---|
| Individual | G/60 | Goals Against per 60 minutes. |
| Individual | A/60 | Assists per 60 minutes. |
| Individual | Pts/60 | Points per 60 minutes. |
| Individual | xG/60 | Expected Goals per 60 minutes. |
| Individual | GAE/60 | Goals Above Expected (G/60 - xG/60). |
| Individual | Sh% | Shooting Percentage. |
| Individual | xSh% | Expected Shooting Percentage. |
| Individual | Sh%AE | Shooting percentage above expected (Sh% - xSh%). |
| Individual | %SA Rush | Percentage of shot attempts determined to be on the rush. |
| Individual | %SA Reb. | Percentage of shot attempts determined to be from rebounds. |
| On Ice | SAF/60 | Shot Attempts For per 60 minutes. |
| On Ice | GF/60 | Goals For per 60 minutes. |
| On Ice | xGF/60 | Expected Goals For per 60 minutes. |
| On Ice | SAA/60 | Shot Attempts Against per 60 minutes (lower is better). |
| On Ice | GA/60 | Goals Against per 60 minutes (lower is better). |
| On Ice | xGA/60 | Expected Goals Against per 60 minutes (lower is better). |
| On Ice | GF% | Goals For Percentage = Goals For / (Goals For + Goals Against) |
| On Ice | xGF% | Expected Goals For Percentage = Expected Goals For / (Expected Goals For + Expected Goals Against) |
| On Ice | xGF Rel | xGF/60 when On Ice - xGF/60 when not On Ice. |
| On Ice | xGA Rel | xGA/60 when On Ice - xGA/60 when not On Ice (lower is better). |
| On Ice | xGF% Rel | xGF% when On Ice - xGF% when not On Ice. |
News and Opinions
-
Pierre-Luc Dubois avoue être frustré de voir Vegas en finale at HABSolument Fan (Wed Jun 10, 2026)
-
Pierre-Luc Dubois frustré, Tony Marinaro au carré et deux nouveaux entraîneurs-chef at Dans Les Coulisses (Wed Jun 10, 2026)
-
Pierre-Luc Dubois: 2025-26 season review at Russian Machine Never Breaks (Wed May 27, 2026)
-
Injury to Dubois Most Likely Cost Caps a Playoff Spot at Stars and Sticks (Mon Apr 20, 2026)
-
Pierre-Luc Dubois played with a broken hand at the end of the season, hopes to avoid surgery: ‘Just part of the frustrating year’ at Russian Machine Never Breaks (Thu Apr 16, 2026)
-
Pierre-Luc Dubois and Rasmus Sandin listed as game-time decisions, Logan Thompson to start for Capitals at Russian Machine Never Breaks (Sun Apr 12, 2026)
-
Pierre-Luc Dubois leaves Capitals game against Penguins after suffering upper-body injury at Russian Machine Never Breaks (Sat Apr 11, 2026)
-
Game Breakdown: Flyers suffer tough 6-4 loss to Capitals at Flyers Nitty Gritty (Wed Apr 1, 2026)
-
Pierre-Luc Dubois reportedly not expected to receive supplemental discipline after match penalty at Russian Machine Never Breaks (Wed Mar 25, 2026)
-
Pierre-Luc Dubois est chassé du match pour avoir tenté de blesser Robert Thomas at HABSolument Fan (Wed Mar 25, 2026)
-
Pierre-Luc Dubois assessed match penalty, could face suspension after tackling Blues forward Robert Thomas: ‘There was no malicious intent, it felt like’ at Russian Machine Never Breaks (Wed Mar 25, 2026)
-
Capitals' Pierre-Luc Dubois Ejected For Intent To Injure Blues' Robert Thomas at The Hockey News (Wed Mar 25, 2026)
-
Pierre-Luc Dubois praises Cole Hutson’s cooking skills, roasting Ryan Leonard in the process: ‘Leno didn’t do anything’ at Russian Machine Never Breaks (Tue Mar 24, 2026)
-
How Cole Hutson ended up picking ‘Great Balls of Fire’ as his goal song with help from Pierre-Luc Dubois at Russian Machine Never Breaks (Fri Mar 20, 2026)
-
Pierre-Luc Dubois invites Cole Hutson to stay at his house: ‘Last year with Ryan (Leonard) was a lot of fun, so doing it again was a no-brainer’ at Russian Machine Never Breaks (Tue Mar 17, 2026)
-
Revisiting Blue Jackets and Jets’ Dubois for Laine Trade at The Hockey Writers (Thu Mar 12, 2026)
-
Pierre-Luc Dubois scores 2 goals as the Capitals beat the Golden Knights 3-2 at Yahoo Sports NHL (Sat Feb 28, 2026)
-
Fantasy Hockey Waiver Wire: Pierre-Luc Dubois, Devon Toews among top options heading into weekend at Yahoo Sports NHL (Fri Feb 27, 2026)
-
Pierre-Luc Dubois on his return against Nashville after missing 59 games due to injury: ‘There were a few times I thought I might throw up’ at Russian Machine Never Breaks (Fri Feb 6, 2026)
-
Dubois scores in his return for Washington, and the Capitals beat the Predators 4-2 at Yahoo Sports NHL (Thu Feb 5, 2026)
-
Pierre-Luc Dubois scores first goal of season in first game back from extended injury absence at Russian Machine Never Breaks (Thu Feb 5, 2026)
-
Capitals activate Dubois, Thompson before break at ESPN (Thu Feb 5, 2026)
-
Capitals activate Dubois and Thompson prior to their final game before the Olympic break at Yahoo Sports NHL (Thu Feb 5, 2026)
-
Why Pierre-Luc Dubois is returning from injury the game before the Olympic break at Russian Machine Never Breaks (Thu Feb 5, 2026)
-
Capitals activate Pierre-Luc Dubois and Logan Thompson from injured reserve, return goaltender Garin Bjorklund to AHL’s Hershey Bears at Russian Machine Never Breaks (Thu Feb 5, 2026)
-
Pierre-Luc Dubois to make long-awaited return from injury for Capitals against Predators at Russian Machine Never Breaks (Thu Feb 5, 2026)
-
Pierre-Luc Dubois skates with Capitals teammates for first time since undergoing surgery in November at Russian Machine Never Breaks (Sun Jan 11, 2026)
-
Pierre-Luc Dubois has started skating again, but Capitals do not expect him back before NHL’s Winter Olympics break at Russian Machine Never Breaks (Sat Jan 3, 2026)
-
Ryan Leonard and Pierre-Luc Dubois, looking like a father and son, attend Washington Wizards game at Russian Machine Never Breaks (Sun Dec 14, 2025)
-
Pierre-Luc Dubois, Brooks Orpik, and Mike Green participating in public autograph signing on Saturday at Russian Machine Never Breaks (Fri Dec 5, 2025)
-
From The Archive: Bob, Bread and Butter at Yahoo Sports NHL (Sun Nov 30, 2025)
-
2016 NHL Entry Draft Top 10: Where Are They Now? at The Hockey Writers (Sat Nov 15, 2025)
-
Highs and Lows of the Capitals’ Season So Far at The Hockey Writers (Fri Nov 14, 2025)
-
Capitals' Pierre-Luc Dubois expected to miss 3-4 months after surgery for abdominal, adductor issues at NBC Sports (Sun Nov 9, 2025)
-
Capitals expect to be without Dubois 3-4 months at ESPN (Sun Nov 9, 2025)
-
Pierre-Luc Dubois passe sous le bistouri at HABSolument Fan (Sun Nov 9, 2025)
-
Capitals announce Pierre-Luc Dubois set to miss 3-4 months after undergoing surgery on abdominal and adductor muscles at Russian Machine Never Breaks (Sun Nov 9, 2025)
-
With Pierre-Luc Dubois injured, Spencer Carbery says finding the right combination in the Capitals’ middle six has ‘been a challenge’ at Russian Machine Never Breaks (Sun Nov 9, 2025)
-
NHL Rumors: Dubois Out, Panarin’s Standoff, Leafs’ Target & Stecher Trade at The Hockey Writers (Wed Nov 5, 2025)
-
Why the Capitals reportedly aren’t going to rush to replace Pierre-Luc Dubois via trade at Russian Machine Never Breaks (Wed Nov 5, 2025)
-
Capitals do not believe Pierre-Luc Dubois’ lower-body injury is season-ending at Russian Machine Never Breaks (Tue Nov 4, 2025)
-
Les Capitals perdent les services de Pierre-Luc Dubois at HABSolument Fan (Mon Nov 3, 2025)
-
Pierre-Luc Dubois will miss an ‘extended period of time’ due to his lower-body injury at Russian Machine Never Breaks (Mon Nov 3, 2025)
-
Dylan Strome will be game-time decision against Sabres, Pierre-Luc Dubois did not make trip to Buffalo at Russian Machine Never Breaks (Sat Nov 1, 2025)
-
Capitals recall Spencer Smallman from AHL’s Hershey Bears with Pierre-Luc Dubois injured at Russian Machine Never Breaks (Sat Nov 1, 2025)
-
Spencer Carbery provides short injury update on Pierre-Luc Dubois, believes Capitals may make recall from AHL’s Hershey Bears at Russian Machine Never Breaks (Fri Oct 31, 2025)
-
Pierre-Luc Dubois leaves game against New York Islanders with lower-body injury at Russian Machine Never Breaks (Fri Oct 31, 2025)
-
Capitals activate Pierre-Luc Dubois from injured reserve, send Ethen Frank back to AHL’s Hershey Bears at Russian Machine Never Breaks (Sat Oct 25, 2025)
-
Pierre-Luc Dubois and Rasmus Sandin will not play for Capitals against Blue Jackets at Russian Machine Never Breaks (Fri Oct 24, 2025)
-
Pierre-Luc Dubois is full participant in Capitals practice and will join team on trip to play Blue Jackets at Russian Machine Never Breaks (Thu Oct 23, 2025)
-
Pierre-Luc Dubois will miss fourth straight game due to lower-body injury against Kraken at Russian Machine Never Breaks (Mon Oct 20, 2025)
-
Capitals place Pierre-Luc Dubois on injured reserve at Russian Machine Never Breaks (Sat Oct 18, 2025)
-
Pierre Luc Dubois skates for second straight day in no-contact jersey, will not play against Canucks at Russian Machine Never Breaks (Sat Oct 18, 2025)
-
Pierre-Luc Dubois misses another practice due to lower-body injury ahead of game against Wild at Russian Machine Never Breaks (Thu Oct 16, 2025)
-
Spencer Carbery believes Pierre-Luc Dubois could be back skating ahead of game against Wild: ‘It’s not a long-term thing’ at Russian Machine Never Breaks (Wed Oct 15, 2025)
-
Spencer Carbery forced to reconfigure Capitals’ lines against Lightning after injury to Pierre-Luc Dubois at Russian Machine Never Breaks (Tue Oct 14, 2025)
-
Pierre-Luc Dubois to miss Capitals game against Lightning after suffering lower-body injury in win over Rangers at Russian Machine Never Breaks (Tue Oct 14, 2025)
-
Pierre-Luc Dubois leaves Capitals win over Rangers early with undisclosed injury at Russian Machine Never Breaks (Sun Oct 12, 2025)
-
Rink Roundtable: Previewing the 2025-26 Season at Japers Rink (Wed Oct 8, 2025)
-
With a baby on the way, Pierre-Luc Dubois says having ‘two kids in the house’ would be a lot, so Ryan Leonard’s moving out at Russian Machine Never Breaks (Wed Sep 24, 2025)
-
Ryan Leonard is still living with Pierre-Luc Dubois: ‘I had to give him a warning the other day for dishes in the sink’ at Russian Machine Never Breaks (Sun Sep 21, 2025)
-
Capitals’ Pierre-Luc Dubois Looks to Build Upon Positive 2024-25 Season at The Hockey Writers (Sat Sep 20, 2025)
-
The Pierre-Luc Dubois-Darcy Kuemper trade enabled the Capitals’ wave of 2024 offseason moves: ‘It did sort of fall into place’ at Russian Machine Never Breaks (Sun Sep 14, 2025)
-
Pierre-Luc Dubois semble vivre le parfait bonheur avec les Capitals at HABSolument Fan (Sat Sep 6, 2025)
-
Capitals release promotional schedule for 2025-26 season. Highlights include a Caps pride jersey, Ovi-Wan-Kenobi bobblehead, and a Pierre-Luc Dubois-designed hat. at Russian Machine Never Breaks (Thu Aug 28, 2025)
-
Pierre-Luc Dubois on Alex Ovechkin breaking the NHL goals record and his career year in 2024-25: ‘I could probably write a book about last season’ at Russian Machine Never Breaks (Tue Aug 26, 2025)
-
Pierre-Luc Dubois on Alex Ovechkin’s iconic belly flop after breaking the NHL goals record: ‘His dive wasn’t what he wanted to do at all’ at Russian Machine Never Breaks (Tue Aug 26, 2025)
-
Pierre-Luc Dubois collaborates with NHLPA to donate $40,000 worth of equipment to rural Quebec minor hockey associations at Russian Machine Never Breaks (Mon Aug 25, 2025)
-
Ottawa Senators Top 25 Under 25, #12: Arthur Kaliyev at Silver Seven Sens (Mon Aug 25, 2025)
-
Pierre-Luc Dubois, Nic Dowd, John Carlson, and Sonny Milano have joined informal Capitals skates ahead of training camp at Russian Machine Never Breaks (Wed Aug 20, 2025)
-
What if the LA Kings passed on the Pierre-Luc Dubois disaster deal? at Rink Royalty (Sat Jul 19, 2025)
-
The Winnipeg Jets are in a way better place without Dubois at Jets White Out (Tue Oct 17, 2023)
-
Winnipeg Jets week ahead: Pierre-Luc Dubois makes his return at Jets White Out (Mon Oct 16, 2023)
-
Kings Tease New Top Nine in Australia at Los Angeles Hockey Now (Tue Sep 19, 2023)
-
Kings Tease New Top Nine in Australia at Los Angeles Hockey Now (Tue Sep 19, 2023)
-
Kings Might Struggle to Find Power-Play Role For Dubois at Los Angeles Hockey Now (Mon Sep 11, 2023)
-
Kings Might Struggle to Find Power-Play Role For Dubois at Los Angeles Hockey Now (Mon Sep 11, 2023)
-
What is the trade value for Connor Hellebuyck and Pierre-Luc Dubois? at Jets White Out (Thu Jun 15, 2023)
-
Is Pierre-Luc Dubois on the cards for the rebuilding Anaheim Ducks? at Pucks of a Feather (Thu Jun 30, 2022)
-
Anaheim Ducks Rumored to Still be Interested in Pierre-Luc Dubois at Pucks of a Feather (Sun Jun 20, 2021)
Current Contract
Pierre-Luc Dubois signed an $68,000,000 8-year contract with the Winnipeg Jets and General Manager Kevin Cheveldayoff on June 27, 2023 with an AAV of $8,500,000. This contract will start in 2023-24 and end after the 2030-31 season. In the first season of the contract the cap hit was equivalent to 10.18% of the salary cap.
Standard Contract (RFA) ( ) (0 ratings)
Pierre-Luc Dubois signed a $6,000,000 1-year contract with the Winnipeg Jets and General Manager Kevin Cheveldayoff on July 22, 2022 with an AAV of $6,000,000. This contract will start in 2022-23 and end after the 2022-23 season. In the first season of the contract the cap hit was equivalent to 7.27% of the salary cap.
Standard Contract (RFA) ( ) (0 ratings)
| Season | Age* | Clause | Cap Hit | AAV | Perf. Bonus | Sign. Bonus | Salary | Compensation | Minors Salary | Status | |
|---|---|---|---|---|---|---|---|---|---|---|---|
| 2022-23 | 24 | $6,000,000 | $6,000,000 | - | - | $6,000,000 | $6,000,000 | $6,000,000 | RFA-arb | ||
| Total | - | - | $6,000,000 | $6,000,000 | $6,000,000 |
Pierre-Luc Dubois signed a $10,000,000 2-year contract with the Columbus Blue Jackets and General Manager Jarmo Kekalainen on December 31, 2020 with an AAV of $5,000,000. This contract will start in 2020-21 and end after the 2021-22 season. In the first season of the contract the cap hit was equivalent to 6.13% of the salary cap.
Standard Contract (RFA) ( ) (0 ratings)
| Season | Age* | Clause | Cap Hit | AAV | Perf. Bonus | Sign. Bonus | Salary | Compensation | Minors Salary | Status | |
|---|---|---|---|---|---|---|---|---|---|---|---|
| 2020-21 | 22 | $5,000,000 | $5,000,000 | - | - | $3,350,000 | $3,350,000 | $3,350,000 | RFA | ||
| 2021-22 | 23 | $5,000,000 | $5,000,000 | - | - | $6,650,000 | $6,650,000 | $6,650,000 | RFA-arb | ||
| Total | - | - | $10,000,000 | $10,000,000 | $10,000,000 |
Pierre-Luc Dubois signed a $2,775,000 3-year contract with the Columbus Blue Jackets and General Manager Jarmo Kekalainen on June 29, 2016 with an AAV of $925,000. This contract will start in 2016-17 and end after the 2019-20 season. In the first season of the contract the cap hit was equivalent to 1.27% of the salary cap.
Entry Level Contract ( ) (0 ratings)
| Season | Age* | Clause | Cap Hit | AAV | Perf. Bonus | Sign. Bonus | Salary | Compensation | Minors Salary | Status | |
|---|---|---|---|---|---|---|---|---|---|---|---|
| 2016-17 | 18 | $925,000 | $3,425,000 | - | $92,500 | - | $92,500 | - | ELC | ||
| 2017-18 | 19 | $894,167 | $3,394,167 | $2,500,000 | $92,500 | $832,500 | $925,000 | $70,000 | ELC | ||
| 2018-19 | 20 | $894,167 | $3,394,167 | $2,500,000 | $92,500 | $832,500 | $925,000 | $70,000 | ELC | ||
| 2019-20 | 21 | $894,167 | $3,394,167 | $2,500,000 | - | $832,500 | $832,500 | $70,000 | ELC | ||
| Total | $7,500,000 | $277,500 | $2,497,500 | $2,775,000 | $210,000 |
Career Statistics
| Regular Season | Playoffs | |||||||||||||||||||
|---|---|---|---|---|---|---|---|---|---|---|---|---|---|---|---|---|---|---|---|---|
| Season | League | Team | GP | G | A | Pts | +/- | PIM | Shots | Sh% | TOI/G | GP | G | A | Pts | +/- | PIM | Shots | Sh% | TOI/G |
| 2009-10 | QC Int PW | Rimouski Jr. Océanic | 2 | 0 | 0 | 0 | ||||||||||||||
| 2010-11 | QC Int PW | Rimouski Jr. Océanic | 3 | 0 | 2 | 2 | 2 | |||||||||||||
| 2010-11 | QC Int PW AA Elite | Rimouski Jr. Océanic | 3 | 2 | 2 | 2 | ||||||||||||||
| 2011-12 | LHDAAQ | TGV Pentagone U15 AA | 20 | 10 | 7 | 17 | 6 | 2 | 1 | 1 | ||||||||||
| 2012-13 | LHDAAQ | TGV Pentagone Bantam AAA R | 16 | 11 | 12 | 23 | 34 | |||||||||||||
| 2012-13 | LHDAAQ | TGV Pentagone U15 AA | 5 | 3 | 3 | 6 | 16 | |||||||||||||
| 2013-14 | QAAA | Col Notre Dame | 40 | 17 | 21 | 38 | 92 | 3 | 6 | |||||||||||
| 2014-15 | QMJHL | Cape Breton | 54 | 10 | 35 | 45 | +4 | 58 | 106 | 940.0 | 7 | 2 | 3 | 5 | +1 | 6 | 18 | 1,110.0 | ||
| 2015-16 | Hlinka Gretzky Cup | Canada U18 | 4 | 0 | 3 | 3 | +1 | |||||||||||||
| 2015-16 | U18-Dev | Team White | 3 | 2 | 0 | 2 | 2 | |||||||||||||
| 2015-16 | QMJHL | Cape Breton | 62 | 42 | 57 | 99 | +40 | 112 | 12 | 7 | 5 | 12 | +3 | 14 | ||||||
| 2016-17 | QMJHL | Cape Breton Eagles | 20 | 6 | 12 | 18 | +4 | 33 | ||||||||||||
| 2016-17 | WJC-20 | Canada U20 | 7 | 0 | 5 | 5 | +2 | 6 | ||||||||||||
| 2016-17 | QMJHL | Blainville-Boisbriand Armada | 28 | 15 | 22 | 37 | +13 | 45 | 19 | 9 | 13 | 22 | +1 | 26 | ||||||
| 2017-18 | WC | Canada | 9 | 3 | 4 | 7 | +4 | 2 | ||||||||||||
| 2017-18 | NHL | Columbus Blue Jackets | 82 | 20 | 28 | 48 | +8 | 49 | 165 | 12.1 | 16:38 | 6 | 2 | 2 | 4 | 6 | 15 | 13.3 | 23:09 | |
| 2018-19 | WC | Canada | 8 | 3 | 4 | 7 | +10 | 6 | ||||||||||||
| 2018-19 | NHL | Columbus Blue Jackets | 82 | 27 | 34 | 61 | +16 | 64 | 174 | 15.5 | 17:43 | 10 | 2 | 3 | 5 | -5 | 14 | 20 | 10.0 | 17:29 |
| 2019-20 | NHL | Columbus Blue Jackets | 70 | 18 | 31 | 49 | -2 | 49 | 158 | 11.4 | 17:56 | 10 | 4 | 6 | 10 | +3 | 4 | 27 | 14.8 | 22:57 |
| 2020-21 | NHL | Columbus Blue Jackets | 5 | 1 | 0 | 1 | -2 | 2 | 7 | 14.3 | 14:31 | |||||||||
| 2020-21 | NHL | Winnipeg Jets | 41 | 8 | 12 | 20 | -6 | 36 | 69 | 11.6 | 15:06 | 7 | 3 | 3 | -3 | 8 | 15 | 0.0 | 17:39 | |
| 2021-22 | NHL | Winnipeg Jets | 81 | 28 | 32 | 60 | -6 | 106 | 233 | 12.0 | 18:55 | |||||||||
| 2021-22 | WC | Canada | 10 | 7 | 6 | 13 | +11 | 12 | ||||||||||||
| 2022-23 | NHL | Winnipeg Jets | 73 | 27 | 36 | 63 | +5 | 77 | 205 | 13.2 | 18:27 | 5 | 2 | 2 | 4 | -4 | 8 | 13 | 15.4 | 21:00 |
| 2023-24 | NHL | Los Angeles Kings | 82 | 16 | 24 | 40 | -9 | 70 | 146 | 11.0 | 15:42 | 5 | 1 | 1 | 20 | 4 | 25.0 | 14:50 | ||
| 2024-25 | NHL | Washington Capitals | 82 | 20 | 46 | 66 | +27 | 76 | 142 | 14.1 | 17:18 | 10 | 3 | 3 | +3 | 12 | 13 | 0.0 | 17:03 | |
| 2025-26 | NHL | Washington Capitals | 29 | 5 | 14 | 19 | -4 | 19 | 42 | 11.9 | 16:49 | |||||||||
| NHL Career | 627 | 170 | 257 | 427 | +27 | 548 | 1341 | 12.7 | 17:17 | 53 | 11 | 19 | 30 | -6 | 72 | 107 | 10.3 | 19:11 | ||