
 Olli Määttä
| Position | Left Defense | Current Team | Utah Mammoth |
| Shoots | Left | Current Contract | 3 years ($3.5M CapHit) |
| Height | 6'2" | Expires | 2027-28 |
| Weight (lbs) | 207 | Expiry Age (Jun 30) | 33 |
| Age (DOB) | 31 (Aug 22, 1994) | Expiry Status | UFA |
| Drafted | 2012, Round 1, Overall 22 (PIT) |
| Date | Team | Transaction | |
|---|---|---|---|
| Dec 12, 2025 | Utah Mammoth | Activated from IR | |
| Nov 27, 2025 | Utah Mammoth | Placed on IR | |
| Mar 3, 2025 | Utah Hockey Club | Signed 3 years @ $3.500M AAV starting in 2025-26 | |
| Oct 30, 2024 | Utah Hockey Club | Acquired from Detroit Red Wings | |
| Oct 30, 2024 | Detroit Red Wings | Traded to Utah Hockey Club | |
| Feb 16, 2023 | Detroit Red Wings | Signed 2 years @ $3.000M AAV starting in 2023-24 | |
| Jul 13, 2022 | Detroit Red Wings | Signed 1 year @ $2.250M AAV starting in 2022-23 | |
| Feb 26, 2016 | Pittsburgh Penguins | Signed 6 years @ $4.083M AAV starting in 2016-17 | |
| Sep 14, 2012 | Pittsburgh Penguins | Signed to an entry level contract. |
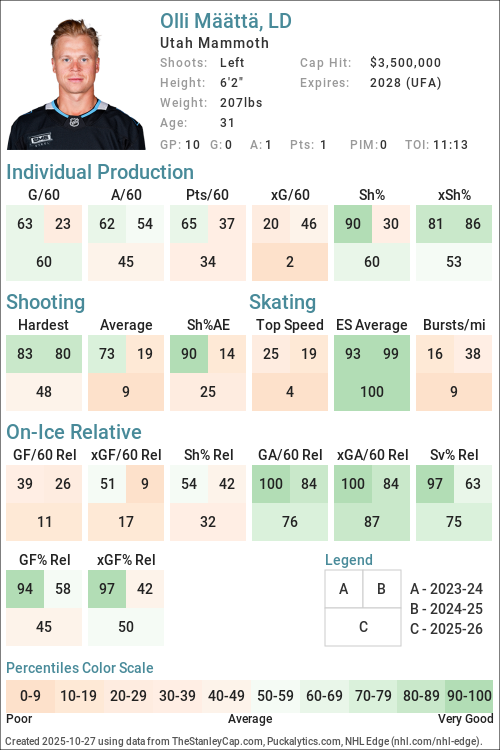
2025-26 Player Card
URL: https://thestanleycap.com/cdn/player_cards/20252026/olli-määttä-8476874.png
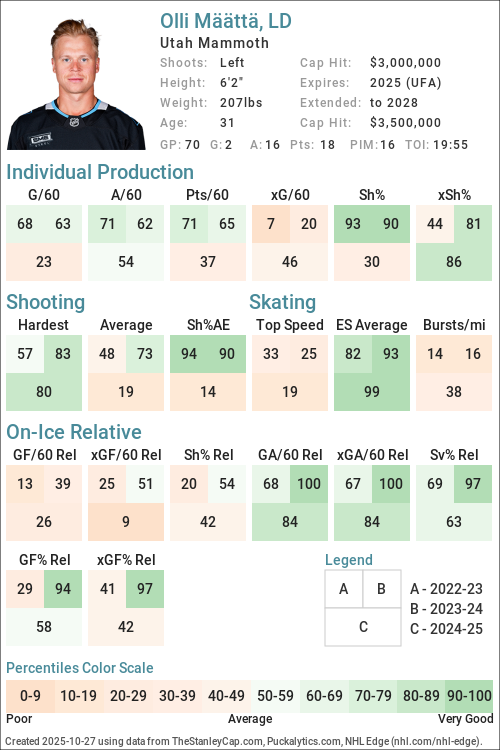
2024-25 Player Card
URL: https://thestanleycap.com/cdn/player_cards/20242025/olli-määttä-8476874.png
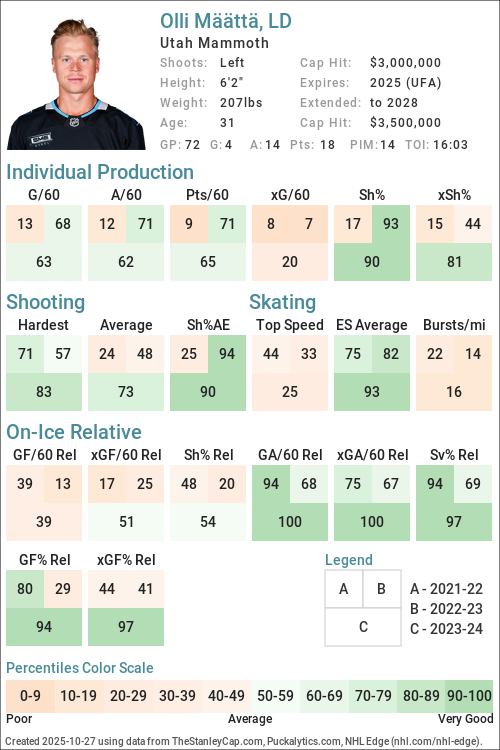
2023-24 Player Card
URL: https://thestanleycap.com/cdn/player_cards/20232024/olli-määttä-8476874.png
About Player Cards
Player cards present an infographic of a players performance. In this case it shows the player performance over a 3 season span. Each square is separated into three separate sub-boxes with the two smaller boxes on top representing the past two seasons and the larger box on the bottom representing the current or most recent season. This allows the reader to guage how consistent a player has been, and if early in the season it can help identify whether a players performance may be impacted by small sample size and subject to regression or is consistent with recent past performance.
Notes and Definitions
- The numbers represent percentiles so the higher the better.
- Percentiles are determined by comparing Forwards to Forwards and Defensemen to Defensemen.
- Bursts/mi are calculated from NHL Edge Data are are speed bursts above 20mpg per mile skated. The NHL doesn't adjust for ice time so the players that skate more will naturally have more bursts over 20, or at least more opportunity to have more. The NHL also does not provide ice time in the context of NHL Edge Statistics, however, it does provide distance skated. By adjusting for distance skated it will have a similar effect to adjusting for ice time but also adjust for situationional effect. For example, Players don't typically skate as much on the PK, mostly within the defensive zone, so don't get significant opportunity in that ice time to get speed bursts above 20mph. Adjusting with miles skates would account for this better than adjusting with ice time.
- Sh%AE is Shooting Percentage above Expected (Sh% - xSh%) and is an indicator of how good a shooter is at converting chances into goals.
- Relative statistics are On Ice - Off Ice statistics and can be an indicator of whether the player makes his teammates better or worse.
- All data is 5v5 except Shooting Hardest and Average, Skating Top Speed and Bursts/mi which are all situations, ES Average which is even strength (NHL doesn't give a specific definition).
Data Sources
- Salary data is from TheStanleyCap.com
- Shooting and Skating (except Sh%AE) are from NHL Edge
- Other statistics are from Puckalytics.com and derived from data from NHL.com
Terms of Use
You are free to use include player cards in written articles, share on social media, or on other public websites under the following conditions:
- You credit TheStanleyCap.com as the source and provide a link back to TheStanleyCap.com or this player page.
- You do not mass copy/duplicate/publish dozens or hundreds of player cards. A few, or a handful for a written article is fine. Be reasonable. Fair use rules apply.
- If you are a high-traffic website you must download and host the image(s) on your site rather than overload TheStanleyCap servers with traffic.
Note: The image will update daily throughout the season so if you want to include snapshot then you must download the image.
If you have any questions, send an e-mail to the e-mail address at the top of this page.
5v5 Individual Stats
| Season | Team(s) | GP | TOI | G/60 | A/60 | Pts/60 | xG/60 | GAE/60 | Sh% | xSh% | Sh%AE | %SA Rush | %SA Reb. |
|---|---|---|---|---|---|---|---|---|---|---|---|---|---|
| 2015-16 | PIT | 67 | 1098:33 | 0.33 | 0.60 | 0.93 | 0.22 | 0.11 | 6.90 | 4.62 | 2.27 | 1.68 | 0.84 |
| 2016-17 | PIT | 55 | 823:03 | 0.07 | 0.44 | 0.51 | 0.12 | -0.05 | 1.61 | 2.75 | -1.14 | 0.00 | 1.20 |
| 2017-18 | PIT | 82 | 1246:35 | 0.34 | 0.63 | 0.96 | 0.20 | 0.13 | 4.86 | 2.92 | 1.94 | 2.15 | 2.69 |
| 2018-19 | PIT | 60 | 893:42 | 0.00 | 0.67 | 0.67 | 0.13 | -0.13 | 0.00 | 3.24 | -3.24 | 0.00 | 0.00 |
| 2019-20 | CHI | 65 | 1019:24 | 0.24 | 0.53 | 0.77 | 0.16 | 0.07 | 5.26 | 3.62 | 1.64 | 0.00 | 8.82 |
| 2020-21 | LAK | 41 | 589:08 | 0.00 | 0.41 | 0.41 | 0.16 | -0.16 | 0.00 | 3.99 | -3.99 | 0.00 | 0.00 |
| 2021-22 | LAK | 66 | 1048:16 | 0.06 | 0.40 | 0.46 | 0.14 | -0.08 | 1.69 | 4.19 | -2.49 | 0.00 | 0.00 |
| 2022-23 | DET | 78 | 1269:50 | 0.24 | 0.80 | 1.04 | 0.11 | 0.13 | 8.62 | 3.96 | 4.66 | 0.00 | 6.82 |
| 2023-24 | DET | 72 | 1067:57 | 0.22 | 0.73 | 0.96 | 0.13 | 0.10 | 8.70 | 4.93 | 3.76 | 0.00 | 4.41 |
| 2024-25 | UTA | 70 | 1205:07 | 0.10 | 0.70 | 0.80 | 0.19 | -0.09 | 3.12 | 6.04 | -2.92 | 0.00 | 1.90 |
| 2024-25 | DET | 7 | 100:41 | 0.00 | 0.00 | 0.00 | 0.09 | -0.09 | 0.00 | 7.55 | -7.55 | 0.00 | 0.00 |
| 2024-25 | DET, UTA | 77 | 1305:48 | 0.09 | 0.64 | 0.74 | 0.18 | -0.09 | 3.03 | 6.09 | -3.06 | 0.00 | 1.85 |
| 2025-26 | UTA | 22 | 265:18 | 0.00 | 0.23 | 0.23 | 0.08 | -0.08 | 0.00 | 3.56 | -3.56 | 0.00 | 0.00 |
5v5 On Ice Stats
| Season | Team(s) | GP | TOI | SAF/60 | GF/60 | xGF/60 | SAA/60 | GA/60 | xGA/60 | GF% | xGF% | xGF Rel | xGA Rel | xGF% Rel |
|---|---|---|---|---|---|---|---|---|---|---|---|---|---|---|
| 2015-16 | PIT | 67 | 1098:33 | 42.87 | 3.22 | 2.51 | 38.45 | 1.86 | 1.99 | 63.44 | 55.71 | -0.09 | -0.05 | -0.27 |
| 2016-17 | PIT | 55 | 823:03 | 44.25 | 3.13 | 2.74 | 42.35 | 1.97 | 2.34 | 61.43 | 53.97 | -0.12 | 0.11 | -2.31 |
| 2017-18 | PIT | 82 | 1246:35 | 46.83 | 2.26 | 2.50 | 42.12 | 2.45 | 2.38 | 47.96 | 51.24 | -0.21 | 0.07 | -2.72 |
| 2018-19 | PIT | 60 | 893:42 | 40.21 | 2.82 | 2.52 | 43.44 | 2.48 | 2.45 | 53.16 | 50.69 | -0.27 | -0.20 | -0.61 |
| 2019-20 | CHI | 65 | 1019:24 | 40.08 | 2.77 | 2.46 | 42.20 | 3.06 | 2.69 | 47.47 | 47.77 | -0.08 | -0.27 | 1.58 |
| 2020-21 | LAK | 41 | 589:08 | 37.89 | 2.24 | 2.07 | 40.74 | 3.46 | 2.59 | 39.29 | 44.45 | -0.02 | 0.15 | -1.67 |
| 2021-22 | LAK | 66 | 1048:16 | 43.84 | 2.23 | 2.65 | 36.86 | 1.95 | 2.35 | 53.42 | 52.91 | -0.20 | -0.13 | -0.43 |
| 2022-23 | DET | 78 | 1269:50 | 34.78 | 1.94 | 2.09 | 40.26 | 2.69 | 2.52 | 41.84 | 45.28 | -0.22 | -0.08 | -1.70 |
| 2023-24 | DET | 72 | 1067:57 | 35.06 | 2.58 | 2.17 | 39.83 | 1.85 | 2.18 | 58.23 | 49.85 | -0.04 | -0.65 | 6.00 |
| 2024-25 | UTA | 70 | 1205:07 | 40.08 | 2.04 | 2.37 | 36.39 | 1.89 | 2.19 | 51.90 | 51.89 | -0.49 | -0.18 | -2.69 |
| 2024-25 | DET | 7 | 100:41 | 36.35 | 2.38 | 2.44 | 41.12 | 2.38 | 2.09 | 50.00 | 53.96 | 0.33 | -0.99 | 13.19 |
| 2024-25 | DET, UTA | 77 | 1305:48 | 39.79 | 2.07 | 2.37 | 36.76 | 1.93 | 2.19 | 51.72 | 52.05 | -0.42 | -0.26 | -1.25 |
| 2025-26 | UTA | 22 | 265:18 | 35.96 | 1.58 | 2.35 | 32.34 | 2.94 | 2.27 | 35.00 | 50.89 | -0.34 | -0.05 | -2.81 |
NHL Edge Stats
| Skating | Shooting | Zone Time | |||||||||||
|---|---|---|---|---|---|---|---|---|---|---|---|---|---|
| Season | GP | Top Speed | Bursts>20/mi | Avg. Speed | ES Avg. Speed | Top Speed | Avg. Speed | %Long Range | %Mid Range | %High Danger | ES DZ% | ES NZ% | ES OZ% |
| This table is for Basic and Premium subscribers only. To view please login to and/or subscribe to one of our subscription plans. | |||||||||||||
Legend
| Percentile 0-25 | Percentile 25-50 | Percentile 50-75 | Percentile 75-100 |
5v5 Defense Pairs
| Season | Teammate | Team | TOI | GF/60 | GA/60 | GF% | xGF/60 | xGA/60 | xGF% | xGF Rel | xGA Rel | xGF% Rel |
|---|
Glossary
| Type | Statistic | Definition |
|---|---|---|
| Individual | G/60 | Goals Against per 60 minutes. |
| Individual | A/60 | Assists per 60 minutes. |
| Individual | Pts/60 | Points per 60 minutes. |
| Individual | xG/60 | Expected Goals per 60 minutes. |
| Individual | GAE/60 | Goals Above Expected (G/60 - xG/60). |
| Individual | Sh% | Shooting Percentage. |
| Individual | xSh% | Expected Shooting Percentage. |
| Individual | Sh%AE | Shooting percentage above expected (Sh% - xSh%). |
| Individual | %SA Rush | Percentage of shot attempts determined to be on the rush. |
| Individual | %SA Reb. | Percentage of shot attempts determined to be from rebounds. |
| On Ice | SAF/60 | Shot Attempts For per 60 minutes. |
| On Ice | GF/60 | Goals For per 60 minutes. |
| On Ice | xGF/60 | Expected Goals For per 60 minutes. |
| On Ice | SAA/60 | Shot Attempts Against per 60 minutes (lower is better). |
| On Ice | GA/60 | Goals Against per 60 minutes (lower is better). |
| On Ice | xGA/60 | Expected Goals Against per 60 minutes (lower is better). |
| On Ice | GF% | Goals For Percentage = Goals For / (Goals For + Goals Against) |
| On Ice | xGF% | Expected Goals For Percentage = Expected Goals For / (Expected Goals For + Expected Goals Against) |
| On Ice | xGF Rel | xGF/60 when On Ice - xGF/60 when not On Ice. |
| On Ice | xGA Rel | xGA/60 when On Ice - xGA/60 when not On Ice (lower is better). |
| On Ice | xGF% Rel | xGF% when On Ice - xGF% when not On Ice. |
News and Opinions
-
Former Red Wings Player Dealing With Mammoth Disappointment at Detroit Hockey Now (Wed Feb 4, 2026)
Current Contract
Olli Määttä signed a $10,500,000 3-year contract with the Utah Hockey Club and General Manager Bill Armstrong on March 3, 2025 with an AAV of $3,500,000. This contract will start in 2025-26 and end after the 2027-28 season. In the first season of the contract the cap hit was equivalent to 3.66% of the salary cap.
Standard Contract (UFA) ( ) (0 ratings)
Olli Määttä signed a $6,000,000 2-year contract with the Detroit Red Wings and General Manager Steve Yzerman on February 16, 2023 with an AAV of $3,000,000. This contract will start in 2023-24 and end after the 2024-25 season. In the first season of the contract the cap hit was equivalent to 3.59% of the salary cap.
Standard Contract (UFA) ( ) (0 ratings)
| Season | Age* | Clause | Cap Hit | AAV | Perf. Bonus | Sign. Bonus | Salary | Compensation | Minors Salary | Status | |
|---|---|---|---|---|---|---|---|---|---|---|---|
| 2023-24 | 29 | $3,000,000 | $3,000,000 | - | - | $3,000,000 | $3,000,000 | $3,000,000 | UFA | ||
| 2024-25 | 30 | $3,000,000 | $3,000,000 | - | - | $3,000,000 | $3,000,000 | $3,000,000 | UFA | ||
| Total | - | - | $6,000,000 | $6,000,000 | $6,000,000 |
Olli Määttä signed a $2,250,000 1-year contract with the Detroit Red Wings and General Manager Steve Yzerman on July 13, 2022 with an AAV of $2,250,000. This contract will start in 2022-23 and end after the 2022-23 season. In the first season of the contract the cap hit was equivalent to 2.73% of the salary cap.
Standard Contract (UFA) ( ) (0 ratings)
| Season | Age* | Clause | Cap Hit | AAV | Perf. Bonus | Sign. Bonus | Salary | Compensation | Minors Salary | Status | |
|---|---|---|---|---|---|---|---|---|---|---|---|
| 2022-23 | 28 | $2,250,000 | $2,250,000 | - | - | $2,250,000 | $2,250,000 | $2,250,000 | UFA | ||
| Total | - | - | $2,250,000 | $2,250,000 | $2,250,000 |
Olli Määttä signed a $24,499,998 6-year contract with the Pittsburgh Penguins and General Manager Jim Rutherford on February 26, 2016 with an AAV of $4,083,333. This contract will start in 2016-17 and end after the 2021-22 season. In the first season of the contract the cap hit was equivalent to 5.59% of the salary cap.
Standard Contract (RFA) ( ) (0 ratings)
| Season | Age* | Clause | Cap Hit | AAV | Perf. Bonus | Sign. Bonus | Salary | Compensation | Minors Salary | Status | |
|---|---|---|---|---|---|---|---|---|---|---|---|
| 2016-17 | 22 | $4,083,333 | $4,083,333 | - | - | $4,083,333 | $4,083,333 | $4,083,333 | RFA | ||
| 2017-18 | 23 | $4,083,333 | $4,083,333 | - | - | $4,083,333 | $4,083,333 | $4,083,333 | RFA-arb | ||
| 2018-19 | 24 | $4,083,333 | $4,083,333 | - | - | $4,083,333 | $4,083,333 | $4,083,333 | RFA-arb | ||
| 2019-20 | 25 | $4,083,333 | $4,083,333 | - | - | $4,083,333 | $4,083,333 | $4,083,333 | RFA-arb | ||
| 2020-21 | 26 | $4,083,333 | $4,083,333 | - | - | $4,083,333 | $4,083,333 | $4,083,333 | UFA | ||
| 2021-22 | 27 | $4,083,333 | $4,083,333 | - | - | $4,083,333 | $4,083,333 | $4,083,333 | UFA | ||
| Total | - | - | $24,499,998 | $24,499,998 | $24,499,998 |
Olli Määttä signed a $2,775,000 3-year contract with the Pittsburgh Penguins and General Manager Ray Shero on September 14, 2012 with an AAV of $925,000. This contract will start in 2012-13 and end after the 2015-16 season. In the first season of the contract the cap hit was equivalent to 1.54% of the salary cap.
Entry Level Contract ( ) (0 ratings)
| Season | Age* | Clause | Cap Hit | AAV | Perf. Bonus | Sign. Bonus | Salary | Compensation | Minors Salary | Status | |
|---|---|---|---|---|---|---|---|---|---|---|---|
| 2012-13 | 18 | $925,000 | $925,000 | - | $92,500 | - | $92,500 | - | ELC | ||
| 2013-14 | 19 | $894,167 | $894,167 | - | $92,500 | $832,500 | $925,000 | $70,000 | ELC | ||
| 2014-15 | 20 | $894,167 | $894,167 | - | $92,500 | $832,500 | $925,000 | $70,000 | ELC | ||
| 2015-16 | 21 | $894,167 | $894,167 | - | - | $832,500 | $832,500 | $70,000 | ELC | ||
| Total | - | $277,500 | $2,497,500 | $2,775,000 | $210,000 |
Career Statistics
| Regular Season | Playoffs | |||||||||||||||||||
|---|---|---|---|---|---|---|---|---|---|---|---|---|---|---|---|---|---|---|---|---|
| Season | League | Team | GP | G | A | Pts | +/- | PIM | Shots | Sh% | TOI/G | GP | G | A | Pts | +/- | PIM | Shots | Sh% | TOI/G |
| 2008-09 | Jr. C SM-sarja | JYP U16 | 1 | 0 | 0 | 0 | 2 | |||||||||||||
| 2009-10 | Fin-U18 | JyP U18 | 2 | 0 | 0 | 0 | 2 | |||||||||||||
| 2009-10 | Fin-Jr. | JyP Jr. | 1 | 0 | 1 | 1 | ||||||||||||||
| 2009-10 | U16 SM-sarja | JYP U16 | 3 | 1 | 1 | 2 | ||||||||||||||
| 2009-10 | U20 SM-sarja | JYP U20 | 1 | 1 | 1 | -1 | ||||||||||||||
| 2010-11 | Finland-2 | D Team | 23 | 1 | 5 | 6 | 6 | |||||||||||||
| 2010-11 | Finland-2 | Suomi U20 | 2 | 0 | 2 | 2 | 2 | |||||||||||||
| 2010-11 | Fin-U18 | JyP U18 | 1 | 0 | 0 | 0 | ||||||||||||||
| 2010-11 | Fin-Jr. | JyP Jr. | 19 | 2 | 6 | 8 | 8 | 12 | 1 | 4 | 5 | 6 | ||||||||
| 2011-12 | WJC-A | Finland | 1 | 0 | 0 | 0 | -2 | |||||||||||||
| 2011-12 | OHL | London | 58 | 5 | 27 | 32 | +25 | 25 | 19 | 6 | 17 | 23 | +11 | 2 | ||||||
| 2011-12 | M-Cup | London | 4 | 7 | 0.0 | |||||||||||||||
| 2012-13 | WJC-A | Finland | 5 | 1 | 2 | 3 | 2 | |||||||||||||
| 2012-13 | OHL | London | 57 | 8 | 30 | 38 | +9 | 30 | 21 | 4 | 10 | 14 | +10 | 8 | ||||||
| 2012-13 | M-Cup | London | 5 | 2 | 2 | -4 | ||||||||||||||
| 2012-13 | AHL | Wilkes-Barre | 3 | -2 | 4 | 0.0 | ||||||||||||||
| 2013-14 | Olympics | Finland | 6 | 3 | 2 | 5 | +1 | 13 | ||||||||||||
| 2013-14 | NHL | Pittsburgh Penguins | 78 | 9 | 20 | 29 | +8 | 14 | 119 | 7.6 | 18:30 | 13 | 4 | 4 | +2 | 19 | 0.0 | 18:05 | ||
| 2014-15 | NHL | Pittsburgh Penguins | 20 | 1 | 8 | 9 | +1 | 10 | 27 | 3.7 | 20:43 | |||||||||
| 2015-16 | NHL | Pittsburgh Penguins | 67 | 6 | 13 | 19 | +27 | 22 | 95 | 6.3 | 19:58 | 18 | 7 | 7 | +5 | 4 | 17 | 0.0 | 17:44 | |
| 2016-17 | WCup | Finland | 3 | 0 | 0 | 0 | -1 | |||||||||||||
| 2016-17 | NHL | Pittsburgh Penguins | 55 | 1 | 6 | 7 | +17 | 12 | 66 | 1.5 | 18:04 | 25 | 2 | 6 | 8 | +8 | 12 | 35 | 5.7 | 20:37 |
| 2017-18 | NHL | Pittsburgh Penguins | 82 | 7 | 22 | 29 | -1 | 28 | 164 | 4.3 | 18:45 | 12 | 2 | 2 | +8 | 4 | 11 | 0.0 | 19:49 | |
| 2018-19 | NHL | Pittsburgh Penguins | 60 | 1 | 13 | 14 | +9 | 12 | 74 | 1.4 | 18:35 | 1 | -2 | 0.0 | 18:44 | |||||
| 2019-20 | NHL | Chicago Blackhawks | 65 | 4 | 13 | 17 | 20 | 80 | 5.0 | 18:25 | 9 | 3 | 3 | 6 | +7 | 4 | 10 | 30.0 | 18:17 | |
| 2020-21 | NHL | Los Angeles Kings | 41 | 0 | 4 | 4 | -8 | 6 | 43 | 0.0 | 16:26 | |||||||||
| 2020-21 | WC | Finland | 10 | 0 | 2 | 2 | +1 | |||||||||||||
| 2021-22 | NHL | Los Angeles Kings | 66 | 1 | 7 | 8 | +17 | 10 | 61 | 1.6 | 18:17 | 7 | 6 | 0.0 | 16:55 | |||||
| 2022-23 | NHL | Detroit Red Wings | 78 | 6 | 17 | 23 | -9 | 14 | 62 | 9.7 | 18:42 | |||||||||
| 2022-23 | WC | Finland | 8 | 0 | 5 | 5 | +1 | |||||||||||||
| 2022-23 | EHT | Finland | 2 | 1 | 1 | 2 | +2 | |||||||||||||
| 2023-24 | NHL | Detroit Red Wings | 72 | 4 | 14 | 18 | +14 | 14 | 48 | 8.3 | 16:03 | |||||||||
| 2023-24 | WC | Finland | 8 | 1 | 2 | 3 | +1 | 2 | ||||||||||||
| 2023-24 | EHT | Finland | 3 | 0 | 0 | 0 | ||||||||||||||
| 2024-25 | NHL | Utah Hockey Club | 70 | 2 | 16 | 18 | +7 | 16 | 70 | 2.9 | 19:55 | |||||||||
| 2024-25 | NHL | Detroit Red Wings | 7 | 0 | 0 | 0 | 3 | 0.0 | 15:52 | |||||||||||
| 2024-25 | 4 Nations | Finland | 3 | 0 | 2 | 2 | 2 | 60:02 | ||||||||||||
| 2025-26 | NHL | Utah Mammoth | 19 | 0 | 1 | 1 | -4 | 2 | 9 | 0.0 | 11:55 | |||||||||
| NHL Career | 780 | 42 | 154 | 196 | +78 | 180 | 921 | 4.6 | 18:17 | 85 | 5 | 22 | 27 | +28 | 24 | 98 | 5.1 | 18:56 | ||