
 Nino Niederreiter
| Position | Left Wing / Right Wing | Current Team | Winnipeg Jets |
| Shoots | Left | Current Contract | 3 years ($4.0M CapHit) |
| Height | 6'2" | Expires | 2026-27 |
| Weight (lbs) | 218 | Expiry Age (Jun 30) | 34 |
| Age (DOB) | 33 (Sep 8, 1992) | Expiry Status | UFA |
| Drafted | 2010, Round 1, Overall 5 (NYI) |
| Date | Team | Transaction | |
|---|---|---|---|
| Dec 4, 2023 | Winnipeg Jets | Signed 3 years @ $4.000M AAV starting in 2024-25 | |
| Jul 21, 2022 | Nashville Predators | Signed 2 years @ $4.000M AAV starting in 2022-23 | |
| Jul 30, 2017 | Minnesota Wild | Signed 5 years @ $5.250M AAV starting in 2017-18 | |
| Sep 20, 2014 | Minnesota Wild | Signed 3 years @ $2.667M AAV starting in 2014-15 | |
| Sep 21, 2010 | New York Islanders | Signed to an entry level contract. |
Player Card(s)
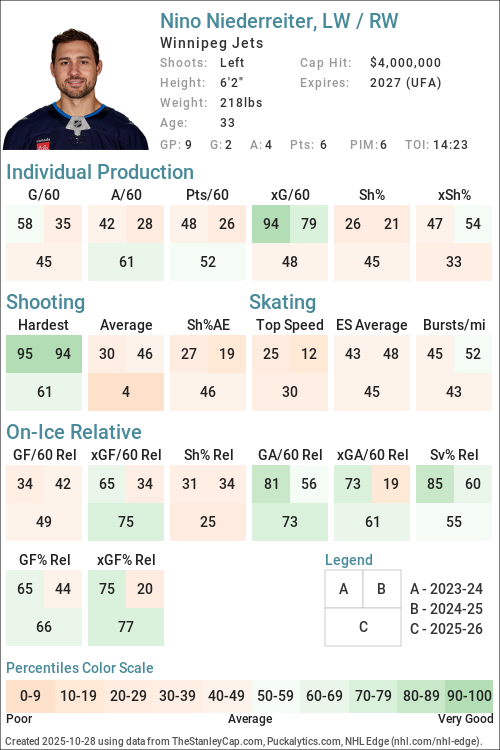
URL: https://thestanleycap.com/cdn/player_cards/20252026/nino-niederreiter-8475799.png
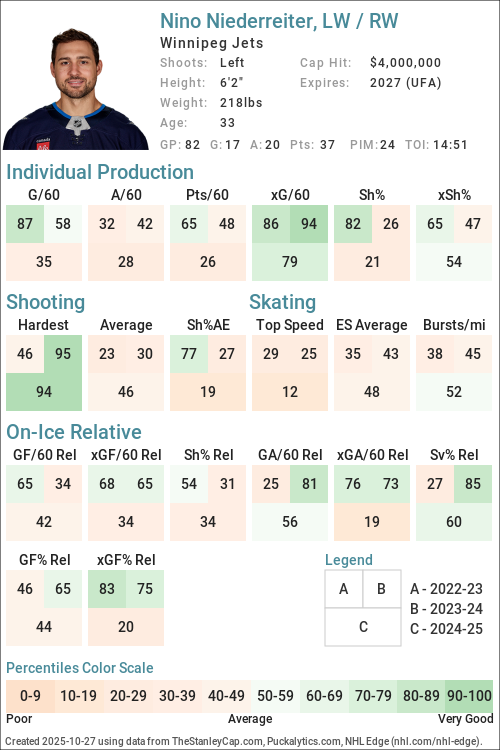
URL: https://thestanleycap.com/cdn/player_cards/20242025/nino-niederreiter-8475799.png
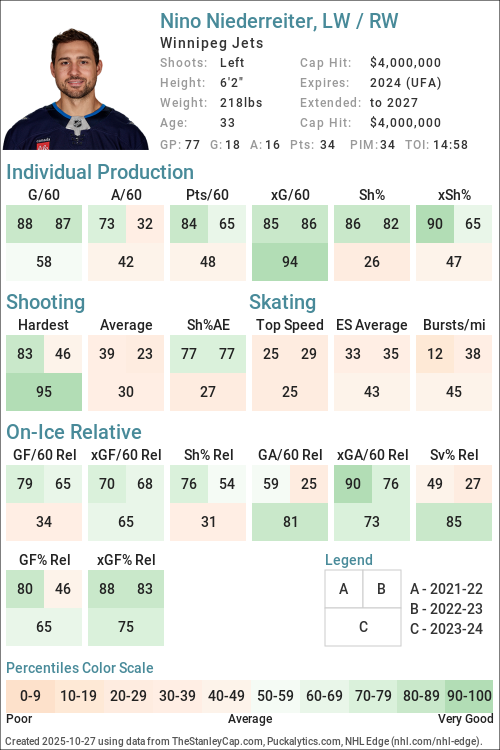
URL: https://thestanleycap.com/cdn/player_cards/20232024/nino-niederreiter-8475799.png
About Player Cards
Player cards present an infographic of a players performance using a series of Player Archetypes developed for Puckalytics.com and TheStanleyCap.com. The boxes in the rink image show the archetype ratings for the season specified in the card while the graphs to the right show the five-year trends for those archetypes.
Except for Faceoffs, the values shown are the players z-score (standard deviation from the mean) for the specific metric used to calculate the archetype values. When calculating z-scores forwards were compared to forwards and defensemen were compared to defensemen. Positive values indicate the player is above average and shaded in blue, while negative values indicate the player is below average and shaded in pink. The five year trend charts show a range of -4.0 to 4.0.
The value shown for Faceoffs is the faceoff winning percentage rather than their z-score with winning percentages below 50 in pink shades and above 50 in blue shades.
All archetypes are 5v5 except 5v4 TOI, 4v5 TOI, Skating (even strength) and Faceoffs (all situations). Archetypes use regular season data only.
Archetypes Summary
- Sniper - Measures the to score above the expected goal rate.
- Rebound - Measures the percent of a players shot attempts that come from rebounds (forwards only).
- 5v4 TOI - Powerplay ice time, calculated as the percentage of his teams 5v4 ice time that the player was on the ice for.
- Shooter - Measures whether a players points come from shots (goals or assists on rebounds from his shots).
- Producer - Measures a players ability to produce goals and assists, adjusted for quality of teammates.
- Playmaker - Measures whether a players points come from passes.
- Drive - Measures a players ability to drive puck possession and generate shot attempts for his team.
- Rush - Measures the percent of a players shot attempts that come from rush plays
- Possession - An indicator of a players ability to improve his teams puck possession game.
- Faceoffs - Faceoff Winning Percentage (min. 75 faceoffs taken).
- 5v5 TOI - The percentage of his teams 5v5 TOI that the player was on the ice for.
- Suppress - Measures a players ability to suppress opponent puck possession and shot attempts against.
- Skating - An indicator of a players skating ability, or speed bursts above 20mph per mile skated.
- Defend - An indicator of a players ability to suppress shot quality against.
- 4v5 TOI - Penalty Kill ice time, calculated as the percentage of his teams 4v5 ice time that the player was on the ice for.
Data Sources
- Salary data is from TheStanleyCap.com
- Skating data is from NHL Edge
- Other statistics are from Puckalytics.com and derived from data from NHL.com
Terms of Use
You are free to use include player cards in written articles, share on social media, or on other public websites under the following conditions:
- You credit TheStanleyCap.com as the source and provide a link back to TheStanleyCap.com or this player page.
- You do not mass copy/duplicate/publish dozens or hundreds of player cards. A few, or a handful for a written article is fine. Be reasonable. Fair use rules apply.
- If you are a high-traffic website you must download and host the image(s) on your site rather than overload TheStanleyCap servers with traffic.
Note: Player cards will update daily throughout the season so if you want to include snapshot then you must download the image.
If you have any questions, send an e-mail to the e-mail address at the top of this page.
Read Introducing Player Archetypes on HockeyAnalysis.com for more details on archetype calculations.
Core Archetypes
| Season | Team(s) | GP | TOI | Producer | Playmaker | Shooter | Sniper | Rebound | Rush | Skating | Defend |
|---|---|---|---|---|---|---|---|---|---|---|---|
| 2015-16 | MIN | 82 | 1.10 | 0.93 | 0.38 | 0.78 | 1.21 | 0.44 | - | -0.95 | |
| 2016-17 | MIN | 82 | 1.91 | 1.04 | 0.97 | 0.67 | 0.31 | -1.11 | - | -0.50 | |
| 2017-18 | MIN | 63 | -0.16 | -0.15 | -0.19 | 0.12 | 0.89 | -0.45 | - | 1.28 | |
| 2018-19 | CAR, MIN | 82 | 0.44 | -0.07 | 0.54 | 0.15 | -0.18 | -1.07 | - | -1.66 | |
| 2019-20 | CAR | 67 | -0.87 | -0.53 | -0.74 | -0.76 | -0.58 | -0.40 | - | 0.57 | |
| 2020-21 | CAR | 56 | 0.54 | -0.31 | 1.02 | -0.11 | 2.09 | 0.56 | - | 0.89 | |
| 2021-22 | CAR | 75 | 0.62 | -0.45 | 1.27 | 0.37 | 1.98 | 0.28 | -0.98 | -0.03 | |
| 2022-23 | NSH, WPG | 78 | 0.40 | -1.01 | 1.86 | 1.03 | 1.01 | 0.03 | -0.49 | -0.61 | |
| 2023-24 | WPG | 77 | 0.00 | -0.11 | -0.02 | -0.38 | 1.57 | -0.67 | -0.32 | 1.01 | |
| 2024-25 | WPG | 82 | -0.94 | -0.81 | -0.54 | -0.52 | 0.94 | 0.14 | -0.15 | 0.27 | |
| 2025-26 | WPG | 61 | -0.97 | -1.05 | -0.35 | -0.52 | 2.31 | 0.96 | -1.12 | -0.38 |
Situational and Secondary Archetypes
| Season | Team(s) | GP | TOI | 5v5 TOI | 5v4 TOI | 4v5 TOI | Possession | Drive | Suppress | Faceoffs |
|---|---|---|---|---|---|---|---|---|---|---|
| 2015-16 | MIN | 82 | 0.52 | -0.11 | -1.94 | 2.65 | 1.26 | 3.04 | - | |
| 2016-17 | MIN | 82 | 0.16 | 0.29 | -2.03 | 1.86 | 0.53 | 2.76 | - | |
| 2017-18 | MIN | 63 | 0.09 | 0.39 | -1.97 | 1.37 | 1.03 | 0.85 | - | |
| 2018-19 | CAR, MIN | 82 | 0.52 | 0.53 | -1.95 | 1.65 | 1.52 | 0.65 | - | |
| 2019-20 | CAR | 67 | 0.33 | -0.10 | -1.89 | 0.74 | 0.45 | 0.69 | - | |
| 2020-21 | CAR | 56 | 0.90 | -0.35 | -2.18 | 1.31 | 1.18 | 0.95 | - | |
| 2021-22 | CAR | 75 | 0.50 | -0.23 | -2.02 | 1.00 | 0.31 | 1.36 | - | |
| 2022-23 | NSH, WPG | 78 | 0.62 | 0.22 | -1.93 | 0.68 | 0.54 | 0.38 | - | |
| 2023-24 | WPG | 77 | 0.19 | -0.20 | -2.00 | 0.27 | 0.22 | 0.12 | - | |
| 2024-25 | WPG | 82 | 0.27 | -0.43 | -2.14 | -0.23 | -0.00 | -0.42 | - | |
| 2025-26 | WPG | 61 | -0.16 | -0.40 | -1.99 | 0.89 | -0.26 | 1.72 | - |
5v5 Individual Stats
| Season | Team(s) | GP | TOI | G/60 | A/60 | Pts/60 | xG/60 | GAE/60 | Sh% | xSh% | Sh%AE | %SA Rush | %SA Reb. |
|---|---|---|---|---|---|---|---|---|---|---|---|---|---|
| 2015-16 | MIN | 82 | 1023:22 | 0.88 | 1.11 | 1.99 | 0.72 | 0.16 | 12.71 | 10.36 | 2.35 | 4.91 | 7.98 |
| 2016-17 | MIN | 82 | 996:22 | 0.96 | 1.45 | 2.41 | 0.77 | 0.19 | 11.27 | 9.01 | 2.26 | 1.72 | 5.75 |
| 2017-18 | MIN | 63 | 759:17 | 0.79 | 0.95 | 1.74 | 0.76 | 0.03 | 10.20 | 9.82 | 0.38 | 3.08 | 6.92 |
| 2018-19 | MIN | 46 | 548:06 | 0.66 | 0.99 | 1.64 | 0.60 | 0.06 | 8.96 | 8.12 | 0.84 | 0.00 | 3.61 |
| 2018-19 | CAR | 36 | 526:36 | 1.25 | 1.03 | 2.28 | 1.26 | -0.00 | 12.94 | 12.96 | -0.02 | 3.20 | 5.60 |
| 2018-19 | CAR, MIN | 82 | 1074:42 | 0.95 | 1.00 | 1.95 | 0.92 | 0.03 | 11.18 | 10.82 | 0.36 | 1.92 | 4.81 |
| 2019-20 | CAR | 67 | 820:08 | 0.51 | 0.66 | 1.17 | 0.71 | -0.19 | 7.61 | 10.48 | -2.87 | 2.99 | 4.48 |
| 2020-21 | CAR | 56 | 766:00 | 1.02 | 0.86 | 1.88 | 1.05 | -0.03 | 12.26 | 12.63 | -0.37 | 4.93 | 11.97 |
| 2021-22 | CAR | 75 | 970:25 | 1.11 | 1.17 | 2.29 | 1.02 | 0.10 | 14.63 | 13.37 | 1.27 | 4.57 | 11.43 |
| 2022-23 | WPG | 22 | 283:37 | 1.06 | 1.27 | 2.33 | 0.79 | 0.27 | 12.82 | 9.58 | 3.24 | 2.13 | 10.64 |
| 2022-23 | NSH | 56 | 723:24 | 1.16 | 0.58 | 1.74 | 0.89 | 0.27 | 13.86 | 10.66 | 3.20 | 4.44 | 10.37 |
| 2022-23 | NSH, WPG | 78 | 1007:01 | 1.13 | 0.77 | 1.91 | 0.86 | 0.27 | 13.57 | 10.36 | 3.21 | 3.85 | 10.44 |
| 2023-24 | WPG | 77 | 978:12 | 0.74 | 0.86 | 1.59 | 0.86 | -0.13 | 7.79 | 9.14 | -1.35 | 2.48 | 12.87 |
| 2024-25 | WPG | 82 | 1077:16 | 0.56 | 0.67 | 1.23 | 0.71 | -0.15 | 7.69 | 9.77 | -2.08 | 2.65 | 10.05 |
| 2025-26 | WPG | 61 | 727:23 | 0.49 | 0.49 | 0.99 | 0.66 | -0.17 | 8.45 | 11.29 | -2.84 | 4.12 | 15.46 |
5v5 On Ice Stats
| Season | Team(s) | GP | TOI | SAF/60 | GF/60 | xGF/60 | SAA/60 | GA/60 | xGA/60 | GF% | xGF% | xGF Rel | xGA Rel | xGF% Rel |
|---|---|---|---|---|---|---|---|---|---|---|---|---|---|---|
| 2015-16 | MIN | 82 | 1023:22 | 42.21 | 2.76 | 2.19 | 33.30 | 1.93 | 1.63 | 58.75 | 57.42 | 0.25 | -0.47 | 9.29 |
| 2016-17 | MIN | 82 | 996:22 | 42.82 | 3.19 | 2.42 | 34.93 | 2.11 | 1.69 | 60.23 | 58.81 | 0.10 | -0.34 | 5.47 |
| 2017-18 | MIN | 63 | 759:17 | 43.22 | 3.00 | 2.37 | 39.99 | 1.82 | 2.00 | 62.30 | 54.31 | 0.24 | -0.08 | 3.61 |
| 2018-19 | MIN | 46 | 548:06 | 43.35 | 2.63 | 2.47 | 37.00 | 3.17 | 2.04 | 45.28 | 54.74 | 0.02 | -0.01 | 0.31 |
| 2018-19 | CAR | 36 | 526:36 | 55.49 | 3.19 | 3.60 | 39.65 | 2.28 | 2.53 | 58.33 | 58.73 | 1.00 | 0.11 | 6.99 |
| 2018-19 | CAR, MIN | 82 | 1074:42 | 49.30 | 2.90 | 3.02 | 38.30 | 2.74 | 2.28 | 51.49 | 57.00 | 0.51 | 0.07 | 3.81 |
| 2019-20 | CAR | 67 | 820:08 | 47.33 | 2.05 | 2.76 | 37.24 | 2.05 | 2.30 | 50.00 | 54.47 | -0.03 | -0.26 | 2.35 |
| 2020-21 | CAR | 56 | 766:00 | 47.47 | 2.58 | 3.01 | 36.11 | 1.33 | 2.36 | 66.00 | 56.01 | 0.41 | -0.17 | 5.37 |
| 2021-22 | CAR | 75 | 970:25 | 50.08 | 3.59 | 3.26 | 35.43 | 2.04 | 2.39 | 63.74 | 57.64 | 0.26 | -0.19 | 3.96 |
| 2022-23 | WPG | 22 | 283:37 | 45.06 | 3.17 | 2.53 | 36.81 | 2.75 | 2.05 | 53.57 | 55.25 | -0.34 | -0.27 | 0.01 |
| 2022-23 | NSH | 56 | 723:24 | 45.29 | 2.57 | 2.89 | 43.46 | 2.41 | 2.62 | 51.67 | 52.38 | 0.21 | -0.23 | 4.00 |
| 2022-23 | NSH, WPG | 78 | 1007:01 | 45.22 | 2.74 | 2.79 | 41.59 | 2.50 | 2.46 | 52.27 | 53.09 | 0.06 | -0.24 | 2.87 |
| 2023-24 | WPG | 77 | 978:12 | 44.53 | 2.33 | 2.53 | 40.36 | 1.47 | 2.10 | 61.29 | 54.60 | 0.05 | -0.25 | 3.36 |
| 2024-25 | WPG | 82 | 1077:16 | 41.33 | 2.34 | 2.22 | 41.22 | 1.67 | 2.39 | 58.33 | 48.19 | -0.26 | 0.20 | -4.99 |
| 2025-26 | WPG | 61 | 727:23 | 37.53 | 1.57 | 2.21 | 36.71 | 2.31 | 2.33 | 40.43 | 48.73 | -0.17 | -0.42 | 2.35 |
NHL Edge Stats
| Skating | Shooting | Zone Time | |||||||||||
|---|---|---|---|---|---|---|---|---|---|---|---|---|---|
| Season | GP | Top Speed | Bursts>20/mi | Avg. Speed | Top Speed | Avg. Speed | %Long Range | %Mid Range | %High Danger | ES DZ% | ES NZ% | ES OZ% | |
| This table is for Basic and Premium subscribers only. To view please login to and/or subscribe to one of our subscription plans. | |||||||||||||
Legend
| Percentile 0-25 | Percentile 25-50 | Percentile 50-75 | Percentile 75-100 |
5v5 Lines
| Season | Teammate | Teammate | Team | TOI | GF/60 | GA/60 | GF% | xGF/60 | xGA/60 | xGF% | xGF Rel | xGA Rel | xGF% Rel |
|---|
Glossary
| Type | Statistic | Definition |
|---|---|---|
| Individual | G/60 | Goals Against per 60 minutes. |
| Individual | A/60 | Assists per 60 minutes. |
| Individual | Pts/60 | Points per 60 minutes. |
| Individual | xG/60 | Expected Goals per 60 minutes. |
| Individual | GAE/60 | Goals Above Expected (G/60 - xG/60). |
| Individual | Sh% | Shooting Percentage. |
| Individual | xSh% | Expected Shooting Percentage. |
| Individual | Sh%AE | Shooting percentage above expected (Sh% - xSh%). |
| Individual | %SA Rush | Percentage of shot attempts determined to be on the rush. |
| Individual | %SA Reb. | Percentage of shot attempts determined to be from rebounds. |
| On Ice | SAF/60 | Shot Attempts For per 60 minutes. |
| On Ice | GF/60 | Goals For per 60 minutes. |
| On Ice | xGF/60 | Expected Goals For per 60 minutes. |
| On Ice | SAA/60 | Shot Attempts Against per 60 minutes (lower is better). |
| On Ice | GA/60 | Goals Against per 60 minutes (lower is better). |
| On Ice | xGA/60 | Expected Goals Against per 60 minutes (lower is better). |
| On Ice | GF% | Goals For Percentage = Goals For / (Goals For + Goals Against) |
| On Ice | xGF% | Expected Goals For Percentage = Expected Goals For / (Expected Goals For + Expected Goals Against) |
| On Ice | xGF Rel | xGF/60 when On Ice - xGF/60 when not On Ice. |
| On Ice | xGA Rel | xGA/60 when On Ice - xGA/60 when not On Ice (lower is better). |
| On Ice | xGF% Rel | xGF% when On Ice - xGF% when not On Ice. |
News and Opinions
-
Weird Islanders: The Podcast! – Episode 89 – Nino Niederreiter (with guest Arthur Staple) at Yahoo Sports NHL (Fri Jun 12, 2026)
-
Weird Islanders: The Podcast! – Episode 89 – Nino Niederreiter (with guest Arthur Staple) at Lighthouse Hockey (Fri Jun 12, 2026)
-
Mark Scheifele and Ville Heinola have standout performances as IIHF World Championship round robin continues at Jets Nation (Fri May 22, 2026)
-
2026 IIHF World Championship update for the six Winnipeg Jets players after day 2 of the tournament at Jets Nation (Sun May 17, 2026)
-
Season finale at Canada Life Centre: San Jose Sharks vs. Winnipeg Jets game day at Jets Nation (Thu Apr 16, 2026)
-
Jets Namestnikov & Niederreiter to Return to Lineup After Long Injury Absences at The Hockey Writers (Mon Apr 6, 2026)
-
Winnipeg Jets head coach Scott Arniel confirms Nino Niederreiter had surgery at Illegal Curve Hockey (Sun Mar 1, 2026)
-
Jets Niederreiter & Pionk Out Week-to-Week With Injuries at The Hockey Writers (Tue Feb 24, 2026)
-
Winnipeg Jets head coach Scott Arniel indicates Nino Niederreiter and Neal Pionk are week-to-week at Illegal Curve Hockey (Tue Feb 24, 2026)
-
Winnipeg Jets’ Player Performances at the 2026 Winter Olympics at The Hockey Writers (Mon Feb 23, 2026)
-
Three Winnipeg Jets players remain in medal contention after the quarter-finals at the Olympics at Jets Nation (Thu Feb 19, 2026)
-
Recap of the Jets in action at the Winter Olympics during the preliminaries at Jets Nation (Sun Feb 15, 2026)
-
Winnipeg Jets at the 2026 Winter Olympics at Jets Nation (Sun Feb 8, 2026)
-
Winnipeg Jets Nino Niederreiter will be flag bearer for Switzerland at Winter Olympics opening ceremony at Illegal Curve Hockey (Thu Feb 5, 2026)
-
Halfway point of the season: Edmonton Oilers vs. Winnipeg Jets game day at Jets Nation (Thu Jan 8, 2026)
-
Three Takeaways: Hellebuyck makes 24 saves in return on Niederreiter’s special night at Jets Nation (Sun Dec 14, 2025)
-
Jets’ Nino Niederreiter Plays in 1000th-Career NHL Game at The Hockey Writers (Sun Dec 14, 2025)
-
From Chur to Winnipeg, Nino Niederreiter set to become first Swiss player to reach 1,000 NHL games at Illegal Curve Hockey (Sat Dec 13, 2025)
-
Takeaways: Preds' Rally Comes Up Short In Loss To Jets at Yahoo Sports NHL (Sun Nov 30, 2025)
-
Jets’ Bottom Six: Quietly Carrying the Load? at The Hockey Writers (Thu Oct 16, 2025)
-
Revisiting the Cal Clutterbuck-Nino Niederreiter Trade at The Hockey Writers (Wed Oct 1, 2025)
-
Winnipeg Jets 2025-26 Stat Leader Predictions at The Hockey Writers (Mon Sep 15, 2025)
-
A Trade a Day: It can't be overstated how great the 1-for-1 trade the Hurricanes made with the Wild was in 2019 at Cardiac Cane (Wed Aug 20, 2025)
-
Goals and expectations for the Swiss sniper Nino Niederreiter at Jets Nation (Sun Aug 17, 2025)
-
Niederreiter signing creates compound interest on great 2023 trade deadline at Jets White Out (Tue Dec 5, 2023)
Current Contract
Nino Niederreiter signed a $12,000,000 3-year contract with the Winnipeg Jets and General Manager Kevin Cheveldayoff on December 4, 2023 with an AAV of $4,000,000. This contract will start in 2024-25 and end after the 2026-27 season. In the first season of the contract the cap hit was equivalent to 4.55% of the salary cap.
Standard Contract (UFA) ( ) (0 ratings)
Nino Niederreiter signed a $8,000,000 2-year contract with the Nashville Predators and General Manager David Poile on July 21, 2022 with an AAV of $4,000,000. This contract will start in 2022-23 and end after the 2023-24 season. In the first season of the contract the cap hit was equivalent to 4.85% of the salary cap.
Standard Contract (UFA) ( ) (0 ratings)
| Season | Age* | Clause | Cap Hit | AAV | Perf. Bonus | Sign. Bonus | Salary | Compensation | Minors Salary | Status | |
|---|---|---|---|---|---|---|---|---|---|---|---|
| 2022-23 | 30 | $4,000,000 | $4,000,000 | - | - | $4,000,000 | $4,000,000 | $4,000,000 | UFA | ||
| 2023-24 | 31 | $4,000,000 | $4,000,000 | - | - | $4,000,000 | $4,000,000 | $4,000,000 | UFA | ||
| Total | - | - | $8,000,000 | $8,000,000 | $8,000,000 |
Nino Niederreiter signed a $26,250,000 5-year contract with the Minnesota Wild and General Manager Chuck Fletcher on July 30, 2017 with an AAV of $5,250,000. This contract will start in 2017-18 and end after the 2021-22 season. In the first season of the contract the cap hit was equivalent to 7.00% of the salary cap.
Standard Contract (RFA) ( ) (0 ratings)
| Season | Age* | Clause | Cap Hit | AAV | Perf. Bonus | Sign. Bonus | Salary | Compensation | Minors Salary | Status | |
|---|---|---|---|---|---|---|---|---|---|---|---|
| 2017-18 | 25 | $5,250,000 | $5,250,000 | - | - | $4,600,000 | $4,600,000 | $4,600,000 | RFA-arb | ||
| 2018-19 | 26 | $5,250,000 | $5,250,000 | - | - | $6,075,000 | $6,075,000 | $6,075,000 | UFA | ||
| 2019-20 | 27 | $5,250,000 | $5,250,000 | - | - | $5,850,000 | $5,850,000 | $5,850,000 | UFA | ||
| 2020-21 | 28 | $5,250,000 | $5,250,000 | - | - | $4,250,000 | $4,250,000 | $4,250,000 | UFA | ||
| 2021-22 | 29 | $5,250,000 | $5,250,000 | - | - | $5,475,000 | $5,475,000 | $5,475,000 | UFA | ||
| Total | - | - | $26,250,000 | $26,250,000 | $26,250,000 |
Nino Niederreiter signed a $8,000,000 3-year contract with the Minnesota Wild and General Manager Chuck Fletcher on September 20, 2014 with an AAV of $2,666,667. This contract will start in 2014-15 and end after the 2016-17 season. In the first season of the contract the cap hit was equivalent to 3.86% of the salary cap.
Standard Contract (RFA) ( ) (0 ratings)
| Season | Age* | Clause | Cap Hit | AAV | Perf. Bonus | Sign. Bonus | Salary | Compensation | Minors Salary | Status | |
|---|---|---|---|---|---|---|---|---|---|---|---|
| 2014-15 | 22 | $2,666,667 | $2,666,667 | - | - | $1,900,000 | $1,900,000 | $1,900,000 | RFA | ||
| 2015-16 | 23 | $2,666,667 | $2,666,667 | - | - | $2,600,000 | $2,600,000 | $2,600,000 | RFA-arb | ||
| 2016-17 | 24 | $2,666,667 | $2,666,667 | - | - | $3,500,000 | $3,500,000 | $3,500,000 | RFA-arb | ||
| Total | - | - | $8,000,000 | $8,000,000 | $8,000,000 |
Nino Niederreiter signed a $2,700,000 3-year contract with the New York Islanders and General Manager Garth Snow on September 21, 2010 with an AAV of $900,000. This contract will start in 2010-11 and end after the 2013-14 season. In the first season of the contract the cap hit was equivalent to 1.52% of the salary cap.
Entry Level Contract ( ) (0 ratings)
| Season | Age* | Clause | Cap Hit | AAV | Perf. Bonus | Sign. Bonus | Salary | Compensation | Minors Salary | Status | |
|---|---|---|---|---|---|---|---|---|---|---|---|
| 2010-11 | 18 | $900,000 | $2,825,000 | - | $90,000 | - | $90,000 | - | ELC | ||
| 2011-12 | 19 | $870,000 | $2,795,000 | $1,925,000 | $90,000 | $810,000 | $900,000 | $67,500 | ELC | ||
| 2012-13 | 20 | $870,000 | $2,795,000 | $1,925,000 | $90,000 | $810,000 | $900,000 | $67,500 | ELC | ||
| 2013-14 | 21 | $870,000 | $2,795,000 | $1,925,000 | - | $810,000 | $810,000 | $67,500 | ELC | ||
| Total | $5,775,000 | $270,000 | $2,430,000 | $2,700,000 | $202,500 |
Career Statistics
| Regular Season | Playoffs | |||||||||||||||||||
|---|---|---|---|---|---|---|---|---|---|---|---|---|---|---|---|---|---|---|---|---|
| Season | League | Team | GP | G | A | Pts | +/- | PIM | Shots | Sh% | TOI/G | GP | G | A | Pts | +/- | PIM | Shots | Sh% | TOI/G |
| 2006-07 | Swiss-U18 | Davos U18 | 32 | 43 | 19 | 62 | 38 | |||||||||||||
| 2006-07 | Swiss-Jr. | Davos Jr. | 1 | 4 | 0.0 | |||||||||||||||
| 2007-08 | Swiss-U18 | Davos U18 | 32 | 39 | 26 | 65 | 62 | 5 | 6 | 3 | 9 | 4 | 0.0 | |||||||
| 2007-08 | Swiss-Jr. | Davos Jr. | 8 | 7 | 3 | 10 | 4 | 3 | 1 | 1 | 8 | 0.0 | ||||||||
| 2008-09 | Swiss-U18 | Davos U18 | 6 | 6 | 6 | 12 | 6 | |||||||||||||
| 2008-09 | WJ18-A | Switzerland | 6 | 3 | 3 | 6 | 16 | |||||||||||||
| 2008-09 | Swiss-Jr. | Davos Jr. | 30 | 20 | 14 | 34 | 44 | 8 | 5 | 6 | 11 | 12 | 0.0 | |||||||
| 2008-09 | Swiss | Davos | 3 | 1 | 1 | 0.0 | ||||||||||||||
| 2009-10 | WHL | Portland | 65 | 36 | 24 | 60 | +11 | 68 | 13 | 8 | 8 | 16 | +1 | 16 | ||||||
| 2010-11 | NHL | New York Islanders | 9 | 1 | 1 | 2 | -1 | 8 | 12 | 8.3 | 13:36 | |||||||||
| 2010-11 | WJC-A | Switzerland | 6 | 2 | 2 | 4 | -1 | 12 | ||||||||||||
| 2010-11 | WHL | Portland | 55 | 41 | 29 | 70 | +28 | 67 | 21 | 9 | 18 | 27 | +5 | 30 | ||||||
| 2011-12 | NHL | New York Islanders | 55 | 1 | 0 | 1 | -29 | 12 | 74 | 1.4 | 10:07 | |||||||||
| 2011-12 | WC-A | Switzerland | 6 | 0 | 0 | 0 | -5 | 2 | ||||||||||||
| 2011-12 | AHL | Bridgeport | 6 | 3 | 1 | 4 | +4 | 4 | 16 | 1,875.0 | ||||||||||
| 2012-13 | AHL | Bridgeport | 74 | 28 | 22 | 50 | -5 | 38 | 230 | 1,217.0 | ||||||||||
| 2012-13 | WC-A | Switzerland | 10 | 5 | 3 | 8 | +3 | 2 | ||||||||||||
| 2013-14 | Olympics | Switzerland | 4 | 0 | 0 | 0 | +2 | 2 | 10 | |||||||||||
| 2013-14 | NHL | Minnesota Wild | 81 | 14 | 22 | 36 | +12 | 44 | 143 | 9.8 | 14:06 | 13 | 3 | 3 | 6 | 8 | 22 | 13.6 | 14:40 | |
| 2014-15 | NHL | Minnesota Wild | 80 | 24 | 13 | 37 | +2 | 28 | 149 | 16.1 | 14:33 | 10 | 4 | 1 | 5 | -2 | 10 | 19 | 21.0 | 15:06 |
| 2015-16 | WC-A | Switzerland | 7 | 3 | 3 | 6 | +6 | 2 | 30 | |||||||||||
| 2015-16 | NHL | Minnesota Wild | 82 | 20 | 23 | 43 | +9 | 36 | 159 | 12.6 | 15:33 | 6 | 1 | 5 | 6 | +1 | 4 | 19 | 5.3 | 15:26 |
| 2016-17 | WCup | Team Europe | 6 | 0 | 1 | 1 | +1 | 2 | ||||||||||||
| 2016-17 | NHL | Minnesota Wild | 82 | 25 | 32 | 57 | +17 | 53 | 186 | 13.4 | 15:04 | 5 | 1 | 1 | -2 | 2 | 7 | 0.0 | 15:58 | |
| 2017-18 | WC | Switzerland | 10 | 4 | 5 | 9 | +6 | 10 | ||||||||||||
| 2017-18 | NHL | Minnesota Wild | 63 | 18 | 14 | 32 | +14 | 36 | 133 | 13.5 | 15:00 | 5 | -4 | 9 | 0.0 | 15:58 | ||||
| 2018-19 | NHL | Minnesota Wild | 46 | 9 | 14 | 23 | -11 | 10 | 81 | 11.1 | 14:37 | |||||||||
| 2018-19 | WC | Switzerland | 2 | 1 | 1 | 2 | -1 | |||||||||||||
| 2018-19 | NHL | Carolina Hurricanes | 36 | 14 | 16 | 30 | +7 | 20 | 103 | 13.6 | 18:17 | 15 | 1 | 3 | 4 | 12 | 28 | 3.6 | 18:38 | |
| 2019-20 | NHL | Carolina Hurricanes | 67 | 11 | 18 | 29 | -3 | 42 | 115 | 9.6 | 14:49 | 7 | 1 | 1 | 2 | -6 | 2 | 17 | 5.9 | 13:13 |
| 2020-21 | NHL | Carolina Hurricanes | 56 | 20 | 14 | 34 | +20 | 29 | 126 | 15.9 | 15:43 | 7 | 1 | 1 | -1 | 8 | 10 | 10.0 | 15:25 | |
| 2021-22 | NHL | Carolina Hurricanes | 75 | 24 | 20 | 44 | +29 | 34 | 144 | 16.7 | 14:50 | 14 | 4 | 1 | 5 | -5 | 10 | 27 | 14.8 | 16:31 |
| 2022-23 | NHL | Nashville Predators | 56 | 18 | 10 | 28 | -9 | 16 | 130 | 13.8 | 16:03 | |||||||||
| 2022-23 | NHL | Winnipeg Jets | 22 | 6 | 7 | 13 | -4 | 6 | 51 | 11.8 | 16:54 | 5 | 1 | 3 | 4 | -7 | 2 | 10 | 10.0 | 17:03 |
| 2023-24 | NHL | Winnipeg Jets | 77 | 18 | 16 | 34 | +12 | 34 | 170 | 10.6 | 14:58 | 5 | 2 | 2 | -5 | 4 | 9 | 0.0 | 13:33 | |
| 2024-25 | WC | Switzerland | 4 | 2 | 3 | 5 | +2 | |||||||||||||
| 2024-25 | NHL | Winnipeg Jets | 82 | 17 | 20 | 37 | +16 | 24 | 150 | 11.3 | 14:51 | 13 | 4 | 2 | 6 | -3 | 10 | 25 | 16.0 | 15:29 |
| 2025-26 | NHL | Winnipeg Jets | 61 | 8 | 11 | 19 | -7 | 18 | 84 | 9.5 | 13:46 | |||||||||
| 2025-26 | OG | Switzerland | 5 | 1 | 0 | 1 | -3 | 2 | 10 | 10.0 | 15:21 | |||||||||
| NHL Career | 1030 | 248 | 251 | 499 | +74 | 450 | 2010 | 12.3 | 14:48 | 105 | 20 | 22 | 42 | -34 | 72 | 202 | 9.9 | 15:48 | ||