
 Nico Sturm
| Position | Center | Current Team | Minnesota Wild |
| Shoots | Left | Current Contract | 2 years ($2.0M CapHit) |
| Height | 6'3" | Expires | 2026-27 |
| Weight (lbs) | 209 | Expiry Age (Jun 30) | 32 |
| Age (DOB) | 31 (May 3, 1995) | Expiry Status | UFA |
| Drafted | Undrafted |
| Date | Team | Transaction | |
|---|---|---|---|
| Nov 21, 2025 | Minnesota Wild | Activated from IR | |
| Oct 7, 2025 | Minnesota Wild | Placed on IR | |
| Jul 1, 2025 | Minnesota Wild | Signed 2 years @ $2.000M AAV starting in 2025-26 | |
| Mar 6, 2025 | Florida Panthers | Acquired from San Jose Sharks | |
| Mar 6, 2025 | San Jose Sharks | Traded to Florida Panthers | |
| Feb 23, 2025 | San Jose Sharks | Activated from IR | |
| Jan 24, 2025 | San Jose Sharks | Placed on IR | |
| Nov 25, 2024 | San Jose Sharks | Activated from IR | |
| Nov 18, 2024 | San Jose Sharks | Placed on IR | |
| Jul 13, 2022 | San Jose Sharks | Signed 3 years @ $2.000M AAV starting in 2022-23 | |
| Oct 5, 2020 | Minnesota Wild | Signed 2 years @ $725K AAV starting in 2020-21 | |
| Jul 16, 2019 | Minnesota Wild | Signed 1 year @ $874K AAV starting in 2019-20 | |
| Apr 1, 2019 | Minnesota Wild | Signed to an entry level contract. |
Player Card(s)

URL: https://thestanleycap.com/cdn/player_cards/20252026/nico-sturm-8481477.png
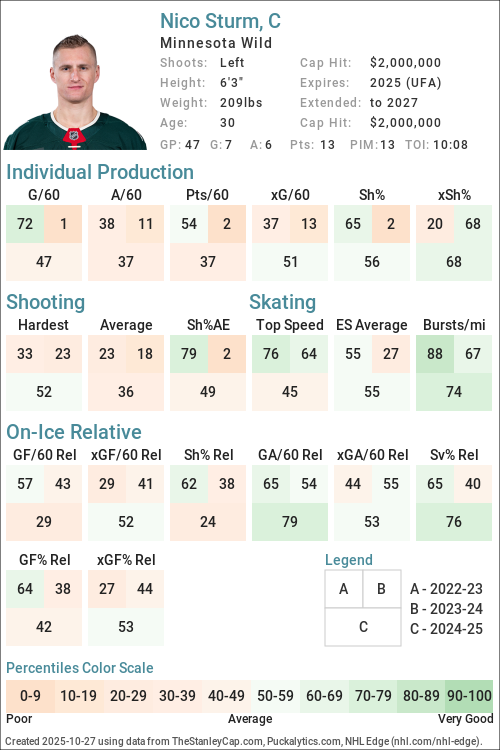
URL: https://thestanleycap.com/cdn/player_cards/20242025/nico-sturm-8481477.png
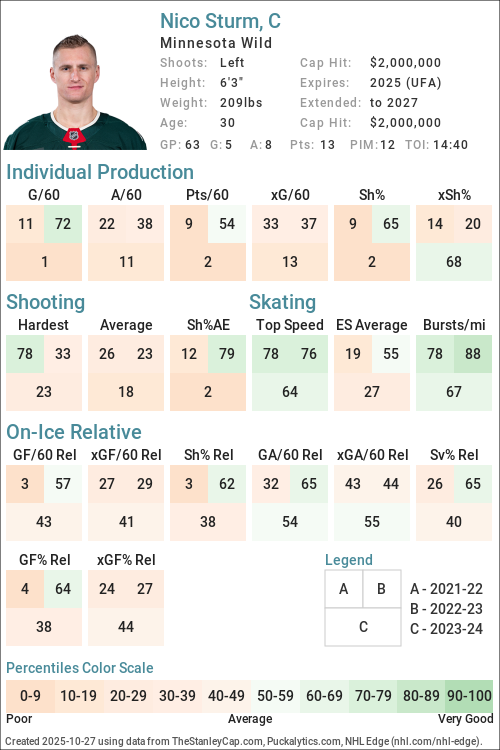
URL: https://thestanleycap.com/cdn/player_cards/20232024/nico-sturm-8481477.png
About Player Cards
Player cards present an infographic of a players performance using a series of Player Archetypes developed for Puckalytics.com and TheStanleyCap.com. The boxes in the rink image show the archetype ratings for the season specified in the card while the graphs to the right show the five-year trends for those archetypes.
Except for Faceoffs, the values shown are the players z-score (standard deviation from the mean) for the specific metric used to calculate the archetype values. When calculating z-scores forwards were compared to forwards and defensemen were compared to defensemen. Positive values indicate the player is above average and shaded in blue, while negative values indicate the player is below average and shaded in pink. The five year trend charts show a range of -4.0 to 4.0.
The value shown for Faceoffs is the faceoff winning percentage rather than their z-score with winning percentages below 50 in pink shades and above 50 in blue shades.
All archetypes are 5v5 except 5v4 TOI, 4v5 TOI, Skating (even strength) and Faceoffs (all situations). Archetypes use regular season data only.
Archetypes Summary
- Sniper - Measures the to score above the expected goal rate.
- Rebound - Measures the percent of a players shot attempts that come from rebounds (forwards only).
- 5v4 TOI - Powerplay ice time, calculated as the percentage of his teams 5v4 ice time that the player was on the ice for.
- Shooter - Measures whether a players points come from shots (goals or assists on rebounds from his shots).
- Producer - Measures a players ability to produce goals and assists, adjusted for quality of teammates.
- Playmaker - Measures whether a players points come from passes.
- Drive - Measures a players ability to drive puck possession and generate shot attempts for his team.
- Rush - Measures the percent of a players shot attempts that come from rush plays
- Possession - An indicator of a players ability to improve his teams puck possession game.
- Faceoffs - Faceoff Winning Percentage (min. 75 faceoffs taken).
- 5v5 TOI - The percentage of his teams 5v5 TOI that the player was on the ice for.
- Suppress - Measures a players ability to suppress opponent puck possession and shot attempts against.
- Skating - An indicator of a players skating ability, or speed bursts above 20mph per mile skated.
- Defend - An indicator of a players ability to suppress shot quality against.
- 4v5 TOI - Penalty Kill ice time, calculated as the percentage of his teams 4v5 ice time that the player was on the ice for.
Data Sources
- Salary data is from TheStanleyCap.com
- Skating data is from NHL Edge
- Other statistics are from Puckalytics.com and derived from data from NHL.com
Terms of Use
You are free to use include player cards in written articles, share on social media, or on other public websites under the following conditions:
- You credit TheStanleyCap.com as the source and provide a link back to TheStanleyCap.com or this player page.
- You do not mass copy/duplicate/publish dozens or hundreds of player cards. A few, or a handful for a written article is fine. Be reasonable. Fair use rules apply.
- If you are a high-traffic website you must download and host the image(s) on your site rather than overload TheStanleyCap servers with traffic.
Note: Player cards will update daily throughout the season so if you want to include snapshot then you must download the image.
If you have any questions, send an e-mail to the e-mail address at the top of this page.
Read Introducing Player Archetypes on HockeyAnalysis.com for more details on archetype calculations.
Core Archetypes
| Season | Team(s) | GP | TOI | Producer | Playmaker | Shooter | Sniper | Rebound | Rush | Skating | Defend |
|---|---|---|---|---|---|---|---|---|---|---|---|
| 2018-19 | MIN | 2 | - | - | - | -2.11 | -2.24 | -2.02 | - | 4.81 | |
| 2019-20 | MIN | 6 | 0.30 | 4.54 | -1.47 | -1.86 | -2.06 | -1.80 | - | 4.66 | |
| 2020-21 | MIN | 50 | 0.13 | -0.78 | 1.20 | 0.97 | 1.23 | 2.04 | - | 0.12 | |
| 2021-22 | COL, MIN | 74 | -1.26 | -0.58 | -1.22 | -0.83 | 0.75 | 0.73 | 0.70 | -0.62 | |
| 2022-23 | SJS | 74 | -0.07 | -0.76 | 0.60 | 0.91 | -0.91 | -0.08 | 1.23 | 0.34 | |
| 2023-24 | SJS | 63 | -1.77 | -1.04 | -1.36 | -1.63 | -0.31 | 0.40 | 0.30 | -0.23 | |
| 2024-25 | FLA, SJS | 62 | 0.01 | -0.24 | 0.13 | -0.11 | -0.02 | 0.01 | 0.61 | 0.78 | |
| 2025-26 | MIN | 49 | -1.00 | -0.68 | -0.78 | -0.54 | 0.66 | -0.38 | -0.21 | 0.76 |
Situational and Secondary Archetypes
| Season | Team(s) | GP | TOI | 5v5 TOI | 5v4 TOI | 4v5 TOI | Possession | Drive | Suppress | Faceoffs |
|---|---|---|---|---|---|---|---|---|---|---|
| 2018-19 | MIN | 2 | -0.56 | -1.82 | -0.78 | 6.09 | 5.01 | 3.42 | - | |
| 2019-20 | MIN | 6 | -0.68 | -2.09 | -1.31 | 0.50 | -2.42 | 4.60 | - | |
| 2020-21 | MIN | 50 | -1.77 | -2.09 | -0.29 | 0.17 | 0.16 | 0.07 | 51.5 | |
| 2021-22 | COL, MIN | 74 | -1.24 | -1.91 | 0.22 | -0.65 | -0.47 | -0.56 | 53.0 | |
| 2022-23 | SJS | 74 | -0.43 | -1.13 | 0.85 | -0.31 | -0.27 | -0.14 | 55.8 | |
| 2023-24 | SJS | 63 | -0.32 | -1.65 | 0.80 | 0.02 | -0.21 | 0.46 | 60.1 | |
| 2024-25 | FLA, SJS | 62 | -1.89 | -1.94 | -0.32 | 0.35 | 0.21 | 0.29 | 58.8 | |
| 2025-26 | MIN | 49 | -1.91 | -1.85 | 0.65 | -0.76 | -1.04 | 0.24 | 55.1 |
5v5 Individual Stats
| Season | Team(s) | GP | TOI | G/60 | A/60 | Pts/60 | xG/60 | GAE/60 | Sh% | xSh% | Sh%AE | %SA Rush | %SA Reb. |
|---|---|---|---|---|---|---|---|---|---|---|---|---|---|
| 2018-19 | MIN | 2 | 23:18 | 0.00 | 0.00 | 0.00 | 1.32 | -1.32 | 0.00 | 7.30 | -7.30 | 0.00 | 0.00 |
| 2019-20 | MIN | 6 | 64:53 | 0.00 | 1.85 | 1.85 | 0.13 | -0.13 | 0.00 | 6.83 | -6.83 | 0.00 | 0.00 |
| 2020-21 | MIN | 50 | 465:10 | 1.16 | 0.77 | 1.93 | 0.84 | 0.32 | 15.00 | 10.80 | 4.20 | 8.11 | 9.46 |
| 2021-22 | MIN | 53 | 502:22 | 0.48 | 0.60 | 1.07 | 0.60 | -0.12 | 6.56 | 8.20 | -1.64 | 7.41 | 9.88 |
| 2021-22 | COL | 21 | 231:34 | 0.00 | 0.78 | 0.78 | 0.42 | -0.42 | 0.00 | 6.72 | -6.72 | 0.00 | 3.45 |
| 2021-22 | COL, MIN | 74 | 733:56 | 0.33 | 0.65 | 0.98 | 0.54 | -0.21 | 4.71 | 7.78 | -3.07 | 5.45 | 8.18 |
| 2022-23 | SJS | 74 | 845:49 | 0.85 | 0.85 | 1.70 | 0.66 | 0.20 | 12.00 | 9.24 | 2.76 | 3.62 | 4.35 |
| 2023-24 | SJS | 63 | 728:22 | 0.16 | 0.49 | 0.66 | 0.45 | -0.29 | 3.51 | 9.59 | -6.09 | 4.71 | 7.06 |
| 2024-25 | SJS | 47 | 420:34 | 0.86 | 0.86 | 1.71 | 0.64 | 0.21 | 17.14 | 12.86 | 4.28 | 1.82 | 9.09 |
| 2024-25 | FLA | 15 | 142:40 | 0.00 | 0.42 | 0.42 | 0.75 | -0.75 | 0.00 | 9.37 | -9.37 | 3.70 | 3.70 |
| 2024-25 | FLA, SJS | 62 | 563:14 | 0.64 | 0.75 | 1.38 | 0.67 | -0.03 | 11.11 | 11.63 | -0.52 | 2.44 | 7.32 |
| 2025-26 | MIN | 49 | 436:38 | 0.41 | 0.55 | 0.96 | 0.52 | -0.11 | 10.71 | 13.64 | -2.92 | 2.04 | 10.20 |
5v5 On Ice Stats
| Season | Team(s) | GP | TOI | SAF/60 | GF/60 | xGF/60 | SAA/60 | GA/60 | xGA/60 | GF% | xGF% | xGF Rel | xGA Rel | xGF% Rel |
|---|---|---|---|---|---|---|---|---|---|---|---|---|---|---|
| 2018-19 | MIN | 2 | 23:18 | 54.08 | 0.00 | 2.92 | 43.78 | 0.00 | 3.13 | - | 48.21 | 1.03 | -1.05 | 17.12 |
| 2019-20 | MIN | 6 | 64:53 | 33.29 | 2.77 | 1.74 | 32.37 | 0.92 | 1.34 | 75.00 | 56.36 | -0.94 | -1.20 | 5.11 |
| 2020-21 | MIN | 50 | 465:10 | 37.92 | 3.22 | 2.43 | 41.40 | 2.19 | 2.04 | 59.52 | 54.33 | 0.17 | -0.12 | 3.20 |
| 2021-22 | MIN | 53 | 502:22 | 43.95 | 1.91 | 2.34 | 44.43 | 3.11 | 2.61 | 38.10 | 47.32 | -0.20 | 0.35 | -5.68 |
| 2021-22 | COL | 21 | 231:34 | 38.35 | 2.07 | 1.98 | 42.49 | 2.33 | 2.07 | 47.06 | 48.94 | -0.83 | -0.54 | -3.01 |
| 2021-22 | COL, MIN | 74 | 733:56 | 42.18 | 1.96 | 2.23 | 43.82 | 2.86 | 2.44 | 40.68 | 47.76 | -0.39 | 0.08 | -4.91 |
| 2022-23 | SJS | 74 | 845:49 | 39.44 | 2.62 | 2.50 | 43.91 | 3.19 | 2.76 | 45.12 | 47.52 | -0.27 | -0.05 | -2.11 |
| 2023-24 | SJS | 63 | 728:22 | 36.08 | 1.65 | 1.93 | 47.45 | 3.30 | 2.98 | 33.33 | 39.25 | -0.09 | 0.01 | -1.08 |
| 2024-25 | SJS | 47 | 420:34 | 37.66 | 2.14 | 2.18 | 44.08 | 2.71 | 2.76 | 44.12 | 44.12 | -0.02 | -0.10 | 0.68 |
| 2024-25 | FLA | 15 | 142:40 | 49.21 | 0.84 | 2.81 | 44.58 | 1.26 | 2.08 | 40.00 | 57.45 | 0.41 | -0.30 | 7.22 |
| 2024-25 | FLA, SJS | 62 | 563:14 | 40.59 | 1.81 | 2.34 | 44.21 | 2.34 | 2.59 | 43.59 | 47.48 | 0.09 | -0.16 | 2.45 |
| 2025-26 | MIN | 49 | 436:38 | 37.38 | 1.51 | 2.28 | 42.19 | 1.92 | 2.53 | 44.00 | 47.47 | -0.42 | -0.11 | -3.09 |
NHL Edge Stats
| Skating | Shooting | Zone Time | |||||||||||
|---|---|---|---|---|---|---|---|---|---|---|---|---|---|
| Season | GP | Top Speed | Bursts>20/mi | Avg. Speed | Top Speed | Avg. Speed | %Long Range | %Mid Range | %High Danger | ES DZ% | ES NZ% | ES OZ% | |
| This table is for Basic and Premium subscribers only. To view please login to and/or subscribe to one of our subscription plans. | |||||||||||||
Legend
| Percentile 0-25 | Percentile 25-50 | Percentile 50-75 | Percentile 75-100 |
5v5 Lines
| Season | Teammate | Teammate | Team | TOI | GF/60 | GA/60 | GF% | xGF/60 | xGA/60 | xGF% | xGF Rel | xGA Rel | xGF% Rel |
|---|
Glossary
| Type | Statistic | Definition |
|---|---|---|
| Individual | G/60 | Goals Against per 60 minutes. |
| Individual | A/60 | Assists per 60 minutes. |
| Individual | Pts/60 | Points per 60 minutes. |
| Individual | xG/60 | Expected Goals per 60 minutes. |
| Individual | GAE/60 | Goals Above Expected (G/60 - xG/60). |
| Individual | Sh% | Shooting Percentage. |
| Individual | xSh% | Expected Shooting Percentage. |
| Individual | Sh%AE | Shooting percentage above expected (Sh% - xSh%). |
| Individual | %SA Rush | Percentage of shot attempts determined to be on the rush. |
| Individual | %SA Reb. | Percentage of shot attempts determined to be from rebounds. |
| On Ice | SAF/60 | Shot Attempts For per 60 minutes. |
| On Ice | GF/60 | Goals For per 60 minutes. |
| On Ice | xGF/60 | Expected Goals For per 60 minutes. |
| On Ice | SAA/60 | Shot Attempts Against per 60 minutes (lower is better). |
| On Ice | GA/60 | Goals Against per 60 minutes (lower is better). |
| On Ice | xGA/60 | Expected Goals Against per 60 minutes (lower is better). |
| On Ice | GF% | Goals For Percentage = Goals For / (Goals For + Goals Against) |
| On Ice | xGF% | Expected Goals For Percentage = Expected Goals For / (Expected Goals For + Expected Goals Against) |
| On Ice | xGF Rel | xGF/60 when On Ice - xGF/60 when not On Ice. |
| On Ice | xGA Rel | xGA/60 when On Ice - xGA/60 when not On Ice (lower is better). |
| On Ice | xGF% Rel | xGF% when On Ice - xGF% when not On Ice. |
News and Opinions
-
Wild 2025-26 Report Cards: Nico Sturm at The Hockey Writers (Wed Jul 15, 2026)
-
Wild’s costly free agent mistake is still haunting them one year later at Gone Puck Wild (Wed Jun 24, 2026)
-
3 Takeaways From the Wild’s 2-1 Loss to the Blackhawks at The Hockey Writers (Fri Mar 20, 2026)
-
Wild’s Nico Sturm Talks Faceoffs, Being a Student of the Game & More at The Hockey Writers (Tue Jan 13, 2026)
-
Preview/Lines #40: Nico Sturm Proud of Celebrini, Mukhamadullin Game-Time Decision at San Jose Hockey Now (Wed Dec 31, 2025)
-
Nico Sturm Has Addressed Two Of the Wild's Greatest Weaknesses at Hockey Wilderness (Tue Dec 23, 2025)
-
Wild’s Nico Sturm Brings High Hockey I.Q. to Team at The Hockey Writers (Mon Sep 22, 2025)
-
Nico Sturm Is A Small But Meaningful Upgrade Over Freddy Gaudreau at Hockey Wilderness (Wed Jul 23, 2025)
-
Will Nico Sturm's Faceoffs Be A Game-Changer For the Wild? at Hockey Wilderness (Mon Jul 21, 2025)
-
The Wild Need Everything To Go Right To Contend Next Year at Hockey Wilderness (Tue Jul 15, 2025)
-
5 New Jersey Devils free agent alternatives to Cody Glass at Pucks and Pitchforks (Sat Jun 21, 2025)
Current Contract
Nico Sturm signed a $4,000,000 2-year contract with the Minnesota Wild and General Manager Bill Guerin on July 1, 2025 with an AAV of $2,000,000. This contract will start in 2025-26 and end after the 2026-27 season. In the first season of the contract the cap hit was equivalent to 2.09% of the salary cap.
Standard Contract (UFA) ( ) (0 ratings)
Nico Sturm signed a $6,000,000 3-year contract with the San Jose Sharks and General Manager Mike Grier on July 13, 2022 with an AAV of $2,000,000. This contract will start in 2022-23 and end after the 2024-25 season. In the first season of the contract the cap hit was equivalent to 2.42% of the salary cap.
Standard Contract (RFA) ( ) (0 ratings)
| Season | Age* | Clause | Cap Hit | AAV | Perf. Bonus | Sign. Bonus | Salary | Compensation | Minors Salary | Status | |
|---|---|---|---|---|---|---|---|---|---|---|---|
| 2022-23 | 27 | $2,000,000 | $2,000,000 | - | - | $2,000,000 | $2,000,000 | $2,000,000 | UFA | ||
| 2023-24 | 28 | $2,000,000 | $2,000,000 | - | - | $2,000,000 | $2,000,000 | $2,000,000 | UFA | ||
| 2024-25 | 29 | $2,000,000 | $2,000,000 | - | - | $2,000,000 | $2,000,000 | $2,000,000 | UFA | ||
| Total | - | - | $6,000,000 | $6,000,000 | $6,000,000 |
Nico Sturm signed a $1,450,000 2-year contract with the Minnesota Wild and General Manager Bill Guerin on October 5, 2020 with an AAV of $725,000. This contract will start in 2020-21 and end after the 2021-22 season. In the first season of the contract the cap hit was equivalent to 0.89% of the salary cap.
Standard Contract (RFA) ( ) (0 ratings)
| Season | Age* | Clause | Cap Hit | AAV | Perf. Bonus | Sign. Bonus | Salary | Compensation | Minors Salary | Status | |
|---|---|---|---|---|---|---|---|---|---|---|---|
| 2020-21 | 25 | $725,000 | $725,000 | - | - | $700,000 | $700,000 | $700,000 | RFA-arb | ||
| 2021-22 | 26 | $725,000 | $725,000 | - | - | $750,000 | $750,000 | $750,000 | RFA-arb | ||
| Total | - | - | $1,450,000 | $1,450,000 | $1,450,000 |
Nico Sturm signed a $874,125 1-year contract with the Minnesota Wild and General Manager Paul Fenton on July 16, 2019 with an AAV of $874,125. This contract will start in 2019-20 and end after the 2019-20 season. In the first season of the contract the cap hit was equivalent to 1.07% of the salary cap.
Standard Contract (RFA) ( ) (0 ratings)
| Season | Age* | Clause | Cap Hit | AAV | Perf. Bonus | Sign. Bonus | Salary | Compensation | Minors Salary | Status | |
|---|---|---|---|---|---|---|---|---|---|---|---|
| 2019-20 | 24 | $874,125 | $874,125 | - | - | $874,125 | $874,125 | $70,000 | 10.2(c) | ||
| Total | - | - | $874,125 | $874,125 | $70,000 |
Nico Sturm signed a $925,000 1-year contract with the Minnesota Wild and General Manager Paul Fenton on April 1, 2019 with an AAV of $423,500. This contract will start in 2018-19 and end after the 2018-19 season. In the first season of the contract the cap hit was equivalent to 0.53% of the salary cap.
Entry Level Contract ( ) (0 ratings)
| Season | Age* | Clause | Cap Hit | AAV | Perf. Bonus | Sign. Bonus | Salary | Compensation | Minors Salary | Status | |
|---|---|---|---|---|---|---|---|---|---|---|---|
| 2018-19 | 23 | $423,500 | $423,500 | - | $92,500 | $832,500 | $925,000 | $70,000 | ELC | ||
| Total | - | $92,500 | $832,500 | $925,000 | $70,000 |
Career Statistics
| Regular Season | Playoffs | |||||||||||||||||||
|---|---|---|---|---|---|---|---|---|---|---|---|---|---|---|---|---|---|---|---|---|
| Season | League | Team | GP | G | A | Pts | +/- | PIM | Shots | Sh% | TOI/G | GP | G | A | Pts | +/- | PIM | Shots | Sh% | TOI/G |
| 2007-08 | Schüler-BL | Augsburger EV U16 | 28 | 8 | 14 | 22 | 16 | |||||||||||||
| 2008-09 | Schüler-BL | Augsburger EV U16 | 26 | 12 | 23 | 35 | 10 | |||||||||||||
| 2009-10 | Schüler-BL | ESV Kaufbeuren U16 | 30 | 26 | 28 | 54 | 40 | |||||||||||||
| 2010-11 | Schüler-BL | ESV Kaufbeuren U16 | 28 | 24 | 39 | 63 | 26 | |||||||||||||
| 2010-11 | Jugend-BL | ESV Kaufbeuren U18 | 14 | 0 | 7 | 7 | 4 | 2 | 1 | 1 | ||||||||||
| 2011-12 | Jugend-BL | HC Landsberg U18 | 4 | 8 | 3 | 11 | 6 | |||||||||||||
| 2011-12 | DNL | ESV Kaufbeuren U18 | 31 | 3 | 4 | 7 | -11 | 33 | 3 | |||||||||||
| 2012-13 | DNL | ESV Kaufbeuren U18 | 33 | 11 | 22 | 33 | 22 | |||||||||||||
| 2013-14 | DNL | ESV Kaufbeuren U18 | 24 | 13 | 21 | 34 | 20 | |||||||||||||
| 2013-14 | NAHL | Corpus Christi IceRays | 21 | 1 | 2 | 3 | -5 | 2 | ||||||||||||
| 2014-15 | WJC-20 | Germany U20 | 6 | 0 | 0 | 0 | -8 | 12 | ||||||||||||
| 2014-15 | NAHL | Austin Bruins | 53 | 11 | 30 | 41 | +29 | 28 | 13 | 7 | 6 | 13 | +8 | |||||||
| 2015-16 | USHL | Tri-City Storm | 57 | 14 | 25 | 39 | +11 | 47 | 5 | 3 | 3 | 6 | +4 | |||||||
| 2016-17 | NCAA | Clarkson Univ. | 39 | 8 | 13 | 21 | +4 | 37 | ||||||||||||
| 2017-18 | NCAA | Clarkson Univ. | 40 | 14 | 23 | 37 | +20 | 14 | ||||||||||||
| 2018-19 | NCAA | Clarkson Univ. | 39 | 14 | 31 | 45 | +23 | 29 | ||||||||||||
| 2018-19 | NHL | Minnesota Wild | 2 | 0 | 0 | 0 | 7 | 0.0 | 12:47 | |||||||||||
| 2019-20 | AHL | Iowa Wild | 55 | 12 | 20 | 32 | +9 | 18 | ||||||||||||
| 2019-20 | NHL | Minnesota Wild | 6 | 0 | 2 | 2 | +2 | 2 | 0.0 | 11:54 | 2 | 1 | 1 | -1 | 1 | 100.0 | 11:09 | |||
| 2020-21 | NHL | Minnesota Wild | 50 | 11 | 6 | 17 | +10 | 17 | 64 | 17.2 | 10:51 | 7 | 1 | 1 | 2 | +1 | 6 | 16.7 | 11:07 | |
| 2021-22 | NHL | Minnesota Wild | 53 | 9 | 8 | 17 | -5 | 8 | 73 | 12.3 | 11:33 | |||||||||
| 2021-22 | NHL | Colorado Avalanche | 21 | 0 | 3 | 3 | -2 | 6 | 28 | 0.0 | 12:48 | 13 | 2 | 2 | +2 | 2 | 9 | 0.0 | 8:27 | |
| 2022-23 | NHL | San Jose Sharks | 74 | 14 | 12 | 26 | -13 | 23 | 119 | 11.8 | 14:44 | |||||||||
| 2023-24 | NHL | San Jose Sharks | 63 | 5 | 8 | 13 | -25 | 12 | 69 | 7.2 | 14:40 | |||||||||
| 2024-25 | NHL | San Jose Sharks | 47 | 7 | 6 | 13 | -4 | 13 | 38 | 18.4 | 10:08 | |||||||||
| 2024-25 | NHL | Florida Panthers | 15 | 0 | 1 | 1 | -2 | 7 | 21 | 0.0 | 11:18 | 8 | -3 | 3 | 0.0 | 8:59 | ||||
| 2025-26 | OG | Germany | 5 | 1 | 0 | 1 | -1 | 3 | 33.0 | 10:21 | ||||||||||
| 2025-26 | NHL | Minnesota Wild | 49 | 5 | 6 | 11 | 16 | 37 | 13.5 | 10:57 | 8 | 1 | 4 | 5 | 10 | 10.0 | 10:25 | |||
| NHL Career | 380 | 51 | 52 | 103 | -39 | 102 | 458 | 11.1 | 12:25 | 38 | 3 | 7 | 10 | -1 | 2 | 29 | 10.3 | 9:36 | ||