
 Neal Pionk
| Position | Right Defense | Current Team | Winnipeg Jets |
| Shoots | Right | Current Contract | 6 years ($7.0M CapHit) |
| Height | 6'0" | Expires | 2030-31 |
| Weight (lbs) | 190 | Expiry Age (Jun 30) | 35 |
| Age (DOB) | 30 (July 29, 1995) | Expiry Status | UFA |
| Drafted | Undrafted |
| Date | Team | Transaction | |
|---|---|---|---|
| Mar 21, 2026 | Winnipeg Jets | Activated from IR | |
| Jan 14, 2026 | Winnipeg Jets | Placed on IR | |
| Apr 17, 2025 | Winnipeg Jets | Signed 6 years @ $7.000M AAV starting in 2025-26 | |
| Aug 11, 2021 | Winnipeg Jets | Signed 4 years @ $5.875M AAV starting in 2021-22 | |
| Jul 21, 2019 | Winnipeg Jets | Signed 2 years @ $3.000M AAV starting in 2019-20 | |
| May 1, 2017 | New York Rangers | Signed to an entry level contract. |
Player Card(s)
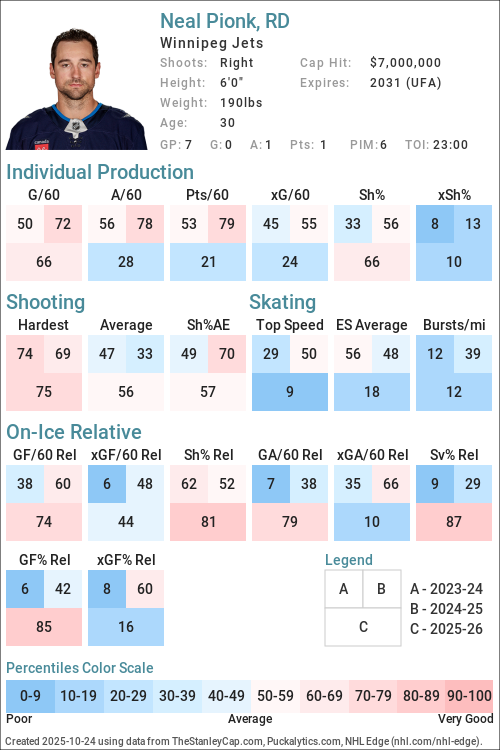
URL: https://thestanleycap.com/cdn/player_cards/20252026/neal-pionk-8480145.png
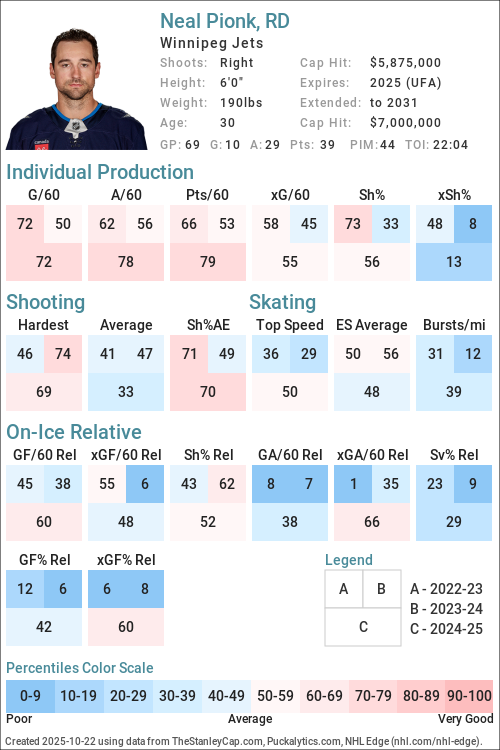
URL: https://thestanleycap.com/cdn/player_cards/20242025/neal-pionk-8480145.png
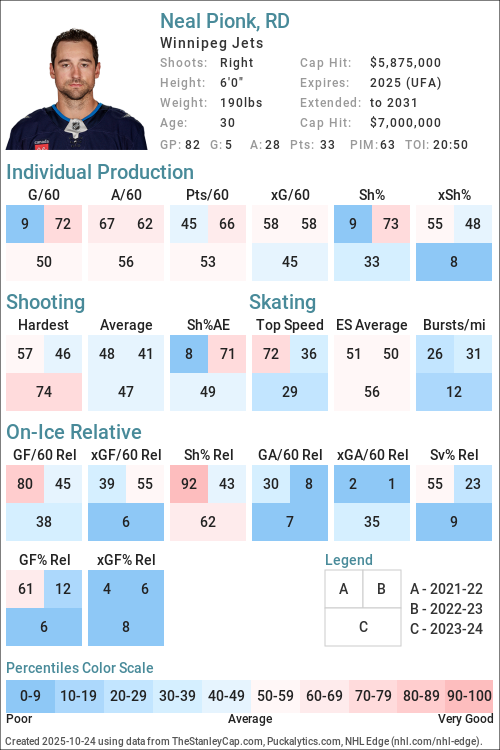
URL: https://thestanleycap.com/cdn/player_cards/20232024/neal-pionk-8480145.png
About Player Cards
Player cards present an infographic of a players performance using a series of Player Archetypes developed for Puckalytics.com and TheStanleyCap.com. The boxes in the rink image show the archetype ratings for the season specified in the card while the graphs to the right show the five-year trends for those archetypes.
Except for Faceoffs, the values shown are the players z-score (standard deviation from the mean) for the specific metric used to calculate the archetype values. When calculating z-scores forwards were compared to forwards and defensemen were compared to defensemen. Positive values indicate the player is above average and shaded in blue, while negative values indicate the player is below average and shaded in pink. The five year trend charts show a range of -4.0 to 4.0.
The value shown for Faceoffs is the faceoff winning percentage rather than their z-score with winning percentages below 50 in pink shades and above 50 in blue shades.
All archetypes are 5v5 except 5v4 TOI, 4v5 TOI, Skating (even strength) and Faceoffs (all situations). Archetypes use regular season data only.
Archetypes Summary
- Sniper - Measures the to score above the expected goal rate.
- Rebound - Measures the percent of a players shot attempts that come from rebounds (forwards only).
- 5v4 TOI - Powerplay ice time, calculated as the percentage of his teams 5v4 ice time that the player was on the ice for.
- Shooter - Measures whether a players points come from shots (goals or assists on rebounds from his shots).
- Producer - Measures a players ability to produce goals and assists, adjusted for quality of teammates.
- Playmaker - Measures whether a players points come from passes.
- Drive - Measures a players ability to drive puck possession and generate shot attempts for his team.
- Rush - Measures the percent of a players shot attempts that come from rush plays
- Possession - An indicator of a players ability to improve his teams puck possession game.
- Faceoffs - Faceoff Winning Percentage (min. 75 faceoffs taken).
- 5v5 TOI - The percentage of his teams 5v5 TOI that the player was on the ice for.
- Suppress - Measures a players ability to suppress opponent puck possession and shot attempts against.
- Skating - An indicator of a players skating ability, or speed bursts above 20mph per mile skated.
- Defend - An indicator of a players ability to suppress shot quality against.
- 4v5 TOI - Penalty Kill ice time, calculated as the percentage of his teams 4v5 ice time that the player was on the ice for.
Data Sources
- Salary data is from TheStanleyCap.com
- Skating data is from NHL Edge
- Other statistics are from Puckalytics.com and derived from data from NHL.com
Terms of Use
You are free to use include player cards in written articles, share on social media, or on other public websites under the following conditions:
- You credit TheStanleyCap.com as the source and provide a link back to TheStanleyCap.com or this player page.
- You do not mass copy/duplicate/publish dozens or hundreds of player cards. A few, or a handful for a written article is fine. Be reasonable. Fair use rules apply.
- If you are a high-traffic website you must download and host the image(s) on your site rather than overload TheStanleyCap servers with traffic.
Note: Player cards will update daily throughout the season so if you want to include snapshot then you must download the image.
If you have any questions, send an e-mail to the e-mail address at the top of this page.
Read Introducing Player Archetypes on HockeyAnalysis.com for more details on archetype calculations.
Core Archetypes
| Season | Team(s) | GP | TOI | Producer | Playmaker | Shooter | Sniper | Rebound | Rush | Skating | Defend |
|---|---|---|---|---|---|---|---|---|---|---|---|
| 2017-18 | NYR | 28 | 0.88 | 1.51 | -0.56 | -0.79 | - | 2.70 | - | 2.40 | |
| 2018-19 | NYR | 73 | -1.03 | -1.23 | -0.40 | -0.64 | - | 0.19 | - | -0.55 | |
| 2019-20 | WPG | 71 | -0.30 | -0.49 | -0.17 | -0.49 | - | -0.34 | - | -0.05 | |
| 2020-21 | WPG | 54 | 0.31 | 1.13 | -0.73 | -0.73 | - | -0.81 | - | -0.21 | |
| 2021-22 | WPG | 77 | -0.35 | 0.45 | -0.91 | -1.25 | - | -0.38 | -0.75 | 0.30 | |
| 2022-23 | WPG | 82 | 0.43 | -0.08 | 0.75 | 0.64 | - | 0.20 | -0.63 | -0.65 | |
| 2023-24 | WPG | 82 | -0.14 | -0.27 | -0.15 | -0.24 | - | 0.68 | -1.06 | -1.32 | |
| 2024-25 | WPG | 69 | 0.71 | 0.67 | 0.18 | 0.61 | - | -0.68 | -0.41 | -0.58 | |
| 2025-26 | WPG | 51 | -1.04 | -0.97 | -0.69 | -0.13 | - | -0.70 | -0.82 | 2.39 |
Situational and Secondary Archetypes
| Season | Team(s) | GP | TOI | 5v5 TOI | 5v4 TOI | 4v5 TOI | Possession | Drive | Suppress | Faceoffs |
|---|---|---|---|---|---|---|---|---|---|---|
| 2017-18 | NYR | 28 | 0.85 | -0.23 | 0.93 | -1.91 | -2.43 | -0.23 | - | |
| 2018-19 | NYR | 73 | -0.19 | -0.10 | 0.88 | -0.82 | -0.48 | -0.75 | - | |
| 2019-20 | WPG | 71 | 0.92 | 1.26 | -0.89 | 1.05 | 0.93 | 0.61 | - | |
| 2020-21 | WPG | 54 | 0.91 | 0.35 | -1.27 | 1.53 | 0.38 | 1.62 | - | |
| 2021-22 | WPG | 77 | 0.37 | 0.56 | -0.83 | -1.38 | -0.48 | -1.85 | - | |
| 2022-23 | WPG | 82 | 0.74 | 0.16 | -0.08 | -0.86 | 0.07 | -1.51 | - | |
| 2023-24 | WPG | 82 | 0.13 | 0.09 | -0.12 | -1.07 | -0.94 | -0.60 | - | |
| 2024-25 | WPG | 69 | 0.57 | 0.00 | 0.31 | 0.55 | 0.35 | 0.48 | - | |
| 2025-26 | WPG | 51 | 0.59 | 0.02 | 1.06 | -0.24 | 0.52 | -1.13 | - |
5v5 Individual Stats
| Season | Team(s) | GP | TOI | G/60 | A/60 | Pts/60 | xG/60 | GAE/60 | Sh% | xSh% | Sh%AE | %SA Rush | %SA Reb. |
|---|---|---|---|---|---|---|---|---|---|---|---|---|---|
| 2017-18 | NYR | 28 | 504:55 | 0.12 | 0.83 | 0.95 | 0.19 | -0.08 | 2.70 | 4.42 | -1.72 | 4.26 | 2.13 |
| 2018-19 | NYR | 73 | 1152:46 | 0.10 | 0.36 | 0.47 | 0.19 | -0.09 | 1.92 | 3.56 | -1.63 | 1.35 | 1.35 |
| 2019-20 | WPG | 71 | 1281:54 | 0.14 | 0.56 | 0.70 | 0.20 | -0.06 | 2.59 | 3.73 | -1.14 | 0.60 | 4.82 |
| 2020-21 | WPG | 54 | 969:36 | 0.06 | 0.87 | 0.93 | 0.15 | -0.09 | 1.28 | 3.17 | -1.89 | 0.00 | 0.00 |
| 2021-22 | WPG | 77 | 1311:44 | 0.05 | 0.78 | 0.82 | 0.20 | -0.16 | 0.98 | 4.32 | -3.34 | 0.65 | 0.65 |
| 2022-23 | WPG | 82 | 1404:39 | 0.26 | 0.73 | 0.98 | 0.19 | 0.06 | 5.56 | 4.20 | 1.36 | 1.21 | 3.03 |
| 2023-24 | WPG | 82 | 1358:15 | 0.18 | 0.71 | 0.88 | 0.19 | -0.01 | 3.48 | 3.71 | -0.24 | 1.76 | 1.76 |
| 2024-25 | WPG | 69 | 1233:07 | 0.24 | 0.83 | 1.07 | 0.17 | 0.07 | 4.76 | 3.41 | 1.35 | 0.00 | 1.74 |
| 2025-26 | WPG | 51 | 881:35 | 0.14 | 0.41 | 0.54 | 0.14 | -0.00 | 3.03 | 3.14 | -0.11 | 0.00 | 2.04 |
5v5 On Ice Stats
| Season | Team(s) | GP | TOI | SAF/60 | GF/60 | xGF/60 | SAA/60 | GA/60 | xGA/60 | GF% | xGF% | xGF Rel | xGA Rel | xGF% Rel |
|---|---|---|---|---|---|---|---|---|---|---|---|---|---|---|
| 2017-18 | NYR | 28 | 504:55 | 35.65 | 2.14 | 1.96 | 50.15 | 2.14 | 2.81 | 50.00 | 41.11 | -0.65 | -0.04 | -6.67 |
| 2018-19 | NYR | 73 | 1152:46 | 37.58 | 1.87 | 2.26 | 46.74 | 2.97 | 2.75 | 38.71 | 45.18 | -0.23 | 0.08 | -3.17 |
| 2019-20 | WPG | 71 | 1281:54 | 42.36 | 2.06 | 2.28 | 43.15 | 2.34 | 2.68 | 46.81 | 46.04 | 0.24 | -0.08 | 3.48 |
| 2020-21 | WPG | 54 | 969:36 | 38.37 | 2.48 | 2.21 | 36.94 | 1.92 | 2.49 | 56.34 | 47.02 | 0.10 | -0.12 | 2.29 |
| 2021-22 | WPG | 77 | 1311:44 | 41.44 | 2.65 | 2.62 | 47.11 | 2.61 | 2.96 | 50.43 | 46.94 | -0.07 | 0.46 | -4.93 |
| 2022-23 | WPG | 82 | 1404:39 | 43.14 | 2.39 | 2.73 | 43.87 | 2.65 | 2.85 | 47.46 | 48.96 | 0.02 | 0.52 | -4.89 |
| 2023-24 | WPG | 82 | 1358:15 | 40.95 | 2.56 | 2.29 | 42.50 | 2.30 | 2.43 | 52.73 | 48.60 | -0.26 | 0.19 | -4.70 |
| 2024-25 | WPG | 69 | 1233:07 | 42.72 | 2.58 | 2.35 | 39.80 | 1.80 | 2.22 | 58.89 | 51.39 | -0.11 | -0.06 | -0.49 |
| 2025-26 | WPG | 51 | 881:35 | 39.81 | 2.25 | 2.17 | 41.99 | 1.97 | 2.75 | 53.23 | 44.10 | -0.17 | 0.22 | -3.94 |
NHL Edge Stats
| Skating | Shooting | Zone Time | |||||||||||
|---|---|---|---|---|---|---|---|---|---|---|---|---|---|
| Season | GP | Top Speed | Bursts>20/mi | Avg. Speed | Top Speed | Avg. Speed | %Long Range | %Mid Range | %High Danger | ES DZ% | ES NZ% | ES OZ% | |
| This table is for Basic and Premium subscribers only. To view please login to and/or subscribe to one of our subscription plans. | |||||||||||||
Legend
| Percentile 0-25 | Percentile 25-50 | Percentile 50-75 | Percentile 75-100 |
5v5 Defense Pairs
| Season | Teammate | Team | TOI | GF/60 | GA/60 | GF% | xGF/60 | xGA/60 | xGF% | xGF Rel | xGA Rel | xGF% Rel |
|---|
Glossary
| Type | Statistic | Definition |
|---|---|---|
| Individual | G/60 | Goals Against per 60 minutes. |
| Individual | A/60 | Assists per 60 minutes. |
| Individual | Pts/60 | Points per 60 minutes. |
| Individual | xG/60 | Expected Goals per 60 minutes. |
| Individual | GAE/60 | Goals Above Expected (G/60 - xG/60). |
| Individual | Sh% | Shooting Percentage. |
| Individual | xSh% | Expected Shooting Percentage. |
| Individual | Sh%AE | Shooting percentage above expected (Sh% - xSh%). |
| Individual | %SA Rush | Percentage of shot attempts determined to be on the rush. |
| Individual | %SA Reb. | Percentage of shot attempts determined to be from rebounds. |
| On Ice | SAF/60 | Shot Attempts For per 60 minutes. |
| On Ice | GF/60 | Goals For per 60 minutes. |
| On Ice | xGF/60 | Expected Goals For per 60 minutes. |
| On Ice | SAA/60 | Shot Attempts Against per 60 minutes (lower is better). |
| On Ice | GA/60 | Goals Against per 60 minutes (lower is better). |
| On Ice | xGA/60 | Expected Goals Against per 60 minutes (lower is better). |
| On Ice | GF% | Goals For Percentage = Goals For / (Goals For + Goals Against) |
| On Ice | xGF% | Expected Goals For Percentage = Expected Goals For / (Expected Goals For + Expected Goals Against) |
| On Ice | xGF Rel | xGF/60 when On Ice - xGF/60 when not On Ice. |
| On Ice | xGA Rel | xGA/60 when On Ice - xGA/60 when not On Ice (lower is better). |
| On Ice | xGF% Rel | xGF% when On Ice - xGF% when not On Ice. |
News and Opinions
-
Anchored by puck-moving blueliners and steady veterans: the rest of the defencemen Jets Nation year in review at Jets Nation (Thu Jul 16, 2026)
-
Jets Week Ahead: Schedule & Storylines – Tough Decisions, Pionk Returns, Scheifele’s 100 and More at The Hockey Writers (Sun Mar 22, 2026)
-
Neal Pionk takes next step at Winnipeg Jets morning skate, weekend return possible at Illegal Curve Hockey (Thu Mar 19, 2026)
-
Winnipeg Jets coach Scott Arniel says Neal Pionk close to return, will join road trip, provides other injury updates at Illegal Curve Hockey (Tue Mar 17, 2026)
-
Jets Niederreiter & Pionk Out Week-to-Week With Injuries at The Hockey Writers (Tue Feb 24, 2026)
-
Winnipeg Jets head coach Scott Arniel indicates Nino Niederreiter and Neal Pionk are week-to-week at Illegal Curve Hockey (Tue Feb 24, 2026)
-
Winnipeg Jets head coach Scott Arniel declares Neal Pionk ready to go for Vancouver at Illegal Curve Hockey (Sat Feb 21, 2026)
-
Latest from Winnipeg Jets head coach on Colin Miller, Haydn Fleury and Neal Pionk at Illegal Curve Hockey (Wed Feb 18, 2026)
-
Progress report from Winnipeg Jets head coach Scott Arniel on Pionk, Miller and Fleury at Illegal Curve Hockey (Wed Feb 4, 2026)
-
Pionk, Fleury, Miller week-to-week as Jets recall Salomonsson from Moose at Jets Nation (Wed Jan 14, 2026)
-
Neal Pionk not quite ready to return as Winnipeg Jets prepare for Sabres at Illegal Curve Hockey (Mon Dec 1, 2025)
-
Latest on Neal Pionk and Haydn Fleury from Winnipeg Jets head coach Scott Arniel at Illegal Curve Hockey (Wed Nov 26, 2025)
-
Pionk day-to-day, Jets recall Salomonsson from Moose at Jets Nation (Tue Nov 25, 2025)
-
Winnipeg Jets avoid significant injury to Neal Pionk who is listed as day-to-day at Illegal Curve Hockey (Tue Nov 25, 2025)
-
Jets’ Pionk Day to Day With Lower-Body Injury at The Hockey Writers (Tue Nov 25, 2025)
-
Jets' Neal Pionk Suffers Second Lower-Body Injury in 8 Months, Listed As Day-to-Day at Yahoo Sports NHL (Mon Nov 24, 2025)
-
Kyle Connor’s OT winner propels the Jets to a much needed 4-3 win in OT over the Wild at Jets Nation (Wed Oct 29, 2025)
-
USA Hockey invites Jets’ Kyle Connor, Connor Hellebuyck, and Neal Pionk to 2026 Olympic orientation camp at Jets Nation (Tue Aug 19, 2025)
-
Goals and expectations for the newly re-signed $42 million defenceman Neal Pionk at Jets Nation (Fri Aug 15, 2025)
-
Top 3 most concerning things about the Winnipeg Jets’ October at Jets White Out (Tue Oct 31, 2023)
-
3 ways the Winnipeg Jets can effectively retool as opposed to rebuild at Jets White Out (Thu Jun 8, 2023)
Current Contract
Neal Pionk signed a $42,000,000 6-year contract with the Winnipeg Jets and General Manager Kevin Cheveldayoff on April 17, 2025 with an AAV of $7,000,000. This contract will start in 2025-26 and end after the 2030-31 season. In the first season of the contract the cap hit was equivalent to 7.33% of the salary cap.
Standard Contract (UFA) ( ) (0 ratings)
Neal Pionk signed a $23,500,000 4-year contract with the Winnipeg Jets and General Manager Kevin Cheveldayoff on August 11, 2021 with an AAV of $5,875,000. This contract will start in 2021-22 and end after the 2024-25 season. In the first season of the contract the cap hit was equivalent to 7.21% of the salary cap.
Standard Contract (RFA) ( ) (0 ratings)
| Season | Age* | Clause | Cap Hit | AAV | Perf. Bonus | Sign. Bonus | Salary | Compensation | Minors Salary | Status | |
|---|---|---|---|---|---|---|---|---|---|---|---|
| 2021-22 | 26 | $5,875,000 | $5,875,000 | - | - | $3,500,000 | $3,500,000 | $3,500,000 | RFA-arb | ||
| 2022-23 | 27 | $5,875,000 | $5,875,000 | - | - | $6,500,000 | $6,500,000 | $6,500,000 | RFA-arb | ||
| 2023-24 | 28 | $5,875,000 | $5,875,000 | - | - | $7,500,000 | $7,500,000 | $7,500,000 | UFA | ||
| 2024-25 | 29 | $5,875,000 | $5,875,000 | - | - | $6,000,000 | $6,000,000 | $6,000,000 | UFA | ||
| Total | - | - | $23,500,000 | $23,500,000 | $23,500,000 |
Neal Pionk signed a $6,000,000 2-year contract with the Winnipeg Jets and General Manager Kevin Cheveldayoff on July 21, 2019 with an AAV of $3,000,000. This contract will start in 2019-20 and end after the 2020-21 season. In the first season of the contract the cap hit was equivalent to 3.68% of the salary cap.
Standard Contract (RFA) ( ) (0 ratings)
| Season | Age* | Clause | Cap Hit | AAV | Perf. Bonus | Sign. Bonus | Salary | Compensation | Minors Salary | Status | |
|---|---|---|---|---|---|---|---|---|---|---|---|
| 2019-20 | 24 | $3,000,000 | $3,000,000 | - | - | $2,850,000 | $2,850,000 | $2,850,000 | RFA-arb | ||
| 2020-21 | 25 | $3,000,000 | $3,000,000 | - | - | $3,150,000 | $3,150,000 | $3,150,000 | RFA-arb | ||
| Total | - | - | $6,000,000 | $6,000,000 | $6,000,000 |
Neal Pionk signed a $1,850,000 2-year contract with the New York Rangers and General Manager Jeff Gorton on May 1, 2017 with an AAV of $925,000. This contract will start in 2017-18 and end after the 2018-19 season. In the first season of the contract the cap hit was equivalent to 1.23% of the salary cap.
Entry Level Contract ( ) (0 ratings)
| Season | Age* | Clause | Cap Hit | AAV | Perf. Bonus | Sign. Bonus | Salary | Compensation | Minors Salary | Status | |
|---|---|---|---|---|---|---|---|---|---|---|---|
| 2017-18 | 22 | $925,000 | $1,775,000 | $850,000 | $92,500 | $832,500 | $925,000 | $70,000 | ELC | ||
| 2018-19 | 23 | $925,000 | $1,775,000 | $850,000 | $92,500 | $832,500 | $925,000 | $70,000 | ELC | ||
| Total | $1,700,000 | $185,000 | $1,665,000 | $1,850,000 | $140,000 |
Career Statistics
| Regular Season | Playoffs | |||||||||||||||||||
|---|---|---|---|---|---|---|---|---|---|---|---|---|---|---|---|---|---|---|---|---|
| Season | League | Team | GP | G | A | Pts | +/- | PIM | Shots | Sh% | TOI/G | GP | G | A | Pts | +/- | PIM | Shots | Sh% | TOI/G |
| 2011-12 | USHS-MN | Hermantown High | 25 | 7 | 6 | 13 | 12 | 3 | 3 | 3 | 2 | |||||||||
| 2012-13 | USHL | Sioux City Musketeers | 12 | 1 | 5 | 6 | +3 | 2 | ||||||||||||
| 2012-13 | MNHP-17 | B17 - Red (Final 54) | 3 | 1 | 2 | 3 | ||||||||||||||
| 2012-13 | USHS-MN | Hermantown High | 25 | 14 | 15 | 29 | 25 | 3 | 2 | 3 | 5 | +2 | 2 | |||||||
| 2012-13 | UMHSEHL | Team North | 20 | 1 | 10 | 11 | 32 | 3 | 1 | 1 | ||||||||||
| 2013-14 | USHL | Sioux City Musketeers | 54 | 2 | 21 | 23 | +18 | 93 | 7 | 1 | 1 | 10 | ||||||||
| 2013-14 | WJAC-19 | USA U19 | 4 | 2 | 2 | 8 | ||||||||||||||
| 2014-15 | USHL | Sioux City Musketeers | 53 | 7 | 41 | 48 | +23 | 104 | 5 | 1 | 1 | -4 | 10 | |||||||
| 2015-16 | NCAA | Univ. of Minnesota-Duluth | 40 | 4 | 13 | 17 | +11 | 44 | ||||||||||||
| 2016-17 | NCAA | Univ. of Minnesota-Duluth | 42 | 7 | 27 | 34 | +24 | 25 | ||||||||||||
| 2017-18 | AHL | Hartford Wolf Pack | 48 | 1 | 16 | 17 | -9 | 20 | ||||||||||||
| 2017-18 | NHL | New York Rangers | 28 | 1 | 13 | 14 | -1 | 12 | 54 | 1.8 | 22:23 | |||||||||
| 2017-18 | WC | USA | 10 | 2 | 1 | 3 | +7 | 4 | ||||||||||||
| 2018-19 | NHL | New York Rangers | 73 | 6 | 20 | 26 | -16 | 35 | 132 | 4.6 | 21:10 | |||||||||
| 2019-20 | NHL | Winnipeg Jets | 71 | 6 | 39 | 45 | +10 | 32 | 177 | 3.4 | 23:23 | 4 | 2 | 2 | -6 | 10 | 0.0 | 23:04 | ||
| 2020-21 | NHL | Winnipeg Jets | 54 | 3 | 29 | 32 | +6 | 20 | 100 | 3.0 | 21:58 | 8 | 4 | 4 | -2 | 2 | 17 | 0.0 | 26:00 | |
| 2021-22 | NHL | Winnipeg Jets | 77 | 3 | 31 | 34 | +5 | 46 | 140 | 2.1 | 21:08 | |||||||||
| 2022-23 | NHL | Winnipeg Jets | 82 | 10 | 23 | 33 | -12 | 44 | 142 | 7.0 | 21:56 | 5 | 7 | 7 | -6 | 9 | 0.0 | 27:18 | ||
| 2023-24 | NHL | Winnipeg Jets | 82 | 5 | 28 | 33 | +9 | 63 | 146 | 3.4 | 20:50 | 5 | 1 | 1 | -2 | 4 | 5 | 0.0 | 21:57 | |
| 2024-25 | NHL | Winnipeg Jets | 69 | 10 | 29 | 39 | +21 | 44 | 123 | 8.1 | 22:04 | 13 | 1 | 6 | 7 | +1 | 14 | 23 | 4.3 | 24:25 |
| 2025-26 | NHL | Winnipeg Jets | 51 | 3 | 9 | 12 | +1 | 37 | 97 | 3.1 | 22:43 | |||||||||
| NHL Career | 587 | 47 | 221 | 268 | +23 | 333 | 1111 | 4.2 | 21:52 | 35 | 1 | 20 | 21 | -15 | 20 | 64 | 1.6 | 24:41 | ||