
Mike Reilly
| Position | Left Defense | Current Team | |
| Shoots | Left | Current Contract | |
| Height | 6'2" | Expires | |
| Weight (lbs) | 191 | Expiry Age (Jun 30) | |
| Age (DOB) | 33 (July 13, 1993) | Expiry Status | |
| Drafted | 2011, Round 4, Overall 98 (CBJ) |
| Date | Team | Transaction | |
|---|---|---|---|
| Jul 1, 2025 | Carolina Hurricanes | Signed 1 year @ $1.100M AAV starting in 2025-26 | |
| Mar 16, 2025 | New York Islanders | Activated from LTIR | |
| Jan 7, 2025 | New York Islanders | Placed on LTIR | |
| Nov 14, 2024 | New York Islanders | Placed on IR | |
| Jul 1, 2024 | New York Islanders | Signed 1 year @ $1.250M AAV starting in 2024-25 | |
| Jul 1, 2023 | Florida Panthers | Signed 1 year @ $1.000M AAV starting in 2023-24 | |
| Jun 30, 2023 | Boston Bruins | Contract bought out | |
| Jul 27, 2021 | Boston Bruins | Signed 3 years @ $3.000M AAV starting in 2021-22 | |
| Jun 26, 2019 | Montreal Canadiens | Signed 2 years @ $1.500M AAV starting in 2019-20 | |
| Jul 2, 2017 | Minnesota Wild | Signed 2 years @ $725K AAV starting in 2017-18 | |
| Jun 1, 2015 | Minnesota Wild | Signed to an entry level contract. |
Player Card(s)

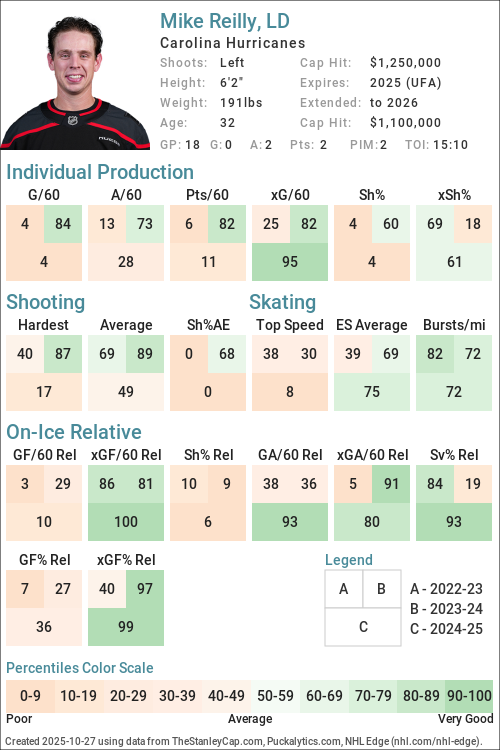
URL: https://thestanleycap.com/cdn/player_cards/20252026/mike-reilly-8476422.png
URL: https://thestanleycap.com/cdn/player_cards/20242025/mike-reilly-8476422.png
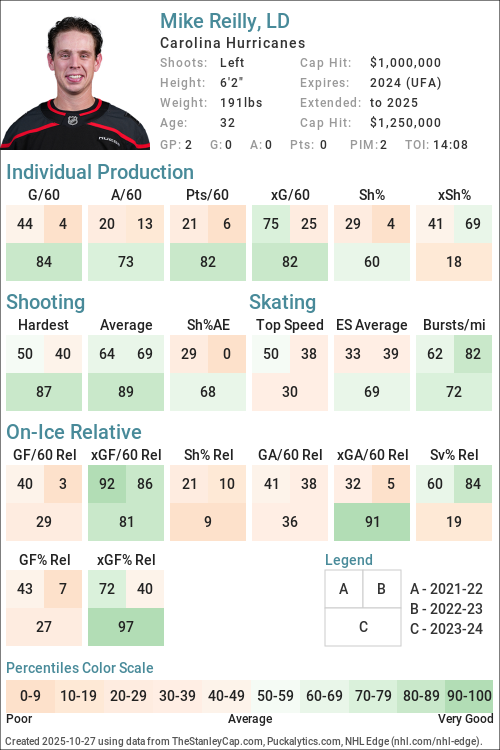
URL: https://thestanleycap.com/cdn/player_cards/20232024/mike-reilly-8476422.png
About Player Cards
Player cards present an infographic of a players performance using a series of Player Archetypes developed for Puckalytics.com and TheStanleyCap.com. The boxes in the rink image show the archetype ratings for the season specified in the card while the graphs to the right show the five-year trends for those archetypes.
Except for Faceoffs, the values shown are the players z-score (standard deviation from the mean) for the specific metric used to calculate the archetype values. When calculating z-scores forwards were compared to forwards and defensemen were compared to defensemen. Positive values indicate the player is above average and shaded in blue, while negative values indicate the player is below average and shaded in pink. The five year trend charts show a range of -4.0 to 4.0.
The value shown for Faceoffs is the faceoff winning percentage rather than their z-score with winning percentages below 50 in pink shades and above 50 in blue shades.
All archetypes are 5v5 except 5v4 TOI, 4v5 TOI, Skating (even strength) and Faceoffs (all situations). Archetypes use regular season data only.
Archetypes Summary
- Sniper - Measures the to score above the expected goal rate.
- Rebound - Measures the percent of a players shot attempts that come from rebounds (forwards only).
- 5v4 TOI - Powerplay ice time, calculated as the percentage of his teams 5v4 ice time that the player was on the ice for.
- Shooter - Measures whether a players points come from shots (goals or assists on rebounds from his shots).
- Producer - Measures a players ability to produce goals and assists, adjusted for quality of teammates.
- Playmaker - Measures whether a players points come from passes.
- Drive - Measures a players ability to drive puck possession and generate shot attempts for his team.
- Rush - Measures the percent of a players shot attempts that come from rush plays
- Possession - An indicator of a players ability to improve his teams puck possession game.
- Faceoffs - Faceoff Winning Percentage (min. 75 faceoffs taken).
- 5v5 TOI - The percentage of his teams 5v5 TOI that the player was on the ice for.
- Suppress - Measures a players ability to suppress opponent puck possession and shot attempts against.
- Skating - An indicator of a players skating ability, or speed bursts above 20mph per mile skated.
- Defend - An indicator of a players ability to suppress shot quality against.
- 4v5 TOI - Penalty Kill ice time, calculated as the percentage of his teams 4v5 ice time that the player was on the ice for.
Data Sources
- Salary data is from TheStanleyCap.com
- Skating data is from NHL Edge
- Other statistics are from Puckalytics.com and derived from data from NHL.com
Terms of Use
You are free to use include player cards in written articles, share on social media, or on other public websites under the following conditions:
- You credit TheStanleyCap.com as the source and provide a link back to TheStanleyCap.com or this player page.
- You do not mass copy/duplicate/publish dozens or hundreds of player cards. A few, or a handful for a written article is fine. Be reasonable. Fair use rules apply.
- If you are a high-traffic website you must download and host the image(s) on your site rather than overload TheStanleyCap servers with traffic.
Note: Player cards will update daily throughout the season so if you want to include snapshot then you must download the image.
If you have any questions, send an e-mail to the e-mail address at the top of this page.
Read Introducing Player Archetypes on HockeyAnalysis.com for more details on archetype calculations.
Core Archetypes
| Season | Team(s) | GP | TOI | Producer | Playmaker | Shooter | Sniper | Rebound | Rush | Skating | Defend |
|---|---|---|---|---|---|---|---|---|---|---|---|
| 2015-16 | MIN | 29 | 2.40 | 3.50 | 0.01 | 0.92 | - | -0.89 | - | -2.05 | |
| 2016-17 | MIN | 17 | -1.36 | -1.51 | 0.38 | 1.42 | - | -0.96 | - | -2.47 | |
| 2017-18 | MIN, MTL | 57 | 1.03 | 1.20 | -0.15 | 0.19 | - | 0.37 | - | -0.64 | |
| 2018-19 | MTL | 57 | -0.82 | -0.61 | -0.72 | -0.90 | - | 0.41 | - | 0.61 | |
| 2019-20 | MTL, OTT | 44 | -0.95 | -0.72 | -0.85 | -1.53 | - | -0.88 | - | -0.54 | |
| 2020-21 | BOS, OTT | 55 | 2.15 | 3.76 | -0.83 | -1.00 | - | -0.06 | - | -0.49 | |
| 2021-22 | BOS | 70 | -0.89 | -0.91 | -0.53 | -0.55 | - | 1.06 | 0.05 | 0.36 | |
| 2022-23 | BOS | 10 | -1.25 | -0.90 | -0.95 | -1.77 | - | 11.96 | 0.76 | 0.99 | |
| 2023-24 | FLA, NYI | 61 | 1.01 | -0.01 | 1.83 | 0.41 | - | 0.28 | 0.42 | -0.85 | |
| 2024-25 | NYI | 18 | -0.82 | 0.02 | -0.94 | -1.90 | - | -0.68 | 0.33 | 1.51 | |
| 2025-26 | CAR | 42 | -0.32 | 0.54 | -0.95 | -1.17 | - | -0.70 | -0.27 | 2.66 |
Situational and Secondary Archetypes
| Season | Team(s) | GP | TOI | 5v5 TOI | 5v4 TOI | 4v5 TOI | Possession | Drive | Suppress | Faceoffs |
|---|---|---|---|---|---|---|---|---|---|---|
| 2015-16 | MIN | 29 | -3.41 | -0.03 | -2.47 | -0.68 | 0.81 | -1.86 | - | |
| 2016-17 | MIN | 17 | -3.28 | -0.29 | -2.28 | 1.02 | 1.12 | 0.55 | - | |
| 2017-18 | MIN, MTL | 57 | -1.71 | -0.01 | -2.21 | -1.06 | -0.48 | -1.22 | - | |
| 2018-19 | MTL | 57 | 0.05 | -0.45 | -1.67 | -0.16 | 0.29 | -0.54 | - | |
| 2019-20 | MTL, OTT | 44 | -0.59 | -0.10 | -1.87 | 1.12 | 2.03 | -0.32 | - | |
| 2020-21 | BOS, OTT | 55 | -0.18 | -0.54 | -0.36 | 1.94 | 1.59 | 1.23 | - | |
| 2021-22 | BOS | 70 | 0.28 | -0.84 | -1.31 | 0.63 | 1.61 | -0.54 | - | |
| 2022-23 | BOS | 10 | -0.25 | -0.61 | -1.92 | -1.50 | -0.12 | -2.22 | - | |
| 2023-24 | FLA, NYI | 61 | -0.91 | 0.16 | -2.09 | 1.65 | 1.49 | 0.87 | - | |
| 2024-25 | NYI | 18 | -1.98 | -0.04 | -1.91 | 1.39 | 2.00 | 0.28 | - | |
| 2025-26 | CAR | 42 | -1.59 | -1.39 | -0.97 | -0.10 | -0.30 | 0.09 | - |
5v5 Individual Stats
| Season | Team(s) | GP | TOI | G/60 | A/60 | Pts/60 | xG/60 | GAE/60 | Sh% | xSh% | Sh%AE | %SA Rush | %SA Reb. |
|---|---|---|---|---|---|---|---|---|---|---|---|---|---|
| 2015-16 | MIN | 29 | 274:11 | 0.22 | 0.88 | 1.09 | 0.15 | 0.07 | 6.67 | 4.61 | 2.06 | 0.00 | 0.00 |
| 2016-17 | MIN | 17 | 172:06 | 0.35 | 0.00 | 0.35 | 0.17 | 0.18 | 5.88 | 2.79 | 3.09 | 0.00 | 4.17 |
| 2017-18 | MIN | 38 | 392:24 | 0.31 | 0.61 | 0.92 | 0.17 | 0.13 | 7.41 | 4.21 | 3.20 | 0.00 | 5.26 |
| 2017-18 | MTL | 19 | 324:05 | 0.00 | 1.11 | 1.11 | 0.10 | -0.10 | 0.00 | 2.90 | -2.90 | 4.17 | 4.17 |
| 2017-18 | MIN, MTL | 57 | 716:29 | 0.17 | 0.84 | 1.00 | 0.14 | 0.03 | 4.44 | 3.69 | 0.76 | 1.61 | 4.84 |
| 2018-19 | MTL | 57 | 910:22 | 0.13 | 0.53 | 0.66 | 0.26 | -0.13 | 2.30 | 4.50 | -2.20 | 1.60 | 4.00 |
| 2019-20 | OTT | 30 | 482:22 | 0.00 | 0.25 | 0.25 | 0.18 | -0.18 | 0.00 | 3.36 | -3.36 | 0.00 | 0.00 |
| 2019-20 | MTL | 14 | 175:29 | 0.00 | 1.37 | 1.37 | 0.24 | -0.24 | 0.00 | 3.88 | -3.88 | 0.00 | 4.00 |
| 2019-20 | MTL, OTT | 44 | 657:51 | 0.00 | 0.55 | 0.55 | 0.20 | -0.20 | 0.00 | 3.51 | -3.51 | 0.00 | 1.05 |
| 2020-21 | OTT | 40 | 597:24 | 0.00 | 1.31 | 1.31 | 0.15 | -0.15 | 0.00 | 2.57 | -2.57 | 1.23 | 0.00 |
| 2020-21 | BOS | 15 | 247:39 | 0.00 | 1.70 | 1.70 | 0.14 | -0.14 | 0.00 | 2.55 | -2.55 | 0.00 | 0.00 |
| 2020-21 | BOS, OTT | 55 | 845:03 | 0.00 | 1.42 | 1.42 | 0.15 | -0.15 | 0.00 | 2.56 | -2.56 | 0.90 | 0.00 |
| 2021-22 | BOS | 70 | 1147:10 | 0.16 | 0.47 | 0.63 | 0.25 | -0.09 | 2.68 | 4.26 | -1.58 | 2.01 | 4.70 |
| 2022-23 | BOS | 10 | 148:51 | 0.00 | 0.40 | 0.40 | 0.15 | -0.15 | 0.00 | 4.54 | -4.54 | 14.29 | 0.00 |
| 2023-24 | FLA | 2 | 23:37 | 0.00 | 0.00 | 0.00 | 0.67 | -0.67 | 0.00 | 5.31 | -5.31 | 16.67 | 0.00 |
| 2023-24 | NYI | 59 | 877:55 | 0.34 | 0.82 | 1.16 | 0.23 | 0.11 | 5.26 | 3.50 | 1.76 | 0.71 | 2.14 |
| 2023-24 | FLA, NYI | 61 | 901:32 | 0.33 | 0.80 | 1.13 | 0.24 | 0.09 | 5.00 | 3.59 | 1.41 | 1.37 | 2.05 |
| 2024-25 | NYI | 18 | 237:41 | 0.00 | 0.50 | 0.50 | 0.28 | -0.28 | 0.00 | 4.42 | -4.42 | 0.00 | 4.65 |
| 2025-26 | CAR | 42 | 563:20 | 0.00 | 0.85 | 0.85 | 0.19 | -0.19 | 0.00 | 3.25 | -3.25 | 0.00 | 2.44 |
5v5 On Ice Stats
| Season | Team(s) | GP | TOI | SAF/60 | GF/60 | xGF/60 | SAA/60 | GA/60 | xGA/60 | GF% | xGF% | xGF Rel | xGA Rel | xGF% Rel |
|---|---|---|---|---|---|---|---|---|---|---|---|---|---|---|
| 2015-16 | MIN | 29 | 274:11 | 39.61 | 1.97 | 2.12 | 44.86 | 2.84 | 2.32 | 40.91 | 47.79 | 0.15 | 0.49 | -4.15 |
| 2016-17 | MIN | 17 | 172:06 | 48.11 | 3.14 | 2.45 | 43.58 | 2.79 | 1.95 | 52.94 | 55.64 | -0.04 | -0.11 | 0.93 |
| 2017-18 | MIN | 38 | 392:24 | 34.25 | 1.83 | 1.79 | 46.94 | 2.45 | 2.33 | 42.86 | 43.41 | -0.54 | 0.19 | -8.67 |
| 2017-18 | MTL | 19 | 324:05 | 40.73 | 2.78 | 2.42 | 47.02 | 2.59 | 2.66 | 51.72 | 47.68 | 0.47 | 0.34 | 1.89 |
| 2017-18 | MIN, MTL | 57 | 716:29 | 37.18 | 2.26 | 2.07 | 46.98 | 2.51 | 2.48 | 47.37 | 45.57 | -0.14 | 0.29 | -4.73 |
| 2018-19 | MTL | 57 | 910:22 | 46.79 | 2.83 | 2.62 | 41.72 | 2.44 | 2.48 | 53.75 | 51.41 | 0.03 | 0.23 | -2.10 |
| 2019-20 | OTT | 30 | 482:22 | 51.50 | 1.99 | 2.87 | 47.52 | 2.86 | 2.70 | 41.03 | 51.49 | 0.64 | 0.10 | 5.37 |
| 2019-20 | MTL | 14 | 175:29 | 45.13 | 4.10 | 2.87 | 41.71 | 3.76 | 2.53 | 52.17 | 53.15 | 0.29 | -0.28 | 5.30 |
| 2019-20 | MTL, OTT | 44 | 657:51 | 49.80 | 2.55 | 2.87 | 45.97 | 3.10 | 2.66 | 45.16 | 51.92 | 0.52 | -0.02 | 5.17 |
| 2020-21 | OTT | 40 | 597:24 | 47.51 | 2.91 | 2.61 | 41.78 | 3.11 | 2.44 | 48.33 | 51.72 | 0.32 | -0.38 | 6.92 |
| 2020-21 | BOS | 15 | 247:39 | 51.61 | 3.15 | 2.56 | 32.47 | 1.94 | 1.74 | 61.90 | 59.57 | -0.35 | -0.01 | -2.95 |
| 2020-21 | BOS, OTT | 55 | 845:03 | 48.71 | 2.98 | 2.60 | 39.05 | 2.77 | 2.24 | 51.85 | 53.77 | 0.15 | -0.31 | 4.71 |
| 2021-22 | BOS | 70 | 1147:10 | 51.15 | 2.46 | 2.95 | 38.29 | 2.20 | 2.15 | 52.81 | 57.92 | 0.37 | 0.13 | 1.77 |
| 2022-23 | BOS | 10 | 148:51 | 43.13 | 2.42 | 2.76 | 42.73 | 2.42 | 2.45 | 50.00 | 52.92 | 0.04 | 0.28 | -2.63 |
| 2023-24 | FLA | 2 | 23:37 | 43.19 | 0.00 | 2.65 | 35.57 | 5.08 | 2.74 | 0.00 | 49.18 | -0.17 | 0.89 | -11.24 |
| 2023-24 | NYI | 59 | 877:55 | 45.18 | 2.53 | 2.53 | 41.55 | 2.53 | 2.19 | 50.00 | 53.62 | 0.29 | -0.28 | 6.09 |
| 2023-24 | FLA, NYI | 61 | 901:32 | 45.12 | 2.46 | 2.53 | 41.40 | 2.60 | 2.20 | 48.68 | 53.48 | 0.28 | -0.25 | 5.54 |
| 2024-25 | NYI | 18 | 237:41 | 52.76 | 1.51 | 3.35 | 38.88 | 2.02 | 2.21 | 42.86 | 60.21 | 0.85 | -0.14 | 8.75 |
| 2025-26 | CAR | 42 | 563:20 | 48.14 | 2.56 | 3.04 | 34.30 | 1.81 | 2.36 | 58.54 | 56.33 | -0.04 | -0.10 | 0.67 |
NHL Edge Stats
| Skating | Shooting | Zone Time | |||||||||||
|---|---|---|---|---|---|---|---|---|---|---|---|---|---|
| Season | GP | Top Speed | Bursts>20/mi | Avg. Speed | Top Speed | Avg. Speed | %Long Range | %Mid Range | %High Danger | ES DZ% | ES NZ% | ES OZ% | |
| This table is for Basic and Premium subscribers only. To view please login to and/or subscribe to one of our subscription plans. | |||||||||||||
Legend
| Percentile 0-25 | Percentile 25-50 | Percentile 50-75 | Percentile 75-100 |
5v5 Defense Pairs
| Season | Teammate | Team | TOI | GF/60 | GA/60 | GF% | xGF/60 | xGA/60 | xGF% | xGF Rel | xGA Rel | xGF% Rel |
|---|
Glossary
| Type | Statistic | Definition |
|---|---|---|
| Individual | G/60 | Goals Against per 60 minutes. |
| Individual | A/60 | Assists per 60 minutes. |
| Individual | Pts/60 | Points per 60 minutes. |
| Individual | xG/60 | Expected Goals per 60 minutes. |
| Individual | GAE/60 | Goals Above Expected (G/60 - xG/60). |
| Individual | Sh% | Shooting Percentage. |
| Individual | xSh% | Expected Shooting Percentage. |
| Individual | Sh%AE | Shooting percentage above expected (Sh% - xSh%). |
| Individual | %SA Rush | Percentage of shot attempts determined to be on the rush. |
| Individual | %SA Reb. | Percentage of shot attempts determined to be from rebounds. |
| On Ice | SAF/60 | Shot Attempts For per 60 minutes. |
| On Ice | GF/60 | Goals For per 60 minutes. |
| On Ice | xGF/60 | Expected Goals For per 60 minutes. |
| On Ice | SAA/60 | Shot Attempts Against per 60 minutes (lower is better). |
| On Ice | GA/60 | Goals Against per 60 minutes (lower is better). |
| On Ice | xGA/60 | Expected Goals Against per 60 minutes (lower is better). |
| On Ice | GF% | Goals For Percentage = Goals For / (Goals For + Goals Against) |
| On Ice | xGF% | Expected Goals For Percentage = Expected Goals For / (Expected Goals For + Expected Goals Against) |
| On Ice | xGF Rel | xGF/60 when On Ice - xGF/60 when not On Ice. |
| On Ice | xGA Rel | xGA/60 when On Ice - xGA/60 when not On Ice (lower is better). |
| On Ice | xGF% Rel | xGF% when On Ice - xGF% when not On Ice. |
News and Opinions
-
Mike Reilly Could Add Veteran Depth to the Penguins Defense at The Hockey Writers (Fri Jun 26, 2026)
-
Mike Reilly: the next Parker Wotherspoon? at Yahoo Sports NHL (Fri Jun 19, 2026)
-
Mike Reilly: the next Parker Wotherspoon? at Pens Burgh (Fri Jun 19, 2026)
-
Former NY Islanders defenseman completes remarkable journey to Stanley Cup Champion at Eyes on Isles (Tue Jun 16, 2026)
-
The Life O' Reilly: Former Senators Defenseman Hoists The Stanley Cup at Yahoo Sports NHL (Mon Jun 15, 2026)
-
Halfway There: Three Former Senators Keep Stanley Cup Hopes Alive at Yahoo Sports NHL (Thu May 21, 2026)
-
Mike Reilly Provides Hurricanes With The Veteran Blueline Depth They Lacked Last Season at Yahoo Sports NHL (Wed Sep 24, 2025)
-
Mike Reilly might be the 7D for Carolina, but his veteran experience is valuable at Cardiac Cane (Sun Sep 7, 2025)
-
Hurricanes Sign Cayden Primeau, Amir Miftakhov, and Mike Reilly to One Year Deals at Canes Country (Wed Jul 2, 2025)
-
New Jersey Devils Free Agents Targets: Defensemen at Devils Army (Mon Jul 26, 2021)
Current Contract
Player does not currently have a contract.Mike Reilly signed a $1,100,000 1-year contract with the Carolina Hurricanes and General Manager Eric Tulsky on July 1, 2025 with an AAV of $1,100,000. This contract will start in 2025-26 and end after the 2025-26 season. In the first season of the contract the cap hit was equivalent to 1.15% of the salary cap.
Standard Contract (UFA) ( ) (0 ratings)
| Season | Age* | Clause | Cap Hit | AAV | Perf. Bonus | Sign. Bonus | Salary | Compensation | Minors Salary | Status | |
|---|---|---|---|---|---|---|---|---|---|---|---|
| 2025-26 | 32 | $1,100,000 | $1,100,000 | - | - | $1,100,000 | $1,100,000 | $1,100,000 | UFA | ||
| Total | - | - | $1,100,000 | $1,100,000 | $1,100,000 |
Mike Reilly signed a $1,250,000 1-year contract with the New York Islanders and General Manager Lou Lamoriello on July 1, 2024 with an AAV of $1,250,000. This contract will start in 2024-25 and end after the 2024-25 season. In the first season of the contract the cap hit was equivalent to 1.42% of the salary cap.
Standard Contract (UFA) ( ) (0 ratings)
| Season | Age* | Clause | Cap Hit | AAV | Perf. Bonus | Sign. Bonus | Salary | Compensation | Minors Salary | Status | |
|---|---|---|---|---|---|---|---|---|---|---|---|
| 2024-25 | 31 | $1,250,000 | $1,250,000 | - | - | $1,250,000 | $1,250,000 | $1,250,000 | UFA | ||
| Total | - | - | $1,250,000 | $1,250,000 | $1,250,000 |
Mike Reilly signed a $1,000,000 1-year contract with the Florida Panthers and General Manager Bill Zito on July 1, 2023 with an AAV of $1,000,000. This contract will start in 2023-24 and end after the 2023-24 season. In the first season of the contract the cap hit was equivalent to 1.20% of the salary cap.
Standard Contract (UFA) ( ) (0 ratings)
| Season | Age* | Clause | Cap Hit | AAV | Perf. Bonus | Sign. Bonus | Salary | Compensation | Minors Salary | Status | |
|---|---|---|---|---|---|---|---|---|---|---|---|
| 2023-24 | 30 | $1,000,000 | $1,000,000 | - | - | $1,000,000 | $1,000,000 | $1,000,000 | UFA | ||
| Total | - | - | $1,000,000 | $1,000,000 | $1,000,000 |
Mike Reilly signed a $9,000,000 3-year contract with the Boston Bruins and General Manager Don Sweeney on July 27, 2021 with an AAV of $3,000,000. This contract will start in 2021-22 and end after the 2023-24 season. In the first season of the contract the cap hit was equivalent to 3.68% of the salary cap. The Boston Bruins bought out this contract on June 30, 2023.
Standard Contract (UFA) ( ) (0 ratings)
| Season | Age* | Clause | Cap Hit | AAV | Perf. Bonus | Sign. Bonus | Salary | Compensation | Minors Salary | Status | |
|---|---|---|---|---|---|---|---|---|---|---|---|
| 2021-22 | 28 | $3,000,000 | $3,000,000 | - | - | $2,000,000 | $2,000,000 | $2,000,000 | UFA | ||
| 2022-23 | 29 | $3,000,000 | $3,000,000 | - | $250,000 | $2,750,000 | $3,000,000 | $3,000,000 | UFA | ||
| 2023-24 | 30 | $3,000,000 | $3,000,000 | - | - | $4,000,000 | $4,000,000 | $4,000,000 | UFA | ||
| Total | - | $250,000 | $8,750,000 | $9,000,000 | $9,000,000 |
Mike Reilly signed a $3,000,000 2-year contract with the Montreal Canadiens and General Manager Marc Bergevin on June 26, 2019 with an AAV of $1,500,000. This contract will start in 2019-20 and end after the 2020-21 season. In the first season of the contract the cap hit was equivalent to 1.84% of the salary cap.
Standard Contract (RFA) ( ) (0 ratings)
| Season | Age* | Clause | Cap Hit | AAV | Perf. Bonus | Sign. Bonus | Salary | Compensation | Minors Salary | Status | |
|---|---|---|---|---|---|---|---|---|---|---|---|
| 2019-20 | 26 | $1,500,000 | $1,500,000 | - | - | $1,500,000 | $1,500,000 | $1,500,000 | RFA-arb | ||
| 2020-21 | 27 | $1,500,000 | $1,500,000 | - | - | $1,500,000 | $1,500,000 | $1,500,000 | RFA-arb | ||
| Total | - | - | $3,000,000 | $3,000,000 | $3,000,000 |
Mike Reilly signed a $1,450,000 2-year contract with the Minnesota Wild and General Manager Chuck Fletcher on July 2, 2017 with an AAV of $725,000. This contract will start in 2017-18 and end after the 2018-19 season. In the first season of the contract the cap hit was equivalent to 0.97% of the salary cap.
Standard Contract (RFA) ( ) (0 ratings)
| Season | Age* | Clause | Cap Hit | AAV | Perf. Bonus | Sign. Bonus | Salary | Compensation | Minors Salary | Status | |
|---|---|---|---|---|---|---|---|---|---|---|---|
| 2017-18 | 24 | $725,000 | $725,000 | - | - | $675,000 | $675,000 | $675,000 | RFA-arb | ||
| 2018-19 | 25 | $725,000 | $725,000 | - | - | $775,000 | $775,000 | $775,000 | RFA-arb | ||
| Total | - | - | $1,450,000 | $1,450,000 | $1,450,000 |
Mike Reilly signed a $1,850,000 2-year contract with the Minnesota Wild and General Manager Chuck Fletcher on June 1, 2015 with an AAV of $925,000. This contract will start in 2015-16 and end after the 2016-17 season. In the first season of the contract the cap hit was equivalent to 1.30% of the salary cap.
Entry Level Contract ( ) (0 ratings)
| Season | Age* | Clause | Cap Hit | AAV | Perf. Bonus | Sign. Bonus | Salary | Compensation | Minors Salary | Status | |
|---|---|---|---|---|---|---|---|---|---|---|---|
| 2015-16 | 22 | $925,000 | $2,025,000 | $1,100,000 | $92,500 | $832,500 | $925,000 | $70,000 | ELC | ||
| 2016-17 | 23 | $925,000 | $2,025,000 | $1,100,000 | $92,500 | $832,500 | $925,000 | $70,000 | ELC | ||
| Total | $2,200,000 | $185,000 | $1,665,000 | $1,850,000 | $140,000 |
Contract Buyout Details
Boston Bruins
| Season | Original Compensation | Buyout Compensation | Compensation Savings | Original Caphit | Buyout Caphit | Caphit Savings |
|---|---|---|---|---|---|---|
| 2024-25 | $4,000,000 | $1,333,333 | $2,666,667 | $3,000,000 | $333,333 | $2,666,667 |
| 2025-26 | - | $1,333,333 | $-1,333,333 | - | $1,333,333 | $-1,333,333 |
Career Statistics
| Regular Season | Playoffs | |||||||||||||||||||
|---|---|---|---|---|---|---|---|---|---|---|---|---|---|---|---|---|---|---|---|---|
| Season | League | Team | GP | G | A | Pts | +/- | PIM | Shots | Sh% | TOI/G | GP | G | A | Pts | +/- | PIM | Shots | Sh% | TOI/G |
| 2008-09 | USHS-MN | Academy of Holy Angels | 25 | 2 | 24 | 26 | +37 | 12 | 2 | 1 | 1 | |||||||||
| 2009-10 | High-MN | Holy Angels | 24 | 4 | 29 | 33 | 19 | 2 | 3 | 2 | 5 | |||||||||
| 2010-11 | High-MN | Shat.-St. Mary's | 54 | 14 | 34 | 48 | 30 | |||||||||||||
| 2011-12 | BCHL | Penticton | 51 | 24 | 59 | 83 | 42 | 15 | 1 | 8 | 9 | 10 | ||||||||
| 2011-12 | RB-Cup | Penticton | 6 | 1 | 3 | 4 | 2 | |||||||||||||
| 2012-13 | WCHA | U. of Minnesota | 37 | 3 | 11 | 14 | 14 | |||||||||||||
| 2012-13 | WJC-A | USA | 7 | 1 | 2 | 3 | +4 | 4 | ||||||||||||
| 2013-14 | Big Ten | U. of Minnesota | 41 | 9 | 24 | 33 | 18 | |||||||||||||
| 2014-15 | Big Ten | U. of Minnesota | 39 | 6 | 36 | 42 | 44 | |||||||||||||
| 2014-15 | WC-A | USA | 10 | 0 | 1 | 1 | +3 | 10 | ||||||||||||
| 2015-16 | AHL | Iowa | 45 | 5 | 18 | 23 | -27 | 10 | 82 | 610.0 | ||||||||||
| 2015-16 | NHL | Minnesota Wild | 29 | 1 | 6 | 7 | -4 | 8 | 27 | 3.7 | 12:05 | |||||||||
| 2016-17 | AHL | Iowa Wild | 57 | 5 | 25 | 30 | +4 | 48 | ||||||||||||
| 2016-17 | NHL | Minnesota Wild | 17 | 1 | 0 | 1 | +1 | 2 | 19 | 5.3 | 12:23 | |||||||||
| 2017-18 | NHL | Minnesota Wild | 38 | 2 | 8 | 10 | -6 | 18 | 36 | 5.6 | 12:21 | |||||||||
| 2017-18 | NHL | Montréal Canadiens | 19 | 0 | 8 | 8 | +1 | 8 | 29 | 0.0 | 20:12 | |||||||||
| 2017-18 | AHL | Iowa Wild | 1 | 1 | 0 | 1 | -1 | 2 | ||||||||||||
| 2018-19 | NHL | Montréal Canadiens | 57 | 3 | 8 | 11 | 16 | 101 | 3.0 | 18:41 | ||||||||||
| 2019-20 | NHL | Ottawa Senators | 30 | 1 | 11 | 12 | -8 | 18 | 64 | 1.6 | 19:54 | |||||||||
| 2019-20 | NHL | Montréal Canadiens | 14 | 0 | 4 | 4 | +2 | 6 | 21 | 0.0 | 13:59 | |||||||||
| 2020-21 | NHL | Ottawa Senators | 40 | 0 | 19 | 19 | -2 | 18 | 67 | 0.0 | 18:36 | |||||||||
| 2020-21 | NHL | Boston Bruins | 15 | 0 | 8 | 8 | +7 | 4 | 31 | 0.0 | 21:04 | 11 | 4 | 4 | +3 | 8 | 21 | 0.0 | 21:29 | |
| 2021-22 | NHL | Boston Bruins | 70 | 4 | 13 | 17 | -1 | 32 | 135 | 3.0 | 18:57 | 5 | +1 | 2 | 7 | 0.0 | 15:47 | |||
| 2022-23 | NHL | Boston Bruins | 10 | 0 | 1 | 1 | 2 | 12 | 0.0 | 16:44 | ||||||||||
| 2022-23 | AHL | Providence Bruins | 36 | 7 | 19 | 26 | +3 | 34 | 1 | -1 | ||||||||||
| 2023-24 | NHL | Florida Panthers | 2 | 0 | 0 | 0 | -2 | 2 | 7 | 0.0 | 14:08 | |||||||||
| 2023-24 | NHL | New York Islanders | 59 | 6 | 18 | 24 | +1 | 28 | 119 | 5.0 | 17:16 | 5 | 1 | 1 | 2 | -3 | 12 | 8.3 | 18:57 | |
| 2024-25 | NHL | New York Islanders | 18 | 0 | 2 | 2 | -3 | 2 | 31 | 0.0 | 15:10 | |||||||||
| 2025-26 | NHL | Carolina Hurricanes | 42 | 1 | 8 | 9 | +11 | 26 | 63 | 1.6 | 14:58 | 2 | 2 | 2 | +2 | 2 | 2 | 0.0 | 12:55 | |
| NHL Career | 460 | 19 | 114 | 133 | -3 | 190 | 762 | 2.5 | 16:54 | 23 | 1 | 7 | 8 | +3 | 12 | 42 | 2.4 | 18:57 | ||