
 Mikael Granlund
| Position | Center / Right Wing | Current Team | Anaheim Ducks |
| Shoots | Left | Current Contract | 3 years ($7.0M CapHit) |
| Height | 5'10" | Expires | 2027-28 |
| Weight (lbs) | 193 | Expiry Age (Jun 30) | 36 |
| Age (DOB) | 34 (Feb 26, 1992) | Expiry Status | UFA |
| Drafted | 2010, Round 1, Overall 9 (MIN) |
| Date | Team | Transaction | |
|---|---|---|---|
| Dec 5, 2025 | Anaheim Ducks | Activated from IR | |
| Nov 26, 2025 | Anaheim Ducks | Placed on IR | |
| Jul 1, 2025 | Anaheim Ducks | Signed 3 years @ $7.000M AAV starting in 2025-26 | |
| Feb 1, 2025 | Dallas Stars | Acquired from San Jose Sharks | |
| Feb 1, 2025 | San Jose Sharks | Traded to Dallas Stars | |
| Jul 28, 2021 | Nashville Predators | Signed 4 years @ $5.000M AAV starting in 2021-22 | |
| Dec 23, 2020 | Nashville Predators | Signed 1 year @ $3.750M AAV starting in 2020-21 | |
| Aug 1, 2017 | Minnesota Wild | Signed 3 years @ $5.750M AAV starting in 2017-18 | |
| Jul 1, 2015 | Minnesota Wild | Signed 2 years @ $3.000M AAV starting in 2015-16 | |
| May 25, 2012 | Minnesota Wild | Signed to an entry level contract. |
Player Card(s)
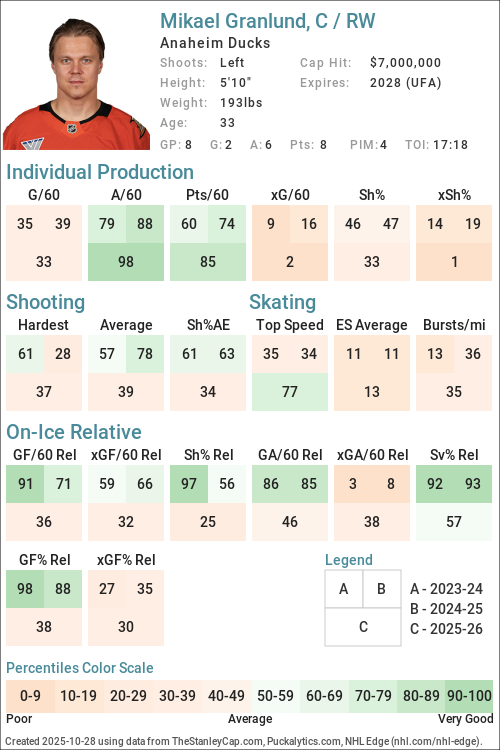
URL: https://thestanleycap.com/cdn/player_cards/20252026/mikael-granlund-8475798.png
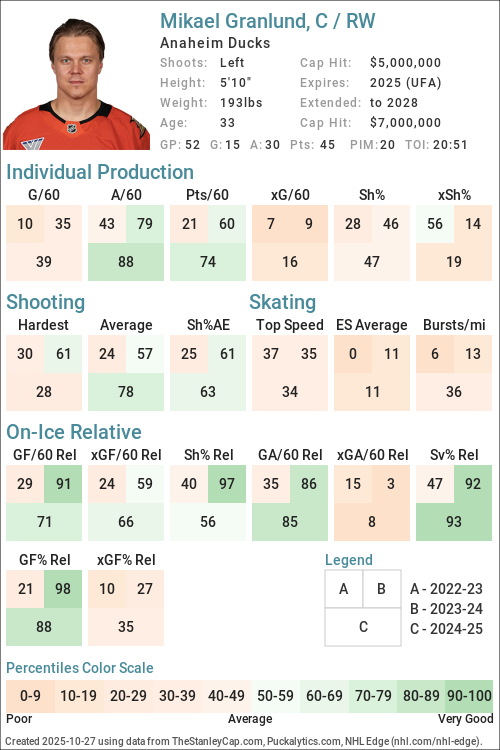
URL: https://thestanleycap.com/cdn/player_cards/20242025/mikael-granlund-8475798.png
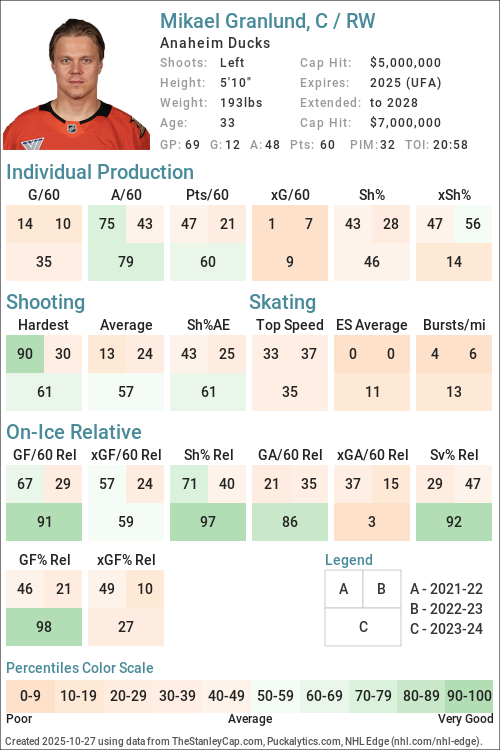
URL: https://thestanleycap.com/cdn/player_cards/20232024/mikael-granlund-8475798.png
About Player Cards
Player cards present an infographic of a players performance using a series of Player Archetypes developed for Puckalytics.com and TheStanleyCap.com. The boxes in the rink image show the archetype ratings for the season specified in the card while the graphs to the right show the five-year trends for those archetypes.
Except for Faceoffs, the values shown are the players z-score (standard deviation from the mean) for the specific metric used to calculate the archetype values. When calculating z-scores forwards were compared to forwards and defensemen were compared to defensemen. Positive values indicate the player is above average and shaded in blue, while negative values indicate the player is below average and shaded in pink. The five year trend charts show a range of -4.0 to 4.0.
The value shown for Faceoffs is the faceoff winning percentage rather than their z-score with winning percentages below 50 in pink shades and above 50 in blue shades.
All archetypes are 5v5 except 5v4 TOI, 4v5 TOI, Skating (even strength) and Faceoffs (all situations). Archetypes use regular season data only.
Archetypes Summary
- Sniper - Measures the to score above the expected goal rate.
- Rebound - Measures the percent of a players shot attempts that come from rebounds (forwards only).
- 5v4 TOI - Powerplay ice time, calculated as the percentage of his teams 5v4 ice time that the player was on the ice for.
- Shooter - Measures whether a players points come from shots (goals or assists on rebounds from his shots).
- Producer - Measures a players ability to produce goals and assists, adjusted for quality of teammates.
- Playmaker - Measures whether a players points come from passes.
- Drive - Measures a players ability to drive puck possession and generate shot attempts for his team.
- Rush - Measures the percent of a players shot attempts that come from rush plays
- Possession - An indicator of a players ability to improve his teams puck possession game.
- Faceoffs - Faceoff Winning Percentage (min. 75 faceoffs taken).
- 5v5 TOI - The percentage of his teams 5v5 TOI that the player was on the ice for.
- Suppress - Measures a players ability to suppress opponent puck possession and shot attempts against.
- Skating - An indicator of a players skating ability, or speed bursts above 20mph per mile skated.
- Defend - An indicator of a players ability to suppress shot quality against.
- 4v5 TOI - Penalty Kill ice time, calculated as the percentage of his teams 4v5 ice time that the player was on the ice for.
Data Sources
- Salary data is from TheStanleyCap.com
- Skating data is from NHL Edge
- Other statistics are from Puckalytics.com and derived from data from NHL.com
Terms of Use
You are free to use include player cards in written articles, share on social media, or on other public websites under the following conditions:
- You credit TheStanleyCap.com as the source and provide a link back to TheStanleyCap.com or this player page.
- You do not mass copy/duplicate/publish dozens or hundreds of player cards. A few, or a handful for a written article is fine. Be reasonable. Fair use rules apply.
- If you are a high-traffic website you must download and host the image(s) on your site rather than overload TheStanleyCap servers with traffic.
Note: Player cards will update daily throughout the season so if you want to include snapshot then you must download the image.
If you have any questions, send an e-mail to the e-mail address at the top of this page.
Read Introducing Player Archetypes on HockeyAnalysis.com for more details on archetype calculations.
Core Archetypes
| Season | Team(s) | GP | TOI | Producer | Playmaker | Shooter | Sniper | Rebound | Rush | Skating | Defend |
|---|---|---|---|---|---|---|---|---|---|---|---|
| 2015-16 | MIN | 82 | 0.09 | 0.41 | -0.51 | -0.64 | 1.81 | -1.69 | - | -0.90 | |
| 2016-17 | MIN | 81 | 0.39 | 0.77 | -0.44 | 0.13 | 0.89 | 0.90 | - | 0.31 | |
| 2017-18 | MIN | 77 | 1.00 | 1.70 | -0.39 | -0.19 | 0.16 | -0.52 | - | -0.20 | |
| 2018-19 | MIN, NSH | 79 | -0.27 | 0.27 | -0.71 | -0.61 | 1.35 | -0.73 | - | 1.18 | |
| 2019-20 | NSH | 63 | -0.71 | -0.76 | -0.30 | -0.22 | 0.29 | 0.04 | - | -0.54 | |
| 2020-21 | NSH | 51 | -0.33 | -0.05 | -0.53 | 0.77 | 1.01 | 1.01 | - | 0.40 | |
| 2021-22 | NSH | 80 | -0.50 | 0.54 | -1.11 | -0.09 | -0.59 | -0.63 | -1.27 | -0.54 | |
| 2022-23 | NSH, PIT | 79 | -0.85 | -0.18 | -0.99 | -0.87 | -0.22 | 1.39 | -1.20 | -0.05 | |
| 2023-24 | SJS | 69 | 0.24 | 0.78 | -0.52 | 0.08 | 0.08 | -0.27 | -0.99 | 1.46 | |
| 2024-25 | DAL, SJS | 83 | 0.53 | 1.56 | -0.73 | 0.09 | -0.57 | -1.17 | -0.53 | 1.45 | |
| 2025-26 | ANA | 58 | 0.29 | 0.48 | -0.24 | 0.03 | 0.65 | -0.50 | -0.33 | 0.71 |
Situational and Secondary Archetypes
| Season | Team(s) | GP | TOI | 5v5 TOI | 5v4 TOI | 4v5 TOI | Possession | Drive | Suppress | Faceoffs |
|---|---|---|---|---|---|---|---|---|---|---|
| 2015-16 | MIN | 82 | 0.87 | 0.48 | -1.00 | 0.52 | 1.28 | -1.19 | 48.7 | |
| 2016-17 | MIN | 81 | 1.03 | 0.48 | 0.66 | -0.36 | -0.32 | -0.25 | - | |
| 2017-18 | MIN | 77 | 0.66 | 0.68 | 0.81 | 1.25 | 1.05 | 0.60 | 55.2 | |
| 2018-19 | MIN, NSH | 79 | 1.02 | 0.63 | -1.14 | 0.12 | 0.64 | -0.65 | 44.8 | |
| 2019-20 | NSH | 63 | 0.98 | 0.30 | -0.87 | 0.38 | 0.41 | 0.11 | 48.7 | |
| 2020-21 | NSH | 51 | 0.68 | 0.68 | 0.94 | -0.72 | -0.09 | -1.32 | 51.8 | |
| 2021-22 | NSH | 80 | 1.12 | 1.15 | 0.38 | -0.29 | 0.14 | -0.83 | 47.2 | |
| 2022-23 | NSH, PIT | 79 | 0.53 | 0.35 | -0.41 | -1.40 | -0.91 | -1.17 | 44.5 | |
| 2023-24 | SJS | 69 | 1.12 | 1.39 | 1.22 | -0.31 | 0.21 | -1.16 | 46.8 | |
| 2024-25 | DAL, SJS | 83 | 0.87 | 0.70 | 0.21 | 0.11 | 0.82 | -1.36 | 49.6 | |
| 2025-26 | ANA | 58 | 0.51 | 0.67 | 0.49 | -0.23 | 0.32 | -0.78 | 49.7 |
5v5 Individual Stats
| Season | Team(s) | GP | TOI | G/60 | A/60 | Pts/60 | xG/60 | GAE/60 | Sh% | xSh% | Sh%AE | %SA Rush | %SA Reb. |
|---|---|---|---|---|---|---|---|---|---|---|---|---|---|
| 2015-16 | MIN | 82 | 1073:19 | 0.39 | 0.95 | 1.34 | 0.55 | -0.16 | 6.54 | 9.19 | -2.65 | 0.72 | 9.42 |
| 2016-17 | MIN | 81 | 1110:06 | 0.59 | 1.24 | 1.84 | 0.57 | 0.02 | 8.66 | 8.31 | 0.35 | 5.88 | 7.06 |
| 2017-18 | MIN | 77 | 999:46 | 0.66 | 1.44 | 2.10 | 0.71 | -0.05 | 9.24 | 9.90 | -0.66 | 2.94 | 5.29 |
| 2018-19 | MIN | 63 | 866:23 | 0.62 | 1.04 | 1.66 | 0.67 | -0.05 | 7.83 | 8.40 | -0.57 | 2.52 | 6.92 |
| 2018-19 | NSH | 16 | 224:12 | 0.00 | 0.27 | 0.27 | 0.65 | -0.65 | 0.00 | 9.78 | -9.78 | 3.12 | 15.62 |
| 2018-19 | MIN, NSH | 79 | 1090:35 | 0.50 | 0.88 | 1.38 | 0.67 | -0.17 | 6.43 | 8.64 | -2.22 | 2.62 | 8.38 |
| 2019-20 | NSH | 63 | 854:23 | 0.63 | 0.70 | 1.33 | 0.69 | -0.06 | 9.68 | 10.57 | -0.90 | 3.94 | 7.09 |
| 2020-21 | NSH | 51 | 669:28 | 0.63 | 0.90 | 1.52 | 0.47 | 0.15 | 13.73 | 10.38 | 3.35 | 5.88 | 8.82 |
| 2021-22 | NSH | 80 | 1097:42 | 0.38 | 1.20 | 1.59 | 0.40 | -0.02 | 9.46 | 9.84 | -0.38 | 2.78 | 4.63 |
| 2022-23 | NSH | 58 | 767:08 | 0.39 | 0.94 | 1.33 | 0.45 | -0.06 | 11.11 | 12.69 | -1.58 | 2.82 | 5.63 |
| 2022-23 | PIT | 21 | 238:16 | 0.25 | 0.76 | 1.01 | 0.79 | -0.54 | 3.12 | 9.83 | -6.70 | 13.89 | 8.33 |
| 2022-23 | NSH, PIT | 79 | 1005:24 | 0.36 | 0.90 | 1.25 | 0.53 | -0.17 | 7.79 | 11.50 | -3.71 | 6.54 | 6.54 |
| 2023-24 | SJS | 69 | 997:50 | 0.54 | 1.20 | 1.74 | 0.52 | 0.02 | 9.68 | 9.31 | 0.37 | 3.31 | 8.26 |
| 2024-25 | SJS | 52 | 727:55 | 0.58 | 1.32 | 1.90 | 0.50 | 0.08 | 9.46 | 8.14 | 1.32 | 0.00 | 4.85 |
| 2024-25 | DAL | 31 | 412:50 | 0.58 | 1.31 | 1.89 | 0.69 | -0.11 | 12.90 | 15.36 | -2.46 | 1.89 | 7.55 |
| 2024-25 | DAL, SJS | 83 | 1140:45 | 0.58 | 1.31 | 1.89 | 0.57 | 0.01 | 10.48 | 10.27 | 0.21 | 0.64 | 5.77 |
| 2025-26 | ANA | 58 | 747:57 | 0.64 | 1.12 | 1.76 | 0.67 | -0.03 | 11.94 | 12.51 | -0.57 | 1.85 | 10.19 |
5v5 On Ice Stats
| Season | Team(s) | GP | TOI | SAF/60 | GF/60 | xGF/60 | SAA/60 | GA/60 | xGA/60 | GF% | xGF% | xGF Rel | xGA Rel | xGF% Rel |
|---|---|---|---|---|---|---|---|---|---|---|---|---|---|---|
| 2015-16 | MIN | 82 | 1073:19 | 42.21 | 1.79 | 2.35 | 42.21 | 2.35 | 2.21 | 43.24 | 51.49 | 0.47 | 0.34 | 1.39 |
| 2016-17 | MIN | 81 | 1110:06 | 39.62 | 2.92 | 2.34 | 41.94 | 2.16 | 1.87 | 57.45 | 55.52 | 0.01 | -0.11 | 1.52 |
| 2017-18 | MIN | 77 | 999:46 | 42.79 | 2.88 | 2.55 | 41.05 | 2.22 | 1.85 | 56.47 | 57.95 | 0.47 | -0.26 | 8.34 |
| 2018-19 | MIN | 63 | 866:23 | 45.92 | 2.01 | 2.79 | 39.82 | 1.80 | 2.12 | 52.73 | 56.86 | 0.51 | 0.18 | 2.83 |
| 2018-19 | NSH | 16 | 224:12 | 44.69 | 1.61 | 2.37 | 46.03 | 2.68 | 2.47 | 37.50 | 48.97 | -0.12 | -0.10 | -0.26 |
| 2018-19 | MIN, NSH | 79 | 1090:35 | 45.66 | 1.93 | 2.71 | 41.10 | 1.98 | 2.19 | 49.30 | 55.25 | 0.38 | 0.12 | 2.40 |
| 2019-20 | NSH | 63 | 854:23 | 46.70 | 2.39 | 2.63 | 42.28 | 2.74 | 2.42 | 46.58 | 52.15 | 0.20 | -0.06 | 2.57 |
| 2020-21 | NSH | 51 | 669:28 | 41.41 | 2.51 | 2.38 | 43.65 | 2.06 | 2.56 | 54.90 | 48.16 | 0.09 | 0.29 | -2.00 |
| 2021-22 | NSH | 80 | 1097:42 | 41.98 | 2.84 | 2.58 | 43.40 | 2.68 | 2.45 | 51.49 | 51.33 | 0.22 | 0.05 | 1.71 |
| 2022-23 | NSH | 58 | 767:08 | 40.28 | 2.11 | 2.55 | 47.87 | 2.66 | 3.14 | 44.26 | 44.81 | -0.25 | 0.48 | -6.39 |
| 2022-23 | PIT | 21 | 238:16 | 41.55 | 2.27 | 2.93 | 41.55 | 2.01 | 2.19 | 52.94 | 57.24 | -0.31 | -0.50 | 2.64 |
| 2022-23 | NSH, PIT | 79 | 1005:24 | 40.58 | 2.15 | 2.64 | 46.37 | 2.51 | 2.92 | 46.15 | 47.52 | -0.28 | 0.24 | -4.65 |
| 2023-24 | SJS | 69 | 997:50 | 38.18 | 2.53 | 2.23 | 50.39 | 3.07 | 3.20 | 45.16 | 41.08 | 0.20 | 0.45 | -1.39 |
| 2024-25 | SJS | 52 | 727:55 | 39.65 | 2.64 | 2.22 | 51.10 | 2.80 | 3.05 | 48.48 | 42.09 | 0.20 | 0.15 | 1.10 |
| 2024-25 | DAL | 31 | 412:50 | 41.57 | 3.05 | 2.55 | 50.43 | 2.18 | 3.29 | 58.33 | 43.70 | 0.14 | 0.63 | -3.84 |
| 2024-25 | DAL, SJS | 83 | 1140:45 | 40.34 | 2.79 | 2.34 | 50.86 | 2.58 | 3.14 | 51.96 | 42.71 | 0.17 | 0.33 | -0.84 |
| 2025-26 | ANA | 58 | 747:57 | 47.89 | 2.57 | 3.12 | 42.52 | 2.97 | 2.68 | 46.38 | 53.82 | 0.29 | -0.05 | 2.89 |
NHL Edge Stats
| Skating | Shooting | Zone Time | |||||||||||
|---|---|---|---|---|---|---|---|---|---|---|---|---|---|
| Season | GP | Top Speed | Bursts>20/mi | Avg. Speed | Top Speed | Avg. Speed | %Long Range | %Mid Range | %High Danger | ES DZ% | ES NZ% | ES OZ% | |
| This table is for Basic and Premium subscribers only. To view please login to and/or subscribe to one of our subscription plans. | |||||||||||||
Legend
| Percentile 0-25 | Percentile 25-50 | Percentile 50-75 | Percentile 75-100 |
5v5 Lines
| Season | Teammate | Teammate | Team | TOI | GF/60 | GA/60 | GF% | xGF/60 | xGA/60 | xGF% | xGF Rel | xGA Rel | xGF% Rel |
|---|
Glossary
| Type | Statistic | Definition |
|---|---|---|
| Individual | G/60 | Goals Against per 60 minutes. |
| Individual | A/60 | Assists per 60 minutes. |
| Individual | Pts/60 | Points per 60 minutes. |
| Individual | xG/60 | Expected Goals per 60 minutes. |
| Individual | GAE/60 | Goals Above Expected (G/60 - xG/60). |
| Individual | Sh% | Shooting Percentage. |
| Individual | xSh% | Expected Shooting Percentage. |
| Individual | Sh%AE | Shooting percentage above expected (Sh% - xSh%). |
| Individual | %SA Rush | Percentage of shot attempts determined to be on the rush. |
| Individual | %SA Reb. | Percentage of shot attempts determined to be from rebounds. |
| On Ice | SAF/60 | Shot Attempts For per 60 minutes. |
| On Ice | GF/60 | Goals For per 60 minutes. |
| On Ice | xGF/60 | Expected Goals For per 60 minutes. |
| On Ice | SAA/60 | Shot Attempts Against per 60 minutes (lower is better). |
| On Ice | GA/60 | Goals Against per 60 minutes (lower is better). |
| On Ice | xGA/60 | Expected Goals Against per 60 minutes (lower is better). |
| On Ice | GF% | Goals For Percentage = Goals For / (Goals For + Goals Against) |
| On Ice | xGF% | Expected Goals For Percentage = Expected Goals For / (Expected Goals For + Expected Goals Against) |
| On Ice | xGF Rel | xGF/60 when On Ice - xGF/60 when not On Ice. |
| On Ice | xGA Rel | xGA/60 when On Ice - xGA/60 when not On Ice (lower is better). |
| On Ice | xGF% Rel | xGF% when On Ice - xGF% when not On Ice. |
News and Opinions
-
Canadiens might be able to solve their Top 6 problem with one call to the Ducks at A Winning Habit (Thu Jul 9, 2026)
-
WINNERS! Golden Knights Eliminate Ducks in Blowout Victory, Advance to Western Conference Finals at Yahoo Sports NHL (Fri May 15, 2026)
-
Takeaways from the Ducks 3-2 OT Win over the Flames at Yahoo Sports NHL (Fri Mar 27, 2026)
-
Granlund caps hat trick with OT winner as Ducks defeat Flames 3-2 at Yahoo Sports NHL (Fri Mar 27, 2026)
-
The Ducks beat the Canucks 5-3 as Mikael Granlund scores 2 goals at Yahoo Sports NHL (Wed Mar 25, 2026)
-
One key stat for each Duck Olympian before the tournament begins at Pucks of a Feather (Tue Feb 10, 2026)
-
Anaheim Ducks 2026 Olympic Preview at Yahoo Sports NHL (Tue Feb 10, 2026)
-
Beckett Sennecke sets up Mikael Granlund in OT, Ducks beat Kings 2-1 for weekend sweep at Yahoo Sports NHL (Sun Jan 18, 2026)
-
Fantasy Hockey Waiver Wire: Mikael Granlund, Jackson Blake among top players to add this week at Yahoo Sports NHL (Mon Dec 29, 2025)
-
Week two recap for the Anaheim Ducks at Pucks of a Feather (Sun Oct 26, 2025)
-
In a battle of the backups, the Ducks fight back at Pucks of a Feather (Fri Oct 24, 2025)
-
Questions Facing Each Anaheim Ducks Forward Heading into the 2025-26 Season at Yahoo Sports NHL (Mon Sep 8, 2025)
-
Predators: Revisiting the Mikael Granlund/Kevin Fiala Trade at The Hockey Writers (Sun Aug 17, 2025)
-
The Mikael Granlund Contract Should Have Ended the Marco Rossi Debate at Hockey Wilderness (Tue Jul 8, 2025)
-
Should the Canadiens Target Mason McTavish After Ducks Sign Granlund? at A Winning Habit (Wed Jul 2, 2025)
-
Blues reportedly preparing offer for Mikael Granlund at Bleedin' Blue (Mon Jun 30, 2025)
-
3 teams that could steal Mikael Granlund away in free agency at Blackout Dallas (Fri Jun 13, 2025)
-
Signing this veteran winger could make the Sabres a threat next season at Sabres Noise (Fri Jun 6, 2025)
-
Sharks could reunite with key contributor this offseason at Blades of Teal (Mon Jun 2, 2025)
-
San Jose Sharks trade Mikael Granlund and Cody Ceci to the Dallas Stars at Blades of Teal (Sat Feb 1, 2025)
-
What do the San Jose Sharks do with pending UFA forward Mikael Granlund? at Blades of Teal (Fri Jan 31, 2025)
-
New Jersey Devils Free Agents Targets: Forwards at Devils Army (Wed Jul 28, 2021)
-
Free Agent Profile: Mikael Granlund, Two-Way Finnish Forward at Devils Army (Sat Aug 29, 2020)
Current Contract
Mikael Granlund signed a $21,000,000 3-year contract with the Anaheim Ducks and General Manager Pat Verbeek on July 1, 2025 with an AAV of $7,000,000. This contract will start in 2025-26 and end after the 2027-28 season. In the first season of the contract the cap hit was equivalent to 7.33% of the salary cap.
Standard Contract (UFA) ( ) (0 ratings)
Mikael Granlund signed a $20,000,000 4-year contract with the Nashville Predators and General Manager David Poile on July 28, 2021 with an AAV of $5,000,000. This contract will start in 2021-22 and end after the 2024-25 season. In the first season of the contract the cap hit was equivalent to 6.13% of the salary cap.
Standard Contract (UFA) ( ) (0 ratings)
| Season | Age* | Clause | Cap Hit | AAV | Perf. Bonus | Sign. Bonus | Salary | Compensation | Minors Salary | Status | |
|---|---|---|---|---|---|---|---|---|---|---|---|
| 2021-22 | 29 | $5,000,000 | $5,000,000 | - | - | $4,000,000 | $4,000,000 | $4,000,000 | UFA | ||
| 2022-23 | 30 | $5,000,000 | $5,000,000 | - | - | $5,000,000 | $5,000,000 | $5,000,000 | UFA | ||
| 2023-24 | 31 | $5,000,000 | $5,000,000 | - | - | $6,000,000 | $6,000,000 | $6,000,000 | UFA | ||
| 2024-25 | 32 | $5,000,000 | $5,000,000 | - | - | $5,000,000 | $5,000,000 | $5,000,000 | UFA | ||
| Total | - | - | $20,000,000 | $20,000,000 | $20,000,000 |
Mikael Granlund signed a $3,750,000 1-year contract with the Nashville Predators and General Manager David Poile on December 23, 2020 with an AAV of $3,750,000. This contract will start in 2020-21 and end after the 2020-21 season. In the first season of the contract the cap hit was equivalent to 4.60% of the salary cap.
Standard Contract (UFA) ( ) (0 ratings)
| Season | Age* | Clause | Cap Hit | AAV | Perf. Bonus | Sign. Bonus | Salary | Compensation | Minors Salary | Status | |
|---|---|---|---|---|---|---|---|---|---|---|---|
| 2020-21 | 28 | $3,750,000 | $3,750,000 | - | - | $3,750,000 | $3,750,000 | $3,750,000 | UFA | ||
| Total | - | - | $3,750,000 | $3,750,000 | $3,750,000 |
Mikael Granlund signed a $17,250,000 3-year contract with the Minnesota Wild and General Manager Chuck Fletcher on August 1, 2017 with an AAV of $5,750,000. This contract will start in 2017-18 and end after the 2019-20 season. In the first season of the contract the cap hit was equivalent to 7.67% of the salary cap.
Standard Contract (RFA) ( ) (0 ratings)
| Season | Age* | Clause | Cap Hit | AAV | Perf. Bonus | Sign. Bonus | Salary | Compensation | Minors Salary | Status | |
|---|---|---|---|---|---|---|---|---|---|---|---|
| 2017-18 | 25 | $5,750,000 | $5,750,000 | - | - | $5,250,000 | $5,250,000 | $5,250,000 | RFA-arb | ||
| 2018-19 | 26 | $5,750,000 | $5,750,000 | - | - | $5,500,000 | $5,500,000 | $5,500,000 | RFA-arb | ||
| 2019-20 | 27 | $5,750,000 | $5,750,000 | - | - | $6,500,000 | $6,500,000 | $6,500,000 | UFA | ||
| Total | - | - | $17,250,000 | $17,250,000 | $17,250,000 |
Mikael Granlund signed a $6,000,000 2-year contract with the Minnesota Wild and General Manager Chuck Fletcher on July 1, 2015 with an AAV of $3,000,000. This contract will start in 2015-16 and end after the 2016-17 season. In the first season of the contract the cap hit was equivalent to 4.20% of the salary cap.
Standard Contract (RFA) ( ) (0 ratings)
| Season | Age* | Clause | Cap Hit | AAV | Perf. Bonus | Sign. Bonus | Salary | Compensation | Minors Salary | Status | |
|---|---|---|---|---|---|---|---|---|---|---|---|
| 2015-16 | 23 | $3,000,000 | $3,000,000 | - | - | $2,800,000 | $2,800,000 | $2,800,000 | RFA | ||
| 2016-17 | 24 | $3,000,000 | $3,000,000 | - | - | $3,200,000 | $3,200,000 | $3,200,000 | RFA-arb | ||
| Total | - | - | $6,000,000 | $6,000,000 | $6,000,000 |
Mikael Granlund signed a $2,700,000 3-year contract with the Minnesota Wild and General Manager Chuck Fletcher on May 25, 2012 with an AAV of $900,000. This contract will start in 2012-13 and end after the 2014-15 season. In the first season of the contract the cap hit was equivalent to 1.50% of the salary cap.
Entry Level Contract ( ) (0 ratings)
| Season | Age* | Clause | Cap Hit | AAV | Perf. Bonus | Sign. Bonus | Salary | Compensation | Minors Salary | Status | |
|---|---|---|---|---|---|---|---|---|---|---|---|
| 2012-13 | 20 | $900,000 | $2,100,000 | $1,200,000 | $90,000 | $810,000 | $900,000 | $67,500 | ELC | ||
| 2013-14 | 21 | $900,000 | $2,100,000 | $1,200,000 | $90,000 | $810,000 | $900,000 | $67,500 | ELC | ||
| 2014-15 | 22 | $900,000 | $2,100,000 | $1,200,000 | $90,000 | $810,000 | $900,000 | $67,500 | ELC | ||
| Total | $3,600,000 | $270,000 | $2,430,000 | $2,700,000 | $202,500 |
Career Statistics
| Regular Season | Playoffs | |||||||||||||||||||
|---|---|---|---|---|---|---|---|---|---|---|---|---|---|---|---|---|---|---|---|---|
| Season | League | Team | GP | G | A | Pts | +/- | PIM | Shots | Sh% | TOI/G | GP | G | A | Pts | +/- | PIM | Shots | Sh% | TOI/G |
| 2005-06 | Jr. C SM-sarja Q | Laser HT U16 | 11 | 9 | 16 | 25 | ||||||||||||||
| 2006-07 | Jr. C SM-sarja Q | Kärpät U16 | 11 | 20 | 17 | 37 | 2 | |||||||||||||
| 2006-07 | U16 SM-sarja | Kärpät U16 | 8 | 3 | 7 | 10 | ||||||||||||||
| 2007-08 | Fin-U18 | Karpat U18 | 31 | 22 | 27 | 49 | 20 | 5 | 3 | 5 | 8 | 0.0 | ||||||||
| 2008-09 | Fin-Jr. | Karpat Jr. | 38 | 22 | 44 | 66 | 45 | |||||||||||||
| 2008-09 | Finland-2 | Suomi U20 | 6 | 4 | 3 | 7 | ||||||||||||||
| 2008-09 | WJ18-A | Finland | 6 | 2 | 11 | 13 | ||||||||||||||
| 2008-09 | Finland | Karpat | 2 | 0 | 0 | 0 | ||||||||||||||
| 2008-09 | Fin-U18 | Karpat U18 | 3 | 2 | 4 | 6 | 2 | 0.0 | ||||||||||||
| 2009-10 | WJ18-A | Finland | 6 | 4 | 9 | 13 | 4 | |||||||||||||
| 2009-10 | Finland-2 | Suomi U20 | 1 | 0 | 0 | 0 | ||||||||||||||
| 2009-10 | Finland | Hifk | 43 | 13 | 27 | 40 | 2 | 6 | 1 | 5 | 6 | |||||||||
| 2010-11 | WC-A | Finland | 9 | 2 | 7 | 9 | +3 | 2 | ||||||||||||
| 2010-11 | WJ18-A | Finland | 6 | 2 | 8 | 10 | +4 | 6 | ||||||||||||
| 2010-11 | Finland | HIFK | 39 | 8 | 28 | 36 | 14 | 15 | 5 | 11 | 16 | 4 | ||||||||
| 2011-12 | WC-A | Finland | 10 | 1 | 4 | 5 | -1 | 2 | ||||||||||||
| 2011-12 | WJC-A | Finland | 7 | 2 | 9 | 11 | +4 | |||||||||||||
| 2011-12 | Finland | HIFK | 45 | 20 | 31 | 51 | 18 | 4 | 2 | 2 | ||||||||||
| 2012-13 | NHL | Minnesota Wild | 27 | 2 | 6 | 8 | -4 | 6 | 36 | 5.6 | 13:11 | |||||||||
| 2012-13 | WC-A | Finland | 4 | 1 | 2 | 3 | +1 | |||||||||||||
| 2012-13 | AHL | Houston | 29 | 10 | 18 | 28 | -1 | 8 | 53 | 1,887.0 | 5 | 1 | 1 | 2 | -2 | 4 | 7 | 1,429.0 | ||
| 2013-14 | Olympics | Finland | 6 | 3 | 4 | 7 | +3 | 4 | 20 | |||||||||||
| 2013-14 | NHL | Minnesota Wild | 63 | 8 | 33 | 41 | -3 | 22 | 104 | 7.7 | 17:19 | 13 | 4 | 3 | 7 | +3 | 2 | 35 | 11.4 | 18:01 |
| 2014-15 | NHL | Minnesota Wild | 68 | 8 | 31 | 39 | +17 | 20 | 99 | 8.1 | 17:54 | 10 | 2 | 4 | 6 | +2 | 18 | 11.1 | 17:50 | |
| 2015-16 | WC-A | Finland | 10 | 4 | 8 | 12 | +6 | 2 | 13 | |||||||||||
| 2015-16 | NHL | Minnesota Wild | 82 | 13 | 31 | 44 | -12 | 20 | 160 | 8.1 | 18:07 | 6 | 1 | 2 | 3 | -2 | 22 | 4.6 | 22:22 | |
| 2016-17 | WCup | Finland | 3 | 0 | 0 | 0 | -4 | |||||||||||||
| 2016-17 | NHL | Minnesota Wild | 81 | 26 | 43 | 69 | +23 | 12 | 177 | 14.7 | 18:49 | 5 | 2 | 2 | 2 | 10 | 0.0 | 20:32 | ||
| 2017-18 | WC | Finland | 8 | 2 | 7 | 9 | +3 | 2 | ||||||||||||
| 2017-18 | NHL | Minnesota Wild | 77 | 21 | 46 | 67 | +13 | 18 | 193 | 10.9 | 18:47 | 5 | 1 | 2 | 3 | -1 | 6 | 16.7 | 18:24 | |
| 2018-19 | NHL | Minnesota Wild | 63 | 15 | 34 | 49 | -2 | 20 | 160 | 9.4 | 18:43 | |||||||||
| 2018-19 | NHL | Nashville Predators | 16 | 1 | 4 | 5 | -6 | 4 | 29 | 3.4 | 16:54 | 6 | 1 | 1 | 2 | +1 | 2 | 12 | 8.3 | 15:11 |
| 2019-20 | NHL | Nashville Predators | 63 | 17 | 13 | 30 | -4 | 28 | 130 | 13.1 | 17:48 | 4 | 1 | 1 | -3 | 2 | 7 | 0.0 | 18:43 | |
| 2020-21 | NHL | Nashville Predators | 51 | 13 | 14 | 27 | -1 | 14 | 74 | 17.6 | 19:28 | 6 | 2 | 3 | 5 | -3 | 2 | 10 | 20.0 | 23:39 |
| 2021-22 | WC | Finland | 9 | 5 | 6 | 11 | +2 | 2 | ||||||||||||
| 2021-22 | NHL | Nashville Predators | 80 | 11 | 53 | 64 | -9 | 33 | 117 | 9.4 | 20:25 | 4 | 3 | 3 | -1 | 10 | 0.0 | 21:52 | ||
| 2022-23 | NHL | Nashville Predators | 58 | 9 | 27 | 36 | -16 | 12 | 83 | 10.8 | 18:38 | |||||||||
| 2022-23 | NHL | Pittsburgh Penguins | 21 | 1 | 4 | 5 | +1 | 8 | 38 | 2.6 | 15:35 | |||||||||
| 2023-24 | NHL | San Jose Sharks | 69 | 12 | 48 | 60 | -23 | 32 | 134 | 9.0 | 20:58 | |||||||||
| 2024-25 | NHL | San Jose Sharks | 52 | 15 | 30 | 45 | -8 | 20 | 126 | 11.9 | 20:51 | |||||||||
| 2024-25 | 4 Nations | Finland | 3 | 3 | 1 | 4 | -1 | 6 | 50.0 | 16:46 | ||||||||||
| 2024-25 | NHL | Dallas Stars | 31 | 7 | 14 | 21 | +8 | 8 | 43 | 16.3 | 17:05 | 18 | 5 | 5 | 10 | -2 | 8 | 29 | 17.2 | 17:27 |
| 2025-26 | OG | Finland | 6 | 2 | 1 | 3 | +3 | 14 | 14.0 | 17:16 | ||||||||||
| 2025-26 | NHL | Anaheim Ducks | 58 | 19 | 22 | 41 | -9 | 18 | 117 | 16.2 | 19:10 | 12 | 5 | 5 | 10 | -3 | 4 | 20 | 25.0 | 19:12 |
| NHL Career | 960 | 198 | 453 | 651 | -35 | 295 | 1820 | 10.9 | 18:39 | 89 | 21 | 31 | 52 | -9 | 22 | 179 | 11.7 | 18:53 | ||