
 Matt Roy
| Position | Right Defense | Current Team | Washington Capitals |
| Shoots | Right | Current Contract | 6 years ($5.8M CapHit) |
| Height | 6'2" | Expires | 2029-30 |
| Weight (lbs) | 220 | Expiry Age (Jun 30) | 35 |
| Age (DOB) | 31 (Mar 1, 1995) | Expiry Status | UFA |
| Drafted | 2015, Round 7, Overall 194 (LAK) |
| Date | Team | Transaction | |
|---|---|---|---|
| Feb 2, 2026 | Washington Capitals | Activated from IR | |
| Jan 31, 2026 | Washington Capitals | Placed on IR | |
| Nov 6, 2024 | Washington Capitals | Activated from IR | |
| Oct 28, 2024 | Washington Capitals | Placed on IR | |
| Jul 1, 2024 | Washington Capitals | Signed 6 years @ $5.750M AAV starting in 2024-25 | |
| Mar 21, 2021 | Los Angeles Kings | Signed 3 years @ $3.150M AAV starting in 2021-22 | |
| Jul 15, 2019 | Los Angeles Kings | Signed 2 years @ $700K AAV starting in 2019-20 | |
| Mar 27, 2017 | Los Angeles Kings | Signed to an entry level contract. |
Player Card(s)
URL: https://thestanleycap.com/cdn/player_cards/20252026/matt-roy-8478911.png
URL: https://thestanleycap.com/cdn/player_cards/20242025/matt-roy-8478911.png
URL: https://thestanleycap.com/cdn/player_cards/20232024/matt-roy-8478911.png
About Player Cards
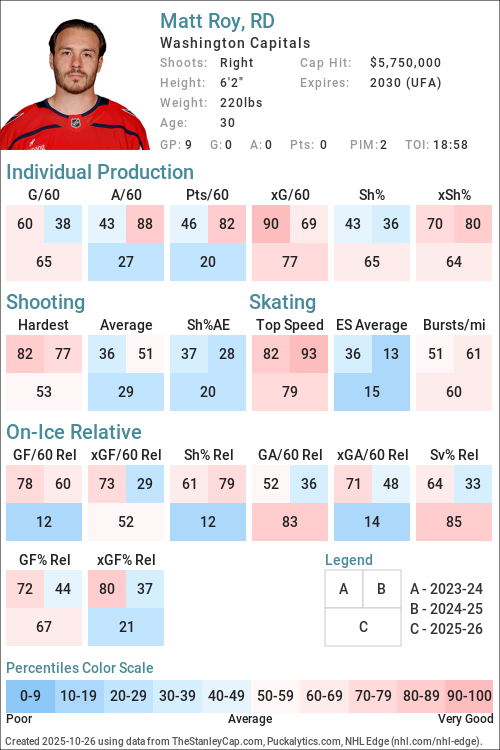
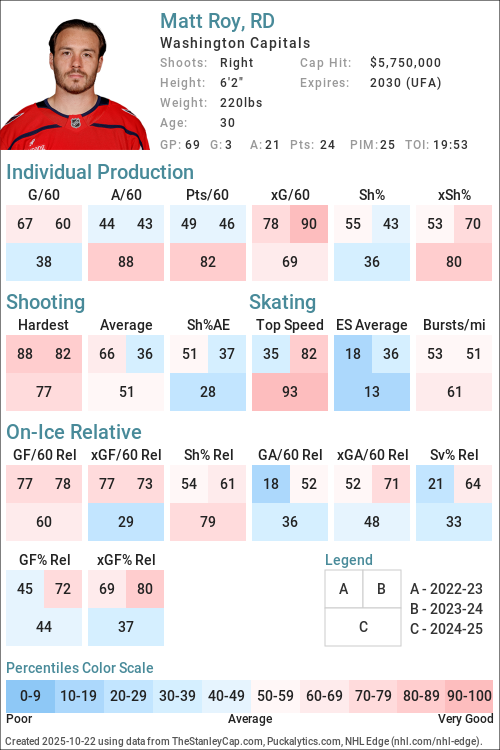
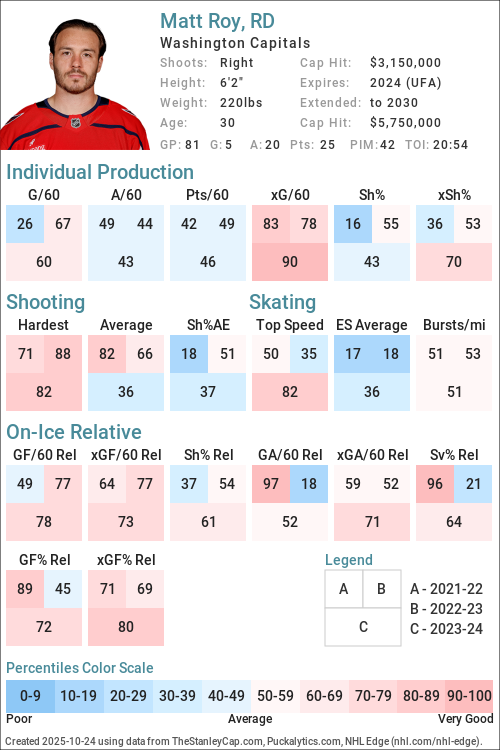
Player cards present an infographic of a players performance using a series of Player Archetypes developed for Puckalytics.com and TheStanleyCap.com. The boxes in the rink image show the archetype ratings for the season specified in the card while the graphs to the right show the five-year trends for those archetypes.
Except for Faceoffs, the values shown are the players z-score (standard deviation from the mean) for the specific metric used to calculate the archetype values. When calculating z-scores forwards were compared to forwards and defensemen were compared to defensemen. Positive values indicate the player is above average and shaded in blue, while negative values indicate the player is below average and shaded in pink. The five year trend charts show a range of -4.0 to 4.0.
The value shown for Faceoffs is the faceoff winning percentage rather than their z-score with winning percentages below 50 in pink shades and above 50 in blue shades.
All archetypes are 5v5 except 5v4 TOI, 4v5 TOI, Skating (even strength) and Faceoffs (all situations). Archetypes use regular season data only.
Archetypes Summary
- Sniper - Measures the to score above the expected goal rate.
- Rebound - Measures the percent of a players shot attempts that come from rebounds (forwards only).
- 5v4 TOI - Powerplay ice time, calculated as the percentage of his teams 5v4 ice time that the player was on the ice for.
- Shooter - Measures whether a players points come from shots (goals or assists on rebounds from his shots).
- Producer - Measures a players ability to produce goals and assists, adjusted for quality of teammates.
- Playmaker - Measures whether a players points come from passes.
- Drive - Measures a players ability to drive puck possession and generate shot attempts for his team.
- Rush - Measures the percent of a players shot attempts that come from rush plays
- Possession - An indicator of a players ability to improve his teams puck possession game.
- Faceoffs - Faceoff Winning Percentage (min. 75 faceoffs taken).
- 5v5 TOI - The percentage of his teams 5v5 TOI that the player was on the ice for.
- Suppress - Measures a players ability to suppress opponent puck possession and shot attempts against.
- Skating - An indicator of a players skating ability, or speed bursts above 20mph per mile skated.
- Defend - An indicator of a players ability to suppress shot quality against.
- 4v5 TOI - Penalty Kill ice time, calculated as the percentage of his teams 4v5 ice time that the player was on the ice for.
Data Sources
- Salary data is from TheStanleyCap.com
- Skating data is from NHL Edge
- Other statistics are from Puckalytics.com and derived from data from NHL.com
Terms of Use
You are free to use include player cards in written articles, share on social media, or on other public websites under the following conditions:
- You credit TheStanleyCap.com as the source and provide a link back to TheStanleyCap.com or this player page.
- You do not mass copy/duplicate/publish dozens or hundreds of player cards. A few, or a handful for a written article is fine. Be reasonable. Fair use rules apply.
- If you are a high-traffic website you must download and host the image(s) on your site rather than overload TheStanleyCap servers with traffic.
Note: Player cards will update daily throughout the season so if you want to include snapshot then you must download the image.
If you have any questions, send an e-mail to the e-mail address at the top of this page.
Read Introducing Player Archetypes on HockeyAnalysis.com for more details on archetype calculations.
Core Archetypes
| Season | Team(s) | GP | TOI | Producer | Playmaker | Shooter | Sniper | Rebound | Rush | Skating | Defend |
|---|---|---|---|---|---|---|---|---|---|---|---|
| 2018-19 | LAK | 25 | 0.05 | -0.21 | 0.33 | 1.28 | - | -1.03 | - | 0.17 | |
| 2019-20 | LAK | 70 | -0.71 | -0.72 | -0.51 | -0.39 | - | -0.27 | - | 0.77 | |
| 2020-21 | LAK | 44 | -0.57 | -0.53 | -0.35 | 0.23 | - | 0.24 | - | 1.32 | |
| 2021-22 | LAK | 67 | -0.33 | -0.14 | -0.60 | -0.98 | - | 0.17 | -0.24 | 1.65 | |
| 2022-23 | LAK | 82 | -0.32 | -0.49 | -0.03 | 0.14 | - | 0.76 | -0.17 | -0.75 | |
| 2023-24 | LAK | 81 | -0.45 | -0.49 | -0.29 | -0.47 | - | -0.05 | -0.25 | 0.28 | |
| 2024-25 | WSH | 69 | 0.73 | 1.30 | -0.45 | -0.56 | - | -0.68 | 0.03 | -0.39 | |
| 2025-26 | WSH | 79 | -0.56 | -0.35 | -0.69 | -0.60 | - | 0.25 | -0.16 | -0.09 |
Situational and Secondary Archetypes
| Season | Team(s) | GP | TOI | 5v5 TOI | 5v4 TOI | 4v5 TOI | Possession | Drive | Suppress | Faceoffs |
|---|---|---|---|---|---|---|---|---|---|---|
| 2018-19 | LAK | 25 | -0.91 | -1.57 | -0.08 | -0.35 | 1.09 | -2.11 | - | |
| 2019-20 | LAK | 70 | -0.17 | -1.72 | -0.40 | 2.02 | 1.21 | 1.82 | - | |
| 2020-21 | LAK | 44 | 0.02 | -1.24 | 0.08 | -1.61 | -0.65 | -1.50 | - | |
| 2021-22 | LAK | 67 | 0.45 | -0.87 | 0.37 | 0.84 | 0.92 | 0.40 | - | |
| 2022-23 | LAK | 82 | -0.08 | -1.37 | 0.10 | 0.32 | 1.11 | -0.62 | - | |
| 2023-24 | LAK | 81 | 0.59 | -1.32 | 0.96 | 0.47 | 1.09 | -0.36 | - | |
| 2024-25 | WSH | 69 | 0.37 | -1.36 | 0.08 | -1.00 | -0.90 | -0.55 | - | |
| 2025-26 | WSH | 79 | 0.62 | -1.40 | 0.84 | 0.33 | 0.20 | 0.32 | - |
5v5 Individual Stats
| Season | Team(s) | GP | TOI | G/60 | A/60 | Pts/60 | xG/60 | GAE/60 | Sh% | xSh% | Sh%AE | %SA Rush | %SA Reb. |
|---|---|---|---|---|---|---|---|---|---|---|---|---|---|
| 2018-19 | LAK | 25 | 374:46 | 0.32 | 0.64 | 0.96 | 0.19 | 0.13 | 6.25 | 3.80 | 2.45 | 0.00 | 3.85 |
| 2019-20 | LAK | 70 | 1114:34 | 0.11 | 0.54 | 0.65 | 0.16 | -0.05 | 1.96 | 2.87 | -0.91 | 0.68 | 2.70 |
| 2020-21 | LAK | 44 | 704:03 | 0.17 | 0.43 | 0.60 | 0.15 | 0.02 | 3.92 | 3.51 | 0.41 | 1.27 | 1.27 |
| 2021-22 | LAK | 67 | 1138:55 | 0.11 | 0.68 | 0.79 | 0.28 | -0.18 | 1.60 | 4.26 | -2.66 | 1.18 | 4.71 |
| 2022-23 | LAK | 82 | 1280:15 | 0.23 | 0.61 | 0.84 | 0.23 | 0.01 | 4.35 | 4.23 | 0.12 | 1.83 | 2.44 |
| 2023-24 | LAK | 81 | 1377:20 | 0.22 | 0.61 | 0.83 | 0.26 | -0.04 | 4.03 | 4.85 | -0.82 | 1.04 | 3.65 |
| 2024-25 | WSH | 69 | 1181:46 | 0.15 | 0.96 | 1.12 | 0.21 | -0.05 | 3.80 | 5.15 | -1.35 | 0.00 | 1.45 |
| 2025-26 | WSH | 79 | 1350:16 | 0.09 | 0.67 | 0.76 | 0.15 | -0.06 | 2.38 | 3.90 | -1.52 | 0.77 | 0.00 |
5v5 On Ice Stats
| Season | Team(s) | GP | TOI | SAF/60 | GF/60 | xGF/60 | SAA/60 | GA/60 | xGA/60 | GF% | xGF% | xGF Rel | xGA Rel | xGF% Rel |
|---|---|---|---|---|---|---|---|---|---|---|---|---|---|---|
| 2018-19 | LAK | 25 | 374:46 | 41.79 | 3.04 | 2.37 | 50.91 | 3.52 | 3.14 | 46.34 | 43.03 | 0.06 | 0.67 | -5.34 |
| 2019-20 | LAK | 70 | 1114:34 | 48.34 | 2.58 | 2.66 | 36.55 | 1.99 | 2.16 | 56.47 | 55.16 | 0.18 | -0.43 | 6.23 |
| 2020-21 | LAK | 44 | 704:03 | 36.65 | 1.87 | 2.02 | 44.23 | 2.22 | 2.61 | 45.83 | 43.65 | -0.20 | 0.16 | -3.94 |
| 2021-22 | LAK | 67 | 1138:55 | 48.68 | 2.42 | 2.92 | 37.09 | 1.74 | 2.43 | 58.23 | 54.56 | 0.11 | -0.03 | 1.19 |
| 2022-23 | LAK | 82 | 1280:15 | 46.77 | 2.81 | 2.89 | 39.09 | 2.67 | 2.36 | 51.28 | 55.06 | 0.24 | -0.02 | 2.37 |
| 2023-24 | LAK | 81 | 1377:20 | 48.35 | 2.79 | 2.70 | 38.55 | 2.13 | 2.12 | 56.64 | 55.95 | 0.19 | -0.07 | 2.63 |
| 2024-25 | WSH | 69 | 1181:46 | 38.99 | 2.79 | 2.39 | 40.41 | 2.49 | 2.45 | 52.88 | 49.41 | -0.23 | -0.02 | -2.08 |
| 2025-26 | WSH | 79 | 1350:16 | 41.37 | 2.44 | 2.54 | 39.64 | 2.22 | 2.68 | 52.38 | 48.62 | -0.29 | -0.03 | -2.40 |
NHL Edge Stats
| Skating | Shooting | Zone Time | |||||||||||
|---|---|---|---|---|---|---|---|---|---|---|---|---|---|
| Season | GP | Top Speed | Bursts>20/mi | Avg. Speed | Top Speed | Avg. Speed | %Long Range | %Mid Range | %High Danger | ES DZ% | ES NZ% | ES OZ% | |
| This table is for Basic and Premium subscribers only. To view please login to and/or subscribe to one of our subscription plans. | |||||||||||||
Legend
| Percentile 0-25 | Percentile 25-50 | Percentile 50-75 | Percentile 75-100 |
5v5 Defense Pairs
| Season | Teammate | Team | TOI | GF/60 | GA/60 | GF% | xGF/60 | xGA/60 | xGF% | xGF Rel | xGA Rel | xGF% Rel |
|---|
Glossary
| Type | Statistic | Definition |
|---|---|---|
| Individual | G/60 | Goals Against per 60 minutes. |
| Individual | A/60 | Assists per 60 minutes. |
| Individual | Pts/60 | Points per 60 minutes. |
| Individual | xG/60 | Expected Goals per 60 minutes. |
| Individual | GAE/60 | Goals Above Expected (G/60 - xG/60). |
| Individual | Sh% | Shooting Percentage. |
| Individual | xSh% | Expected Shooting Percentage. |
| Individual | Sh%AE | Shooting percentage above expected (Sh% - xSh%). |
| Individual | %SA Rush | Percentage of shot attempts determined to be on the rush. |
| Individual | %SA Reb. | Percentage of shot attempts determined to be from rebounds. |
| On Ice | SAF/60 | Shot Attempts For per 60 minutes. |
| On Ice | GF/60 | Goals For per 60 minutes. |
| On Ice | xGF/60 | Expected Goals For per 60 minutes. |
| On Ice | SAA/60 | Shot Attempts Against per 60 minutes (lower is better). |
| On Ice | GA/60 | Goals Against per 60 minutes (lower is better). |
| On Ice | xGA/60 | Expected Goals Against per 60 minutes (lower is better). |
| On Ice | GF% | Goals For Percentage = Goals For / (Goals For + Goals Against) |
| On Ice | xGF% | Expected Goals For Percentage = Expected Goals For / (Expected Goals For + Expected Goals Against) |
| On Ice | xGF Rel | xGF/60 when On Ice - xGF/60 when not On Ice. |
| On Ice | xGA Rel | xGA/60 when On Ice - xGA/60 when not On Ice (lower is better). |
| On Ice | xGF% Rel | xGF% when On Ice - xGF% when not On Ice. |
News and Opinions
-
Why is Matt Roy nicknamed ‘Cat’? RMNB investigates. at Russian Machine Never Breaks (Mon Jun 15, 2026)
-
Matt Roy: 2025-26 season review at Russian Machine Never Breaks (Mon Jun 8, 2026)
-
Logan Thompson and Matt Roy get votes for Lady Byng Trophy, Cole Caufield wins award at Russian Machine Never Breaks (Fri Jun 5, 2026)
-
Rink Roundtable: Closing the Book on 2025-26 at Japers Rink (Mon Apr 20, 2026)
-
Tom Wilson records career high 21 penalty minutes, helps spark Capitals to 7-4 victory after Brandon Tanev boards Matt Roy at Russian Machine Never Breaks (Fri Mar 27, 2026)
-
Cole Hutson practices with the Capitals for the first time, skates on a defense pair with Matt Roy at Russian Machine Never Breaks (Tue Mar 17, 2026)
-
Bruins beat Caps 3-2 in soul-destroying shootout at Russian Machine Never Breaks (Sat Mar 14, 2026)
-
Matt Roy to serve as an alternate captain for Capitals against Flyers: ‘Guys really respect him a lot with how he plays, how he leads by example’ at Russian Machine Never Breaks (Wed Mar 11, 2026)
-
Matt Roy and Hendrix Lapierre miss morning skate, Capitals unsure they’ll have enough healthy forwards for Maple Leafs game at Russian Machine Never Breaks (Thu Dec 18, 2025)
-
Jakob Chychrun and Matt Roy have combined to form a dominant defense pairing this season: ‘They’ve been very, very effective right from jump street’ at Russian Machine Never Breaks (Thu Nov 27, 2025)
-
Matt Roy sports massively swollen lip after taking Joel Armia shot to the face: ‘I hope you can’t notice’ at Russian Machine Never Breaks (Tue Nov 18, 2025)
-
Matt Roy and Declan Chisholm fully participate in Capitals practice after respective injury scares at Russian Machine Never Breaks (Tue Oct 7, 2025)
-
Matt Roy and Dylan McIlrath miss Capitals practice after suffering injuries in preseason finale against Blue Jackets at Russian Machine Never Breaks (Mon Oct 6, 2025)
-
Matt Roy and Dylan McIlrath suffer injuries in final preseason game that could keep them out ‘maybe a week, two weeks’ at Russian Machine Never Breaks (Sat Oct 4, 2025)
-
Martin Fehervary, Matt Roy, and Justin Sourdif begin first day of Capitals Training Camp in no-contact jerseys at Russian Machine Never Breaks (Thu Sep 18, 2025)
-
What if Matt Roy never left the Los Angeles Kings in free agency? at Rink Royalty (Thu Jul 31, 2025)
-
Logan Thompson and Matt Roy are first Capitals to join informal skates ahead of training camp at Russian Machine Never Breaks (Wed Jul 30, 2025)
-
Matt Roy quietly proved his worth in first season with Capitals at Stars and Sticks (Sun May 25, 2025)
Current Contract
Matt Roy signed a $34,500,000 6-year contract with the Washington Capitals and General Manager Brian MacLellan on July 1, 2024 with an AAV of $5,750,000. This contract will start in 2024-25 and end after the 2029-30 season. In the first season of the contract the cap hit was equivalent to 6.53% of the salary cap.
Standard Contract (UFA) ( ) (0 ratings)
Matt Roy signed a $9,450,000 3-year contract with the Los Angeles Kings and General Manager Rob Blake on March 21, 2021 with an AAV of $3,150,000. This contract will start in 2021-22 and end after the 2023-24 season. In the first season of the contract the cap hit was equivalent to 3.87% of the salary cap.
Standard Contract (RFA) ( ) (0 ratings)
| Season | Age* | Clause | Cap Hit | AAV | Perf. Bonus | Sign. Bonus | Salary | Compensation | Minors Salary | Status | |
|---|---|---|---|---|---|---|---|---|---|---|---|
| 2021-22 | 26 | $3,150,000 | $3,150,000 | - | - | $2,000,000 | $2,000,000 | $2,000,000 | RFA-arb | ||
| 2022-23 | 27 | $3,150,000 | $3,150,000 | - | - | $3,250,000 | $3,250,000 | $3,250,000 | UFA | ||
| 2023-24 | 28 | $3,150,000 | $3,150,000 | - | - | $4,200,000 | $4,200,000 | $4,200,000 | UFA | ||
| Total | - | - | $9,450,000 | $9,450,000 | $9,450,000 |
Matt Roy signed a $1,400,000 2-year contract with the Los Angeles Kings and General Manager Rob Blake on July 15, 2019 with an AAV of $700,000. This contract will start in 2019-20 and end after the 2020-21 season. In the first season of the contract the cap hit was equivalent to 0.86% of the salary cap.
Standard Contract (RFA) ( ) (0 ratings)
| Season | Age* | Clause | Cap Hit | AAV | Perf. Bonus | Sign. Bonus | Salary | Compensation | Minors Salary | Status | |
|---|---|---|---|---|---|---|---|---|---|---|---|
| 2019-20 | 24 | $700,000 | $700,000 | - | - | $700,000 | $700,000 | $200,000 | RFA-arb | ||
| 2020-21 | 25 | $700,000 | $700,000 | - | - | $700,000 | $700,000 | $700,000 | RFA-arb | ||
| Total | - | - | $1,400,000 | $1,400,000 | $900,000 |
Matt Roy signed a $1,667,500 2-year contract with the Los Angeles Kings and General Manager Dean Lombardi on March 27, 2017 with an AAV of $833,750. This contract will start in 2017-18 and end after the 2018-19 season. In the first season of the contract the cap hit was equivalent to 1.11% of the salary cap.
Entry Level Contract ( ) (0 ratings)
| Season | Age* | Clause | Cap Hit | AAV | Perf. Bonus | Sign. Bonus | Salary | Compensation | Minors Salary | Status | |
|---|---|---|---|---|---|---|---|---|---|---|---|
| 2017-18 | 22 | $833,750 | $925,000 | $182,500 | $92,500 | $650,000 | $742,500 | $70,000 | ELC | ||
| 2018-19 | 23 | $833,750 | $925,000 | - | $92,500 | $832,500 | $925,000 | $70,000 | ELC | ||
| Total | $182,500 | $185,000 | $1,482,500 | $1,667,500 | $140,000 |
Career Statistics
| Regular Season | Playoffs | |||||||||||||||||||
|---|---|---|---|---|---|---|---|---|---|---|---|---|---|---|---|---|---|---|---|---|
| Season | League | Team | GP | G | A | Pts | +/- | PIM | Shots | Sh% | TOI/G | GP | G | A | Pts | +/- | PIM | Shots | Sh% | TOI/G |
| 2009-10 | T1EBHL | Victory Honda Bantam Major AAA | 30 | 1 | 11 | 12 | 22 | |||||||||||||
| 2010-11 | T1EHL U16 | Victory Honda U16 | 35 | 3 | 10 | 13 | 24 | |||||||||||||
| 2011-12 | T1EHL | Det. V. Honda U18 | 37 | 1 | 8 | 9 | 28 | 7 | 2 | 2 | 5 | |||||||||
| 2012-13 | USHL | Indiana | 10 | 1 | 2 | 3 | -2 | 4 | 13 | 770.0 | ||||||||||
| 2012-13 | T1EHL | Det. V. Honda U18 | 41 | 12 | 21 | 33 | 62 | 4 | 2 | 2 | 4 | |||||||||
| 2013-14 | USHL | Indiana | 24 | 4 | 5 | 9 | +11 | 21 | 26 | 1,540.0 | 12 | 2 | 4 | 6 | +1 | 4 | 25 | 800.0 | ||
| 2014-15 | WCHA | Michigan Tech | 36 | 0 | 9 | 9 | 22 | |||||||||||||
| 2015-16 | NCAA | Michigan Tech | 37 | 7 | 13 | 20 | +24 | 37 | ||||||||||||
| 2015-16 | WCHA | Michigan Tech | 37 | 7 | 13 | 20 | +24 | 27 | 79 | |||||||||||
| 2016-17 | NCAA | Michigan Tech | 42 | 5 | 21 | 26 | +6 | 74 | ||||||||||||
| 2016-17 | AHL | Ontario Reign | 8 | 0 | 1 | 1 | +1 | 7 | 2 | -1 | 2 | |||||||||
| 2017-18 | AHL | Ontario Reign | 49 | 4 | 13 | 17 | +10 | 23 | 4 | 1 | 1 | 2 | +3 | |||||||
| 2018-19 | AHL | Ontario Reign | 45 | 8 | 21 | 29 | -21 | 17 | ||||||||||||
| 2018-19 | NHL | Los Angeles Kings | 25 | 2 | 4 | 6 | -1 | 8 | 34 | 5.9 | 17:08 | |||||||||
| 2019-20 | NHL | Los Angeles Kings | 70 | 4 | 14 | 18 | +16 | 10 | 112 | 3.6 | 18:07 | |||||||||
| 2020-21 | NHL | Los Angeles Kings | 44 | 2 | 8 | 10 | 8 | 57 | 3.5 | 19:15 | ||||||||||
| 2020-21 | WC | USA | 8 | 0 | 1 | 1 | 4 | |||||||||||||
| 2021-22 | NHL | Los Angeles Kings | 67 | 2 | 19 | 21 | +23 | 28 | 153 | 1.3 | 20:59 | 7 | 1 | 1 | -3 | 14 | 0.0 | 20:54 | ||
| 2022-23 | NHL | Los Angeles Kings | 82 | 9 | 17 | 26 | +8 | 22 | 135 | 6.7 | 18:47 | 6 | 1 | 2 | 3 | +4 | 8 | 12.5 | 21:36 | |
| 2023-24 | NHL | Los Angeles Kings | 81 | 5 | 20 | 25 | +21 | 42 | 135 | 3.7 | 20:54 | 5 | 2 | 2 | +1 | 2 | 5 | 0.0 | 19:30 | |
| 2024-25 | NHL | Washington Capitals | 69 | 3 | 21 | 24 | +18 | 25 | 84 | 3.6 | 19:53 | 10 | 2 | 2 | -1 | 2 | 7 | 0.0 | 23:52 | |
| 2025-26 | NHL | Washington Capitals | 79 | 2 | 17 | 19 | +18 | 12 | 94 | 2.1 | 20:37 | |||||||||
| NHL Career | 517 | 29 | 120 | 149 | +103 | 155 | 804 | 3.6 | 19:42 | 28 | 1 | 7 | 8 | +1 | 4 | 34 | 2.9 | 21:52 | ||