
 Matt Boldy
| Position | Right Wing / Left Wing | Current Team | Minnesota Wild |
| Shoots | Left | Current Contract | 7 years ($7.0M CapHit) |
| Height | 6'2" | Expires | 2029-30 |
| Weight (lbs) | 201 | Expiry Age (Jun 30) | 29 |
| Age (DOB) | 25 (Apr 5, 2001) | Expiry Status | UFA |
| Drafted | 2019, Round 1, Overall 12 (MIN) |
| Date | Team | Transaction | |
|---|---|---|---|
| Jan 24, 2026 | Minnesota Wild | Activated from IR | |
| Jan 16, 2026 | Minnesota Wild | Placed on IR | |
| Jan 16, 2023 | Minnesota Wild | Signed 7 years @ $7.000M AAV starting in 2023-24 | |
| Apr 1, 2021 | Minnesota Wild | Signed to an entry level contract. |
Player Card(s)
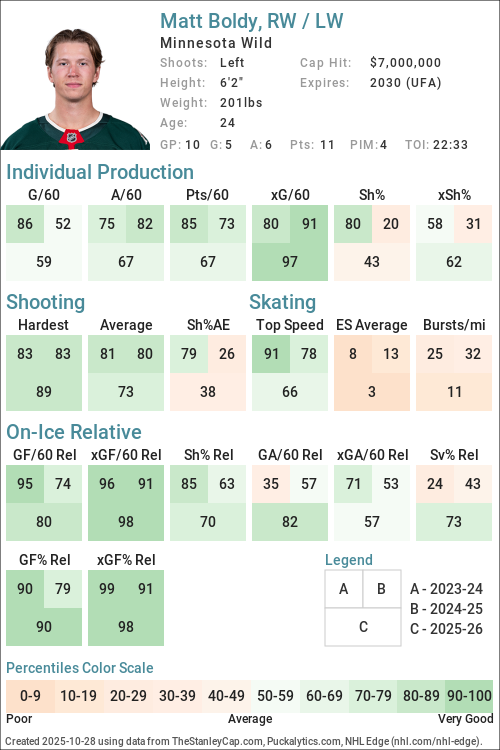
URL: https://thestanleycap.com/cdn/player_cards/20252026/matt-boldy-8481557.png
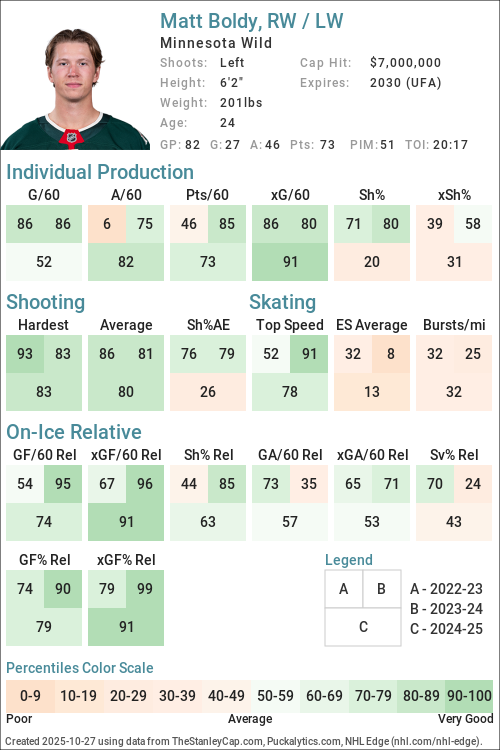
URL: https://thestanleycap.com/cdn/player_cards/20242025/matt-boldy-8481557.png
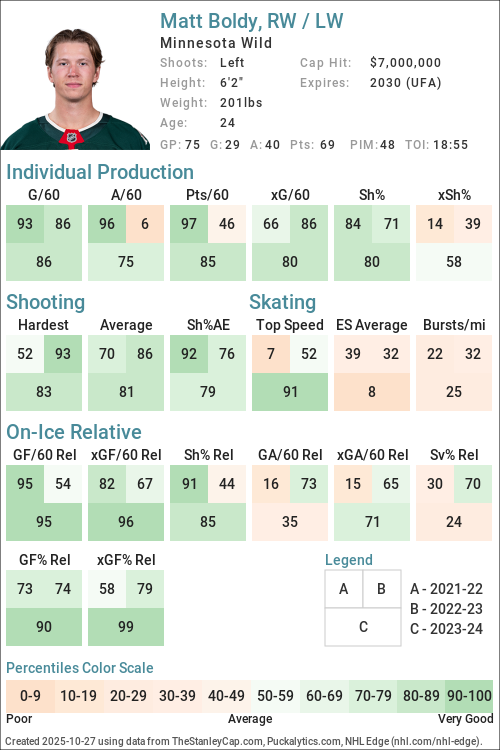
URL: https://thestanleycap.com/cdn/player_cards/20232024/matt-boldy-8481557.png
About Player Cards
Player cards present an infographic of a players performance using a series of Player Archetypes developed for Puckalytics.com and TheStanleyCap.com. The boxes in the rink image show the archetype ratings for the season specified in the card while the graphs to the right show the five-year trends for those archetypes.
Except for Faceoffs, the values shown are the players z-score (standard deviation from the mean) for the specific metric used to calculate the archetype values. When calculating z-scores forwards were compared to forwards and defensemen were compared to defensemen. Positive values indicate the player is above average and shaded in blue, while negative values indicate the player is below average and shaded in pink. The five year trend charts show a range of -4.0 to 4.0.
The value shown for Faceoffs is the faceoff winning percentage rather than their z-score with winning percentages below 50 in pink shades and above 50 in blue shades.
All archetypes are 5v5 except 5v4 TOI, 4v5 TOI, Skating (even strength) and Faceoffs (all situations). Archetypes use regular season data only.
Archetypes Summary
- Sniper - Measures the to score above the expected goal rate.
- Rebound - Measures the percent of a players shot attempts that come from rebounds (forwards only).
- 5v4 TOI - Powerplay ice time, calculated as the percentage of his teams 5v4 ice time that the player was on the ice for.
- Shooter - Measures whether a players points come from shots (goals or assists on rebounds from his shots).
- Producer - Measures a players ability to produce goals and assists, adjusted for quality of teammates.
- Playmaker - Measures whether a players points come from passes.
- Drive - Measures a players ability to drive puck possession and generate shot attempts for his team.
- Rush - Measures the percent of a players shot attempts that come from rush plays
- Possession - An indicator of a players ability to improve his teams puck possession game.
- Faceoffs - Faceoff Winning Percentage (min. 75 faceoffs taken).
- 5v5 TOI - The percentage of his teams 5v5 TOI that the player was on the ice for.
- Suppress - Measures a players ability to suppress opponent puck possession and shot attempts against.
- Skating - An indicator of a players skating ability, or speed bursts above 20mph per mile skated.
- Defend - An indicator of a players ability to suppress shot quality against.
- 4v5 TOI - Penalty Kill ice time, calculated as the percentage of his teams 4v5 ice time that the player was on the ice for.
Data Sources
- Salary data is from TheStanleyCap.com
- Skating data is from NHL Edge
- Other statistics are from Puckalytics.com and derived from data from NHL.com
Terms of Use
You are free to use include player cards in written articles, share on social media, or on other public websites under the following conditions:
- You credit TheStanleyCap.com as the source and provide a link back to TheStanleyCap.com or this player page.
- You do not mass copy/duplicate/publish dozens or hundreds of player cards. A few, or a handful for a written article is fine. Be reasonable. Fair use rules apply.
- If you are a high-traffic website you must download and host the image(s) on your site rather than overload TheStanleyCap servers with traffic.
Note: Player cards will update daily throughout the season so if you want to include snapshot then you must download the image.
If you have any questions, send an e-mail to the e-mail address at the top of this page.
Read Introducing Player Archetypes on HockeyAnalysis.com for more details on archetype calculations.
Core Archetypes
| Season | Team(s) | GP | TOI | Producer | Playmaker | Shooter | Sniper | Rebound | Rush | Skating | Defend |
|---|---|---|---|---|---|---|---|---|---|---|---|
| 2021-22 | MIN | 47 | 1.95 | 1.85 | 0.80 | 1.64 | -1.31 | -0.66 | -0.73 | -0.52 | |
| 2022-23 | MIN | 81 | -0.06 | -1.29 | 1.87 | 0.59 | -0.98 | -0.86 | -0.59 | 0.49 | |
| 2023-24 | MIN | 75 | 0.87 | 0.32 | 0.70 | 0.94 | -0.01 | -0.18 | -0.68 | -0.63 | |
| 2024-25 | MIN | 82 | 0.92 | 0.80 | 0.17 | -0.78 | -0.61 | -0.07 | -0.58 | -0.16 | |
| 2025-26 | MIN | 76 | 1.20 | -0.20 | 1.90 | 0.96 | -1.22 | -0.34 | -0.62 | 0.23 |
Situational and Secondary Archetypes
| Season | Team(s) | GP | TOI | 5v5 TOI | 5v4 TOI | 4v5 TOI | Possession | Drive | Suppress | Faceoffs |
|---|---|---|---|---|---|---|---|---|---|---|
| 2021-22 | MIN | 47 | 0.14 | 0.35 | -2.00 | -0.15 | 0.67 | -1.34 | - | |
| 2022-23 | MIN | 81 | 0.70 | 1.59 | -1.73 | 0.86 | 0.65 | 0.47 | 54.6 | |
| 2023-24 | MIN | 75 | 1.05 | 1.45 | -1.86 | 1.69 | 1.72 | 0.35 | 42.0 | |
| 2024-25 | MIN | 82 | 1.48 | 1.47 | -1.42 | 1.78 | 1.36 | 1.01 | 46.4 | |
| 2025-26 | MIN | 76 | 0.69 | 1.42 | 0.94 | 0.99 | 1.19 | -0.02 | 44.4 |
5v5 Individual Stats
| Season | Team(s) | GP | TOI | G/60 | A/60 | Pts/60 | xG/60 | GAE/60 | Sh% | xSh% | Sh%AE | %SA Rush | %SA Reb. |
|---|---|---|---|---|---|---|---|---|---|---|---|---|---|
| 2021-22 | MIN | 47 | 571:49 | 1.26 | 1.78 | 3.04 | 0.74 | 0.52 | 14.29 | 8.42 | 5.87 | 2.73 | 2.73 |
| 2022-23 | MIN | 81 | 1063:11 | 1.13 | 0.45 | 1.58 | 0.98 | 0.15 | 12.50 | 10.88 | 1.62 | 2.07 | 4.15 |
| 2023-24 | MIN | 75 | 1032:22 | 1.05 | 1.16 | 2.21 | 0.77 | 0.28 | 13.43 | 9.83 | 3.61 | 3.50 | 8.00 |
| 2024-25 | MIN | 82 | 1250:22 | 0.67 | 1.20 | 1.87 | 0.95 | -0.27 | 7.49 | 10.54 | -3.06 | 2.33 | 5.65 |
| 2025-26 | MIN | 76 | 1029:17 | 1.22 | 1.05 | 2.27 | 0.92 | 0.30 | 13.29 | 10.01 | 3.28 | 2.10 | 4.20 |
5v5 On Ice Stats
| Season | Team(s) | GP | TOI | SAF/60 | GF/60 | xGF/60 | SAA/60 | GA/60 | xGA/60 | GF% | xGF% | xGF Rel | xGA Rel | xGF% Rel |
|---|---|---|---|---|---|---|---|---|---|---|---|---|---|---|
| 2021-22 | MIN | 47 | 571:49 | 45.64 | 4.30 | 2.91 | 42.71 | 2.52 | 2.25 | 63.08 | 56.43 | 0.47 | 0.24 | 1.51 |
| 2022-23 | MIN | 81 | 1063:11 | 43.85 | 2.26 | 2.58 | 40.29 | 1.86 | 2.34 | 54.79 | 52.40 | 0.18 | -0.18 | 3.61 |
| 2023-24 | MIN | 75 | 1032:22 | 46.90 | 3.25 | 2.76 | 39.29 | 2.56 | 2.08 | 56.00 | 57.08 | 0.71 | -0.10 | 8.56 |
| 2024-25 | MIN | 82 | 1250:22 | 43.96 | 2.40 | 2.56 | 39.54 | 2.11 | 2.23 | 53.19 | 53.37 | 0.65 | -0.04 | 7.71 |
| 2025-26 | MIN | 76 | 1029:17 | 45.00 | 3.15 | 2.77 | 42.90 | 2.10 | 2.75 | 60.00 | 50.15 | 0.29 | 0.20 | 0.91 |
NHL Edge Stats
| Skating | Shooting | Zone Time | |||||||||||
|---|---|---|---|---|---|---|---|---|---|---|---|---|---|
| Season | GP | Top Speed | Bursts>20/mi | Avg. Speed | Top Speed | Avg. Speed | %Long Range | %Mid Range | %High Danger | ES DZ% | ES NZ% | ES OZ% | |
| This table is for Basic and Premium subscribers only. To view please login to and/or subscribe to one of our subscription plans. | |||||||||||||
Legend
| Percentile 0-25 | Percentile 25-50 | Percentile 50-75 | Percentile 75-100 |
5v5 Lines
| Season | Teammate | Teammate | Team | TOI | GF/60 | GA/60 | GF% | xGF/60 | xGA/60 | xGF% | xGF Rel | xGA Rel | xGF% Rel |
|---|
Glossary
| Type | Statistic | Definition |
|---|---|---|
| Individual | G/60 | Goals Against per 60 minutes. |
| Individual | A/60 | Assists per 60 minutes. |
| Individual | Pts/60 | Points per 60 minutes. |
| Individual | xG/60 | Expected Goals per 60 minutes. |
| Individual | GAE/60 | Goals Above Expected (G/60 - xG/60). |
| Individual | Sh% | Shooting Percentage. |
| Individual | xSh% | Expected Shooting Percentage. |
| Individual | Sh%AE | Shooting percentage above expected (Sh% - xSh%). |
| Individual | %SA Rush | Percentage of shot attempts determined to be on the rush. |
| Individual | %SA Reb. | Percentage of shot attempts determined to be from rebounds. |
| On Ice | SAF/60 | Shot Attempts For per 60 minutes. |
| On Ice | GF/60 | Goals For per 60 minutes. |
| On Ice | xGF/60 | Expected Goals For per 60 minutes. |
| On Ice | SAA/60 | Shot Attempts Against per 60 minutes (lower is better). |
| On Ice | GA/60 | Goals Against per 60 minutes (lower is better). |
| On Ice | xGA/60 | Expected Goals Against per 60 minutes (lower is better). |
| On Ice | GF% | Goals For Percentage = Goals For / (Goals For + Goals Against) |
| On Ice | xGF% | Expected Goals For Percentage = Expected Goals For / (Expected Goals For + Expected Goals Against) |
| On Ice | xGF Rel | xGF/60 when On Ice - xGF/60 when not On Ice. |
| On Ice | xGA Rel | xGA/60 when On Ice - xGA/60 when not On Ice (lower is better). |
| On Ice | xGF% Rel | xGF% when On Ice - xGF% when not On Ice. |
News and Opinions
-
Wild’s best contract gives them a massive advantage in their championship window at Gone Puck Wild (Fri Jul 24, 2026)
-
Wild fans should get used to Matt Boldy in trade rumors at Gone Puck Wild (Fri Jul 10, 2026)
-
Matt Boldy Has Become Indispensible To the Wild at Hockey Wilderness (Wed Jul 8, 2026)
-
NHL Rumor Mill – July 3, 2026 at Spectors Hockey (Fri Jul 3, 2026)
-
Wild need to pivot off Dylan Larkin after Red Wings absurd asking price at Gone Puck Wild (Wed Jul 1, 2026)
-
Who'd Say No To A Matthews-For-Boldy Blockbuster? at Hockey Wilderness (Fri May 22, 2026)
-
Kaprizov and Boldy’s Lack Of Playoff Production Is A Structural Issue at Hockey Wilderness (Thu May 21, 2026)
-
2026 Elimination Eval: Minnesota Wild at Blue Shirt Banter (Thu May 14, 2026)
-
The Wraparound: Will Matt Boldy Keep The Minnesota Wild's Season Alive? at The Hockey News (Tue May 12, 2026)
-
Matt Boldy's disappearing act is Wild's biggest problem heading into Game 5 at Gone Puck Wild (Tue May 12, 2026)
-
Avalanche vs Wild Prediction, Picks & Odds for Saturday's NHL Playoffs Game 3 at Yahoo Sports NHL (Fri May 8, 2026)
-
The Wild's Big Three Must Carry Them Through the Second Round at Hockey Wilderness (Tue May 5, 2026)
-
NHL Player Props & Best Bets for Today, May 3: Fortune Favors the Boldy at Yahoo Sports NHL (Sun May 3, 2026)
-
NHL 26 Predicts Avalanche Cruise Past Wild in Just Five Games at Yahoo Sports NHL (Fri May 1, 2026)
-
P.K. Subban Was Right: Matt Boldy Is A Dog On A Bone at Hockey Wilderness (Wed Apr 29, 2026)
-
Matt Boldy and Wild go home with chance to clinch series after beating Stars 4-2 in Game 5 at Yahoo Sports NHL (Wed Apr 29, 2026)
-
Matt Boldy and Wild go home with chance to clinch series after beating Stars 4-2 in Game 5 at NBC Sports (Wed Apr 29, 2026)
-
Matt Boldy and Wild go home with chance to clinch series after beating Stars 3-1 in Game 5 at Yahoo Sports NHL (Wed Apr 29, 2026)
-
Wild vs Stars Prediction, Picks & Odds for Tuesday's NHL Playoffs Game 5 at Yahoo Sports NHL (Tue Apr 28, 2026)
-
Marcus Foligno dropped the mic with quote about Matt Boldy's Game 4 overtime goal at Gone Puck Wild (Mon Apr 27, 2026)
-
Boldy steps up for the Wild against the Stars with a 'big-man game' to go with his prolific scoring at Yahoo Sports NHL (Mon Apr 27, 2026)
-
Wild Week Ahead: Schedule & Storylines – Injuries, Wallstedt & Boldy, and Power Play Struggles at The Hockey Writers (Mon Apr 27, 2026)
-
Slow motion angle of Matt Boldy's wild overtime in Game 4 somehow makes it even more epic at Gone Puck Wild (Sun Apr 26, 2026)
-
Boldy’s deflection late in 1st OT lifts Wild past Stars 3-2 to tie series at 2 at NBC Sports (Sat Apr 25, 2026)
-
The Mats Zuccarello Replacement Was Staring Us In the Face at Hockey Wilderness (Sat Apr 25, 2026)
-
Game 3 Highlighted Some Of the Wild’s Roster Flaws at Hockey Wilderness (Thu Apr 23, 2026)
-
NHL Must Address Jamie Benn After String of Dangerous, Uncalled Plays at Yahoo Sports NHL (Thu Apr 23, 2026)
-
Wild's Game 3 Loss Should Not Erase Insane Matt Boldy Play at Hockey Wilderness (Thu Apr 23, 2026)
-
Henrik Lundqvist argues Jamie Benn's hit on Matt Boldy was intentionally dirty at Gone Puck Wild (Thu Apr 23, 2026)
-
Wild's Boldy misses time in 1st period after face-planting from hit to head by Stars' Benn at Yahoo Sports NHL (Thu Apr 23, 2026)
-
How Did Joel Eriksson Ek Score Two Power Play Goals In Game 1? at Hockey Wilderness (Mon Apr 20, 2026)
-
Matt Boldy Is Solidifying His Reputation As A Game-Breaker In the Playoffs at Hockey Wilderness (Mon Apr 20, 2026)
-
Kaprizov and Boldy Give The Wild Built A Sustainable Offensive Foundation at Hockey Wilderness (Mon Apr 6, 2026)
-
Kaprizov and Boldy Give The Wild A Sustainable Offensive Foundation at Hockey Wilderness (Mon Apr 6, 2026)
-
Kirill Kaprizov and Matt Boldy made insane NHL history in Wild clinching win over Canucks at Gone Puck Wild (Fri Apr 3, 2026)
-
The Stanchies: Canucks clinch last overall in loss to Quinn Hughes’ Wild at Canucks Army (Fri Apr 3, 2026)
-
3 Takeaways From the Wild’s 5-2 Win Over the Canucks at The Hockey Writers (Fri Apr 3, 2026)
-
Canucks Suffer 5-2 Loss To The Minnesota Wild In First Game Against Quinn Hughes at Yahoo Sports NHL (Thu Apr 2, 2026)
-
Instant Reaction: Canucks start hot but fizzle out in 5-2 loss to Wild at Canucks Army (Thu Apr 2, 2026)
-
Could Matt Boldy and Clayton Keller influence Alex Tuch's future in Buffalo? at Sabres Noise (Sun Mar 22, 2026)
-
Matt Boldy Is Officially On 50/50 Watch at Hockey Wilderness (Thu Mar 12, 2026)
-
Wild Week Ahead: Schedule & Storylines – Trade Deadline Recapped & Boldy on Fire at The Hockey Writers (Mon Mar 9, 2026)
-
NHL Player Props & Best Bets for Today, March 6: Johnston Shines for Stars at Yahoo Sports NHL (Fri Mar 6, 2026)
-
NHL Player Props & Best Bets for Today, March 3: Hooray for Necas at Yahoo Sports NHL (Tue Mar 3, 2026)
-
Wild's Matt Boldy Wins Back-To-Back NHL Three Stars Of The Week at Yahoo Sports NHL (Tue Mar 3, 2026)
-
U.S. Olympian Matt Boldy has 2 goals and 2 assists in Wild's 5-2 win over Avs at Yahoo Sports NHL (Fri Feb 27, 2026)
-
Wild coach addresses timeline regarding Hughes, Faber, and Boldy and the State of the Union at Gone Puck Wild (Tue Feb 24, 2026)
-
Matt Boldy, Brock Faber shut down Bill Guerin haters after Team USA wins gold at Gone Puck Wild (Tue Feb 24, 2026)
-
Team USA hockey finally triumphs and other takeaways from gold-medal win over Canada at Boston.com (Sun Feb 22, 2026)
-
Team USA writes a new chapter and other takeaways from gold-medal triumph over Canada at Boston.com (Sun Feb 22, 2026)
-
Olympic Hockey Day 10 Recap: Jack Hughes Golden Goal Gives Team USA First Gold Medal Since 1980 at Blue Shirt Banter (Sun Feb 22, 2026)
-
Matt Boldy opens scoring for Team USA in Olympic gold-medal game at Gone Puck Wild (Sun Feb 22, 2026)
-
Minnesota Wild Olympians Making an Impact Playing for Gold on Team USA at The Hockey Writers (Sat Feb 21, 2026)
-
This Wild Team Feels Different Heading Into the Stretch Run at Hockey Wilderness (Thu Feb 19, 2026)
-
Olympics hockey overtime, shootout rules explained at Yahoo Sports NHL (Wed Feb 18, 2026)
-
Olympics hockey overtime, shootout rules explained at Yahoo Sports NHL (Tue Feb 17, 2026)
-
Rangers fans will love which player Liam Greentree models his game after at Blue Line Station (Fri Feb 13, 2026)
-
Auston Matthews remains with Jake Guentzel, Matt Boldy at USA’s practice at The Leafs Nation (Wed Feb 11, 2026)
-
Matt Boldy Can Stake His Claim To Being the USA's Best Winger at Hockey Wilderness (Sun Feb 8, 2026)
-
A Minnesota Wild Fan’s Guide to the 2026 Winter Olympics at The Hockey Writers (Sun Feb 8, 2026)
-
3 Takeaways From the Wild’s 6-5 Overtime Win Over the Predators at The Hockey Writers (Thu Feb 5, 2026)
-
NHL Morning Recap – February 5, 2026 at The Hockey Writers (Thu Feb 5, 2026)
-
Boldy nets early hat trick and Spurgeon scores in OT as Wild beat Predators 6-5 at Yahoo Sports NHL (Thu Feb 5, 2026)
-
What Have We Learned About the Quinn Hughes Wild Through 20 Games? at Hockey Wilderness (Sun Jan 25, 2026)
-
Robert Thomas Should Be Guerin's Primary Deadline Target at Hockey Wilderness (Thu Jan 22, 2026)
-
Matt Boldy's Contract Is the Minnesota Wild's True Stanley Cup Window at Hockey Wilderness (Thu Jan 22, 2026)
-
What Kind Of Impact Would Vincent Trocheck Make On the Wild? at Hockey Wilderness (Wed Jan 21, 2026)
-
Is the Wild’s Solution For A Top Six Center Already On the Team? at Hockey Wilderness (Wed Jan 14, 2026)
-
Matt Boldy's Refined Approach Is Creating The Lost Consistency In His Game at Hockey Wilderness (Tue Dec 30, 2025)
-
Matt Boldy Is Closing the Gap Between Himself And Kirill Kaprizov at Hockey Wilderness (Mon Dec 29, 2025)
-
Open Thread: Colorado Avalanche @ Minnesota Wild (4:00 P.M.) at Mile High Hockey (Sun Dec 21, 2025)
-
Preview: A Quinn-tessential Matchup in Minnesota at Mile High Hockey (Sun Dec 21, 2025)
-
Kirill Kaprizov And Matt Boldy Eye History As Wild Face Oilers at Yahoo Sports NHL (Sat Dec 20, 2025)
-
Minnesota Wild’s 3 Stars for November at The Hockey Writers (Tue Dec 2, 2025)
-
Matt Boldy Is Already Ahead Of Schedule at Hockey Wilderness (Fri Nov 28, 2025)
-
Matt Boldy's Defense Is Gaining As Much Attention As His Offense at Hockey Wilderness (Fri Nov 21, 2025)
-
Is Jordan Kyrou A Big Enough Fish For the Wild To Reel In? at Hockey Wilderness (Wed Nov 12, 2025)
-
Matt Boldy Is Shooting His Shot at Hockey Wilderness (Sat Oct 25, 2025)
-
Owen Tippett Should Top the Wild’s Christmas List at Hockey Wilderness (Mon Oct 20, 2025)
-
This Is What Matt Boldy Taking 'The Leap' Looks Like at Hockey Wilderness (Mon Oct 13, 2025)
-
Gameday #2: Blue Jackets and Wild celebrate Year 25 at Jackets Cannon (Sat Oct 11, 2025)
-
Central Division Preview: 3 burning questions for the Minnesota Wild at Blackhawk Up (Sat Oct 4, 2025)
-
What Should the Wild Do To Optimize Their Second Line? at Hockey Wilderness (Thu Oct 2, 2025)
-
Marco Rossi Looks Ready To Take Another Step at Hockey Wilderness (Sat Sep 27, 2025)
-
2025-26 Is Shaping Up To Be Matt Boldy's Defining Season at Hockey Wilderness (Wed Sep 24, 2025)
-
Matt Boldy's Potential is the Wild's Best Pitch to Keep Kirill Kaprizov at Hockey Wilderness (Wed Sep 17, 2025)
-
What Would A Post-Kaprizov Minnesota Wild Team Look Like? at Hockey Wilderness (Sun Sep 14, 2025)
-
Wild’s Boldy & Faber Invited to Team USA’s Olympic Orientation Camp at The Hockey Writers (Wed Aug 20, 2025)
-
Which Wild Players Would Go On A McDavid-Draisaitl "Friendmoon"? at Hockey Wilderness (Sun Aug 10, 2025)
-
Minnesota Wild's Matt Boldy Ranked As Top-20 Winger In NHL at Yahoo Sports NHL (Thu Aug 7, 2025)
-
Can Marco Rossi Build On His Playoff Performance? at Hockey Wilderness (Fri Aug 1, 2025)
-
Matt Boldy's Contract Only Gets Better From Here at Hockey Wilderness (Wed Jul 30, 2025)
-
Wild 2024-25 Report Cards: Matt Boldy at The Hockey Writers (Tue Jul 22, 2025)
-
Can Matt Boldy Buck the NHL Aging Curve and Become A Superstar? at Hockey Wilderness (Tue Jul 22, 2025)
-
Wild's Matt Boldy Joins Some Elite Company In NHL at Yahoo Sports NHL (Sat Jul 19, 2025)
-
William Moore's startling claim should excite Bruins fans for the future at Causway Crowd (Sat Jun 28, 2025)
-
Boldy must continue to step up if the Wild want to upset Vegas at Gone Puck Wild (Sat Apr 26, 2025)
-
The State of Hockey... In the State of Hockey (Week One Edition) at Gone Puck Wild (Tue Oct 15, 2024)
Current Contract
Matt Boldy signed a $49,000,000 7-year contract with the Minnesota Wild and General Manager Bill Guerin on January 16, 2023 with an AAV of $7,000,000. This contract will start in 2023-24 and end after the 2029-30 season. In the first season of the contract the cap hit was equivalent to 8.38% of the salary cap.
Standard Contract (RFA) ( ) (0 ratings)
Matt Boldy signed a $2,642,500 3-year contract with the Minnesota Wild and General Manager Bill Guerin on April 1, 2021 with an AAV of $880,833. This contract will start in 2020-21 and end after the 2022-23 season. In the first season of the contract the cap hit was equivalent to 1.08% of the salary cap.
Entry Level Contract ( ) (0 ratings)
| Season | Age* | Clause | Cap Hit | AAV | Perf. Bonus | Sign. Bonus | Salary | Compensation | Minors Salary | Status | |
|---|---|---|---|---|---|---|---|---|---|---|---|
| 2020-21 | 19 | $880,833 | $1,325,000 | $132,500 | $92,500 | $700,000 | $792,500 | $70,000 | ELC | ||
| 2021-22 | 20 | $880,833 | $1,325,000 | $600,000 | $92,500 | $832,500 | $925,000 | $70,000 | ELC | ||
| 2022-23 | 21 | $880,833 | $1,325,000 | $600,000 | $92,500 | $832,500 | $925,000 | $70,000 | ELC | ||
| Total | $1,332,500 | $277,500 | $2,365,000 | $2,642,500 | $210,000 |
Career Statistics
| Regular Season | Playoffs | |||||||||||||||||||
|---|---|---|---|---|---|---|---|---|---|---|---|---|---|---|---|---|---|---|---|---|
| Season | League | Team | GP | G | A | Pts | +/- | PIM | Shots | Sh% | TOI/G | GP | G | A | Pts | +/- | PIM | Shots | Sh% | TOI/G |
| 2010-11 | Brick Invitational | Boston Jr. Bruins | 6 | 3 | 2 | 5 | 2 | 6 | 3 | 2 | 5 | 2 | ||||||||
| 2013-14 | QC Int PW | Long Island Stars | 4 | 4 | 1 | 5 | 4 | |||||||||||||
| 2013-14 | QC Int PW | Long Island Stars (PW) | 4 | 4 | 1 | 5 | 4 | |||||||||||||
| 2015-16 | WSI U15 | Northeast Elite U15 | 2 | 0 | 0 | 0 | ||||||||||||||
| 2016-17 | USHS-Prep | Dexter Southfield School | 29 | 13 | 13 | 26 | ||||||||||||||
| 2016-17 | MHSL U16 | Cape Cod Whalers 16U AAA | 13 | 15 | 10 | 25 | 2 | |||||||||||||
| 2016-17 | USA-S15 | Team Columbia | 3 | 0 | 0 | 0 | ||||||||||||||
| 2017-18 | USDP | U.S. National U17 Team | 61 | 29 | 47 | 76 | +24 | 30 | ||||||||||||
| 2017-18 | WHC-17 | USA U17 | 6 | 3 | 6 | 9 | 2 | |||||||||||||
| 2017-18 | USDP | U.S. National U18 Team | 1 | 0 | 0 | 0 | +1 | |||||||||||||
| 2017-18 | USHL | USNTDP Juniors | 34 | 12 | 23 | 35 | +9 | 14 | 8 | 4 | 4 | 8 | -1 | 8 | ||||||
| 2018-19 | NTDP | U.S. National U18 Team | 64 | 33 | 48 | 81 | +27 | 28 | ||||||||||||
| 2018-19 | USHL | USNTDP Juniors | 28 | 17 | 26 | 43 | +14 | 16 | ||||||||||||
| 2018-19 | WJC-18 | USA U18 | 7 | 3 | 9 | 12 | +6 | |||||||||||||
| 2019-20 | NCAA | Boston College | 34 | 9 | 17 | 26 | +16 | 8 | ||||||||||||
| 2020-21 | NCAA | Boston College | 22 | 11 | 20 | 31 | +15 | 4 | ||||||||||||
| 2020-21 | AHL | Iowa Wild | 14 | 6 | 12 | 18 | +5 | 2 | ||||||||||||
| 2020-21 | WJC-20 | USA U20 | 7 | 5 | 2 | 7 | +3 | 2 | ||||||||||||
| 2021-22 | AHL | Iowa Wild | 10 | 4 | 6 | 10 | 6 | |||||||||||||
| 2021-22 | WC | USA | 5 | 1 | 2 | 3 | 2 | |||||||||||||
| 2021-22 | NHL | Minnesota Wild | 47 | 15 | 24 | 39 | +17 | 10 | 113 | 13.3 | 15:23 | 6 | 1 | 1 | -1 | 4 | 13 | 7.7 | 13:19 | |
| 2022-23 | NHL | Minnesota Wild | 81 | 31 | 32 | 63 | +1 | 39 | 255 | 12.2 | 18:30 | 6 | 3 | 3 | -5 | 4 | 24 | 0.0 | 20:53 | |
| 2023-24 | NHL | Minnesota Wild | 75 | 29 | 40 | 69 | +5 | 48 | 227 | 12.8 | 18:55 | |||||||||
| 2024-25 | 4 Nations | United States | 4 | 1 | 2 | 3 | +2 | 2 | 9 | 11.0 | 16:11 | |||||||||
| 2024-25 | NHL | Minnesota Wild | 82 | 27 | 46 | 73 | +1 | 51 | 271 | 10.0 | 20:17 | 6 | 5 | 2 | 7 | 2 | 20 | 25.0 | 25:01 | |
| 2025-26 | OG | USA | 6 | 2 | 2 | 4 | +2 | 2 | 21 | 10.0 | 16:36 | |||||||||
| 2025-26 | NHL | Minnesota Wild | 76 | 42 | 43 | 85 | +18 | 30 | 254 | 16.5 | 20:34 | 11 | 7 | 6 | 13 | +5 | 4 | 48 | 14.6 | 23:36 |
| NHL Career | 361 | 144 | 185 | 329 | +42 | 178 | 1120 | 12.8 | 19:01 | 29 | 13 | 11 | 24 | -1 | 14 | 105 | 12.4 | 21:12 | ||