
 Mats Zuccarello
| Position | Right Wing / Left Wing | Current Team | Los Angeles Kings |
| Shoots | Left | Current Contract | 1 year ($1,000.0K CapHit) |
| Height | 5'8" | Expires | 2026-27 |
| Weight (lbs) | 181 | Expiry Age (Jun 30) | 39 |
| Age (DOB) | 38 (Sep 1, 1987) | Expiry Status | UFA |
| Drafted | Undrafted |
| Date | Team | Transaction | |
|---|---|---|---|
| Jul 1, 2026 | Los Angeles Kings | Signed 1 year @ $6.500M AAV starting in 2026-27 | |
| Dec 20, 2025 | Minnesota Wild | Activated from IR | |
| Dec 11, 2025 | Minnesota Wild | Placed on IR | |
| Nov 7, 2025 | Minnesota Wild | Activated from IR | |
| Oct 6, 2025 | Minnesota Wild | Placed on IR | |
| Dec 14, 2024 | Minnesota Wild | Activated from LTIR | |
| Dec 3, 2024 | Minnesota Wild | Placed on LTIR | |
| Nov 15, 2024 | Minnesota Wild | Placed on IR | |
| Sep 29, 2023 | Minnesota Wild | Signed 2 years @ $4.125M AAV starting in 2024-25 | |
| Jul 1, 2019 | Minnesota Wild | Signed 5 years @ $6.000M AAV starting in 2019-20 | |
| Mar 2, 2015 | New York Rangers | Signed 4 years @ $4.500M AAV starting in 2015-16 | |
| Jul 22, 2014 | New York Rangers | Signed 1 year @ $3.500M AAV starting in 2014-15 | |
| Jun 30, 2013 | New York Rangers | Signed 1 year @ $1.150M AAV starting in 2013-14 | |
| Mar 29, 2013 | New York Rangers | Signed 1 year @ $700K AAV starting in 2012-13 | |
| May 26, 2010 | New York Rangers | Signed to an entry level contract. |
Player Card(s)

URL: https://thestanleycap.com/cdn/player_cards/20252026/mats-zuccarello-8475692.png
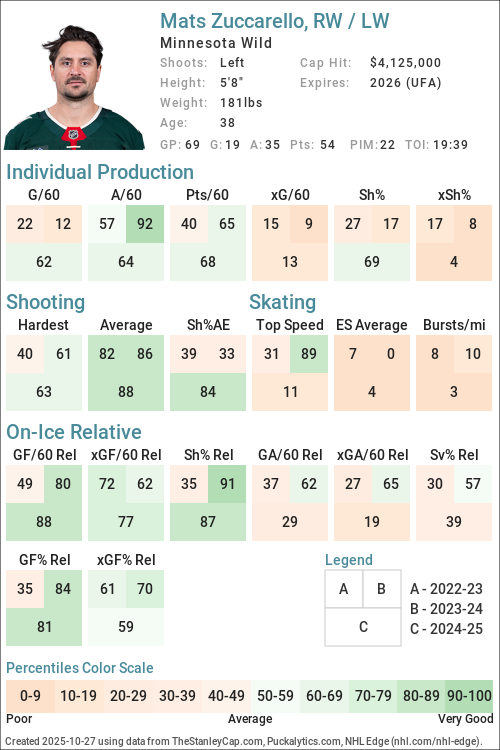
URL: https://thestanleycap.com/cdn/player_cards/20242025/mats-zuccarello-8475692.png
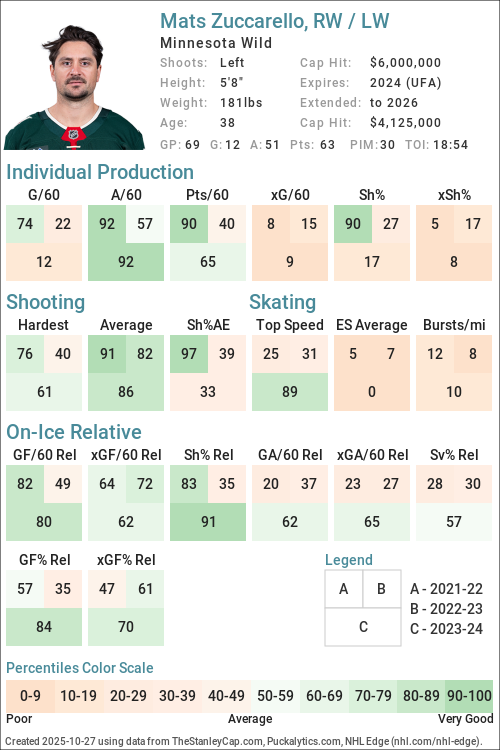
URL: https://thestanleycap.com/cdn/player_cards/20232024/mats-zuccarello-8475692.png
About Player Cards
Player cards present an infographic of a players performance using a series of Player Archetypes developed for Puckalytics.com and TheStanleyCap.com. The boxes in the rink image show the archetype ratings for the season specified in the card while the graphs to the right show the five-year trends for those archetypes.
Except for Faceoffs, the values shown are the players z-score (standard deviation from the mean) for the specific metric used to calculate the archetype values. When calculating z-scores forwards were compared to forwards and defensemen were compared to defensemen. Positive values indicate the player is above average and shaded in blue, while negative values indicate the player is below average and shaded in pink. The five year trend charts show a range of -4.0 to 4.0.
The value shown for Faceoffs is the faceoff winning percentage rather than their z-score with winning percentages below 50 in pink shades and above 50 in blue shades.
All archetypes are 5v5 except 5v4 TOI, 4v5 TOI, Skating (even strength) and Faceoffs (all situations). Archetypes use regular season data only.
Archetypes Summary
- Sniper - Measures the to score above the expected goal rate.
- Rebound - Measures the percent of a players shot attempts that come from rebounds (forwards only).
- 5v4 TOI - Powerplay ice time, calculated as the percentage of his teams 5v4 ice time that the player was on the ice for.
- Shooter - Measures whether a players points come from shots (goals or assists on rebounds from his shots).
- Producer - Measures a players ability to produce goals and assists, adjusted for quality of teammates.
- Playmaker - Measures whether a players points come from passes.
- Drive - Measures a players ability to drive puck possession and generate shot attempts for his team.
- Rush - Measures the percent of a players shot attempts that come from rush plays
- Possession - An indicator of a players ability to improve his teams puck possession game.
- Faceoffs - Faceoff Winning Percentage (min. 75 faceoffs taken).
- 5v5 TOI - The percentage of his teams 5v5 TOI that the player was on the ice for.
- Suppress - Measures a players ability to suppress opponent puck possession and shot attempts against.
- Skating - An indicator of a players skating ability, or speed bursts above 20mph per mile skated.
- Defend - An indicator of a players ability to suppress shot quality against.
- 4v5 TOI - Penalty Kill ice time, calculated as the percentage of his teams 4v5 ice time that the player was on the ice for.
Data Sources
- Salary data is from TheStanleyCap.com
- Skating data is from NHL Edge
- Other statistics are from Puckalytics.com and derived from data from NHL.com
Terms of Use
You are free to use include player cards in written articles, share on social media, or on other public websites under the following conditions:
- You credit TheStanleyCap.com as the source and provide a link back to TheStanleyCap.com or this player page.
- You do not mass copy/duplicate/publish dozens or hundreds of player cards. A few, or a handful for a written article is fine. Be reasonable. Fair use rules apply.
- If you are a high-traffic website you must download and host the image(s) on your site rather than overload TheStanleyCap servers with traffic.
Note: Player cards will update daily throughout the season so if you want to include snapshot then you must download the image.
If you have any questions, send an e-mail to the e-mail address at the top of this page.
Read Introducing Player Archetypes on HockeyAnalysis.com for more details on archetype calculations.
Core Archetypes
| Season | Team(s) | GP | TOI | Producer | Playmaker | Shooter | Sniper | Rebound | Rush | Skating | Defend |
|---|---|---|---|---|---|---|---|---|---|---|---|
| 2015-16 | NYR | 80 | 1.00 | 0.57 | 0.59 | 1.87 | -0.50 | -0.43 | - | -1.03 | |
| 2016-17 | NYR | 80 | 1.09 | 3.33 | -1.09 | -0.77 | 0.41 | -0.21 | - | 0.57 | |
| 2017-18 | NYR | 80 | 0.14 | -0.02 | 0.08 | 0.36 | -0.36 | -1.11 | - | 0.37 | |
| 2018-19 | DAL, NYR | 48 | 0.76 | 0.51 | 0.25 | 0.64 | 1.58 | -1.05 | - | -0.20 | |
| 2019-20 | MIN | 65 | 0.67 | 0.91 | -0.15 | 1.44 | 0.31 | -0.37 | - | 0.02 | |
| 2020-21 | MIN | 42 | 2.01 | 2.79 | -0.15 | 0.49 | 0.56 | 0.59 | - | 0.20 | |
| 2021-22 | MIN | 70 | 1.06 | 1.37 | 0.05 | 1.91 | -1.14 | -0.83 | -0.98 | -0.58 | |
| 2022-23 | MIN | 78 | -0.22 | 0.54 | -0.81 | -0.42 | -1.19 | 0.15 | -1.15 | -0.54 | |
| 2023-24 | MIN | 69 | 0.19 | 1.45 | -0.96 | -0.71 | -1.65 | -1.15 | -1.07 | 0.19 | |
| 2024-25 | MIN | 69 | 0.30 | 0.50 | -0.22 | 0.91 | -0.96 | -0.72 | -1.37 | -0.26 | |
| 2025-26 | MIN | 59 | 1.04 | 2.27 | -0.65 | -0.50 | 0.49 | 0.38 | -1.26 | -1.49 |
Situational and Secondary Archetypes
| Season | Team(s) | GP | TOI | 5v5 TOI | 5v4 TOI | 4v5 TOI | Possession | Drive | Suppress | Faceoffs |
|---|---|---|---|---|---|---|---|---|---|---|
| 2015-16 | NYR | 80 | 1.42 | 1.12 | -1.80 | 0.50 | 0.34 | 0.41 | - | |
| 2016-17 | NYR | 80 | 1.29 | 0.91 | -1.30 | 1.39 | 0.97 | 1.22 | - | |
| 2017-18 | NYR | 80 | 1.04 | 0.89 | -0.32 | 0.72 | 0.25 | 1.01 | 26.3 | |
| 2018-19 | DAL, NYR | 48 | 1.21 | 1.11 | -0.04 | 0.89 | 0.50 | 0.73 | - | |
| 2019-20 | MIN | 65 | 0.30 | 0.37 | -1.89 | -1.25 | -1.00 | -0.79 | - | |
| 2020-21 | MIN | 42 | 0.81 | 0.51 | -2.20 | 0.24 | 0.55 | -0.40 | - | |
| 2021-22 | MIN | 70 | 1.26 | 1.02 | -1.92 | 0.77 | 0.86 | 0.09 | - | |
| 2022-23 | MIN | 78 | 1.76 | 1.57 | -1.78 | 0.96 | 0.91 | 0.28 | - | |
| 2023-24 | MIN | 69 | 1.11 | 1.35 | -1.98 | 0.25 | 0.05 | 0.34 | - | |
| 2024-25 | MIN | 69 | 1.55 | 1.49 | -2.13 | 0.13 | 0.67 | -0.90 | - | |
| 2025-26 | MIN | 59 | 1.13 | 1.39 | -1.98 | 0.88 | 0.99 | 0.07 | - |
5v5 Individual Stats
| Season | Team(s) | GP | TOI | G/60 | A/60 | Pts/60 | xG/60 | GAE/60 | Sh% | xSh% | Sh%AE | %SA Rush | %SA Reb. |
|---|---|---|---|---|---|---|---|---|---|---|---|---|---|
| 2015-16 | NYR | 80 | 1169:45 | 0.87 | 1.08 | 1.95 | 0.51 | 0.36 | 14.91 | 8.71 | 6.20 | 3.21 | 3.85 |
| 2016-17 | NYR | 80 | 1160:25 | 0.36 | 1.60 | 1.96 | 0.55 | -0.18 | 5.60 | 8.44 | -2.84 | 3.59 | 5.99 |
| 2017-18 | NYR | 80 | 1124:39 | 0.69 | 0.91 | 1.60 | 0.61 | 0.08 | 10.24 | 9.02 | 1.21 | 1.78 | 4.14 |
| 2018-19 | DAL | 2 | 24:05 | 2.49 | 2.49 | 4.98 | 1.40 | 1.09 | 25.00 | 14.03 | 10.97 | 0.00 | 0.00 |
| 2018-19 | NYR | 46 | 654:27 | 0.73 | 1.19 | 1.93 | 0.64 | 0.09 | 11.76 | 10.29 | 1.47 | 2.08 | 9.38 |
| 2018-19 | DAL, NYR | 48 | 678:32 | 0.80 | 1.24 | 2.03 | 0.67 | 0.13 | 12.50 | 10.50 | 2.00 | 1.98 | 8.91 |
| 2019-20 | MIN | 65 | 798:14 | 0.75 | 1.20 | 1.95 | 0.47 | 0.28 | 13.51 | 8.46 | 5.06 | 3.06 | 7.14 |
| 2020-21 | MIN | 42 | 575:42 | 0.73 | 1.67 | 2.40 | 0.62 | 0.11 | 14.00 | 11.82 | 2.18 | 5.00 | 7.50 |
| 2021-22 | MIN | 70 | 977:34 | 0.92 | 1.60 | 2.52 | 0.51 | 0.41 | 15.46 | 8.61 | 6.85 | 2.38 | 3.17 |
| 2022-23 | MIN | 78 | 1163:41 | 0.46 | 1.03 | 1.50 | 0.59 | -0.13 | 7.69 | 9.77 | -2.08 | 4.07 | 3.49 |
| 2023-24 | MIN | 69 | 950:36 | 0.38 | 1.45 | 1.83 | 0.53 | -0.15 | 6.67 | 9.26 | -2.60 | 1.47 | 2.94 |
| 2024-25 | MIN | 69 | 1056:05 | 0.74 | 1.02 | 1.76 | 0.54 | 0.20 | 12.38 | 9.07 | 3.31 | 1.33 | 4.67 |
| 2025-26 | MIN | 59 | 842:05 | 0.50 | 1.64 | 2.14 | 0.66 | -0.16 | 8.75 | 11.50 | -2.75 | 3.23 | 9.68 |
5v5 On Ice Stats
| Season | Team(s) | GP | TOI | SAF/60 | GF/60 | xGF/60 | SAA/60 | GA/60 | xGA/60 | GF% | xGF% | xGF Rel | xGA Rel | xGF% Rel |
|---|---|---|---|---|---|---|---|---|---|---|---|---|---|---|
| 2015-16 | NYR | 80 | 1169:45 | 39.34 | 2.72 | 2.37 | 40.83 | 2.21 | 2.34 | 55.21 | 50.30 | 0.18 | -0.16 | 3.60 |
| 2016-17 | NYR | 80 | 1160:25 | 43.33 | 2.64 | 2.45 | 39.09 | 1.91 | 2.10 | 57.95 | 53.82 | 0.18 | -0.37 | 5.97 |
| 2017-18 | NYR | 80 | 1124:39 | 41.19 | 2.24 | 2.51 | 45.03 | 2.51 | 2.58 | 47.19 | 49.31 | 0.14 | -0.19 | 3.24 |
| 2018-19 | DAL | 2 | 24:05 | 57.30 | 7.47 | 4.46 | 39.86 | 0.00 | 2.44 | 100.00 | 64.63 | 2.75 | 0.30 | 20.27 |
| 2018-19 | NYR | 46 | 654:27 | 40.52 | 2.66 | 2.55 | 43.27 | 2.84 | 2.48 | 48.33 | 50.66 | 0.11 | -0.24 | 3.44 |
| 2018-19 | DAL, NYR | 48 | 678:32 | 41.12 | 2.83 | 2.62 | 43.15 | 2.74 | 2.48 | 50.79 | 51.33 | 0.21 | -0.22 | 4.20 |
| 2019-20 | MIN | 65 | 798:14 | 37.88 | 2.71 | 2.16 | 43.22 | 2.71 | 2.16 | 50.00 | 49.93 | -0.27 | 0.15 | -4.68 |
| 2020-21 | MIN | 42 | 575:42 | 39.08 | 2.71 | 2.44 | 42.63 | 2.19 | 2.41 | 55.32 | 50.25 | 0.26 | 0.30 | -0.49 |
| 2021-22 | MIN | 70 | 977:34 | 45.30 | 3.74 | 2.70 | 40.39 | 2.52 | 2.31 | 59.80 | 53.88 | 0.25 | 0.15 | 0.72 |
| 2022-23 | MIN | 78 | 1163:41 | 44.65 | 2.17 | 2.70 | 40.73 | 2.22 | 2.55 | 49.41 | 51.45 | 0.36 | 0.13 | 2.25 |
| 2023-24 | MIN | 69 | 950:36 | 40.14 | 2.84 | 2.39 | 39.95 | 2.40 | 2.17 | 54.22 | 52.44 | 0.15 | -0.03 | 1.96 |
| 2024-25 | MIN | 69 | 1056:05 | 40.68 | 2.61 | 2.40 | 44.26 | 2.44 | 2.46 | 51.69 | 49.43 | 0.46 | 0.25 | 2.63 |
| 2025-26 | MIN | 59 | 842:05 | 44.39 | 2.92 | 2.91 | 42.96 | 2.99 | 2.58 | 49.40 | 53.01 | 0.47 | -0.04 | 4.76 |
NHL Edge Stats
| Skating | Shooting | Zone Time | |||||||||||
|---|---|---|---|---|---|---|---|---|---|---|---|---|---|
| Season | GP | Top Speed | Bursts>20/mi | Avg. Speed | Top Speed | Avg. Speed | %Long Range | %Mid Range | %High Danger | ES DZ% | ES NZ% | ES OZ% | |
| This table is for Basic and Premium subscribers only. To view please login to and/or subscribe to one of our subscription plans. | |||||||||||||
Legend
| Percentile 0-25 | Percentile 25-50 | Percentile 50-75 | Percentile 75-100 |
5v5 Lines
| Season | Teammate | Teammate | Team | TOI | GF/60 | GA/60 | GF% | xGF/60 | xGA/60 | xGF% | xGF Rel | xGA Rel | xGF% Rel |
|---|
Glossary
| Type | Statistic | Definition |
|---|---|---|
| Individual | G/60 | Goals Against per 60 minutes. |
| Individual | A/60 | Assists per 60 minutes. |
| Individual | Pts/60 | Points per 60 minutes. |
| Individual | xG/60 | Expected Goals per 60 minutes. |
| Individual | GAE/60 | Goals Above Expected (G/60 - xG/60). |
| Individual | Sh% | Shooting Percentage. |
| Individual | xSh% | Expected Shooting Percentage. |
| Individual | Sh%AE | Shooting percentage above expected (Sh% - xSh%). |
| Individual | %SA Rush | Percentage of shot attempts determined to be on the rush. |
| Individual | %SA Reb. | Percentage of shot attempts determined to be from rebounds. |
| On Ice | SAF/60 | Shot Attempts For per 60 minutes. |
| On Ice | GF/60 | Goals For per 60 minutes. |
| On Ice | xGF/60 | Expected Goals For per 60 minutes. |
| On Ice | SAA/60 | Shot Attempts Against per 60 minutes (lower is better). |
| On Ice | GA/60 | Goals Against per 60 minutes (lower is better). |
| On Ice | xGA/60 | Expected Goals Against per 60 minutes (lower is better). |
| On Ice | GF% | Goals For Percentage = Goals For / (Goals For + Goals Against) |
| On Ice | xGF% | Expected Goals For Percentage = Expected Goals For / (Expected Goals For + Expected Goals Against) |
| On Ice | xGF Rel | xGF/60 when On Ice - xGF/60 when not On Ice. |
| On Ice | xGA Rel | xGA/60 when On Ice - xGA/60 when not On Ice (lower is better). |
| On Ice | xGF% Rel | xGF% when On Ice - xGF% when not On Ice. |
News and Opinions
-
Mats Zuccarello contract earns praise among NHL's best offseason deals at Rink Royalty (Wed Jul 15, 2026)
-
The Wild's Offseason Signals a Vote of Confidence in Bobby Brink at Hockey Wilderness (Wed Jul 15, 2026)
-
Which recent departure will the Minnesota Wild miss most next season? at Gone Puck Wild (Sun Jul 12, 2026)
-
Bill Guerin went from GM of the Year to 'loser' after one offseason move at Gone Puck Wild (Fri Jul 10, 2026)
-
LA Kings Forward Alignment? Thoughts On What We Could See, Based on Laviolette/Holland Offseason Comments at LA Kings Insider (Thu Jul 9, 2026)
-
3 LA Kings who must step up to replace Andrei Kuzmenko next season at Rink Royalty (Tue Jul 7, 2026)
-
The Wild may have another reason why Mats Zuccarello had to go at Gone Puck Wild (Tue Jul 7, 2026)
-
Comments from Mats Zuccarello on Leaving the Wild to Sign with LA Kings at Mayors Manor (Mon Jul 6, 2026)
-
Mats Zuccarello addresses reports about his Wild exit after joining Kings at Rink Royalty (Sun Jul 5, 2026)
-
Kings Capitalize On Wild Communication Misstep To Land Mats Zuccarello In Surprise Move at Yahoo Sports NHL (Sat Jul 4, 2026)
-
Recapping the Minnesota Wild’s Early Free Agency Moves at The Hockey Writers (Fri Jul 3, 2026)
-
Mats Zuccarello Absence Leaves A Void That's Not Easily Measured at Hockey Wilderness (Fri Jul 3, 2026)
-
A humble Mats Zuccarello felt wanted in Los Angeles and he’s motivated to reward that faith on the ice at LA Kings Insider (Thu Jul 2, 2026)
-
After 15 NHL Seasons, Mats Zuccarello Is Finally Living His Dream at Yahoo Sports NHL (Thu Jul 2, 2026)
-
Was Day 1 Of Wild Free Agency As Bad As It Felt? at Hockey Wilderness (Thu Jul 2, 2026)
-
Mats Zuccarello's new contract shows how bad the Wild wanted to move on at Gone Puck Wild (Thu Jul 2, 2026)
-
5 Takeaways From Day 1 of LA Kings Free Agency at LA Kings Insider (Thu Jul 2, 2026)
-
First Reactions – Kings Reportedly Sign Mats Zuccarello, Corey Perry (one-year) & Erik Haula (two-years) at LA Kings Insider (Wed Jul 1, 2026)
-
LA Kings reportedly bolster top-six with Mats Zuccarello signing at Rink Royalty (Wed Jul 1, 2026)
-
Chris Drury blew chance at a cheap Mats Zuccarello reunion at Blue Line Station (Wed Jul 1, 2026)
-
Kings Sign Mats Zuccarello to One-Year Deal at The Hockey Writers (Wed Jul 1, 2026)
-
REPORT: Kings Set to Add Free Agent Forward Mats Zuccarello on One-Year Deal at Mayors Manor (Wed Jul 1, 2026)
-
Mats Zuccarello quitte le Wild at HABSolument Fan (Wed Jul 1, 2026)
-
Wild's potential Mats Zuccarello replacement just became available in free agency at Gone Puck Wild (Wed Jul 1, 2026)
-
Should Red Wings Consider UFA Zuccarello? at Detroit Hockey Now (Wed Jul 1, 2026)
-
NHL Rumors: NY Rangers, Alexander Nikishin, Mats Zuccarello, Jacob Trouba, and Patrick Kane at NHL Rumors (Tue Jun 30, 2026)
-
Pros, cons of Rangers bringing back Mats Zuccarello in free agency at Forever Blueshirts (Tue Jun 30, 2026)
-
It’s Time for a Mats Zuccarello Rangers Reunion at Blue Shirt Banter (Tue Jun 30, 2026)
-
3 veteran free agent targets the New Jersey Devils should target at Pucks and Pitchforks (Mon Jun 29, 2026)
-
Sudden Mats Zuccarello free agency drama brilliantly sparks logical Rangers reunion at Blue Line Station (Mon Jun 29, 2026)
-
Minnesota Wild Are Set Up for a Potentially Busy Free Agent Offseason at The Hockey Writers (Mon Jun 29, 2026)
-
Mats Zuccarello's breakup with Wild could get uglier than anticipated at Gone Puck Wild (Mon Jun 29, 2026)
-
5 free agents the Rangers should keep an eye on after landing Pavel Dorofeyev at Blue Line Station (Sun Jun 28, 2026)
-
Wild could target former Central Division villain to solve top six woes at Gone Puck Wild (Sun Jun 21, 2026)
-
What Are the Wild Weighing With A Zuccarello Extension? at Hockey Wilderness (Sat Jun 20, 2026)
-
Red Wings would do well to avoid this aging free agent at Octopus Thrower (Fri Jun 19, 2026)
-
Mats Zuccarello is a free agent and Wild fans don't know how to feel about it at Gone Puck Wild (Thu Jun 11, 2026)
-
Mats Zuccarello Is Still A Vital Connector On the Wild at Hockey Wilderness (Wed Jun 3, 2026)
-
Rangers should heavily consider bringing a beloved franchise icon back to Broadway at Blue Line Station (Fri May 29, 2026)
-
Quinn Hughes extension and other offseason moves the Wild can’t afford to miss on at Gone Puck Wild (Tue May 19, 2026)
-
Ex-Rangers star faces free agency, hopes to play until at least age 40 at Forever Blueshirts (Mon May 18, 2026)
-
Mats Zuccarello's Return Changed Everything For the Wild at Hockey Wilderness (Thu Apr 30, 2026)
-
Mats Zuccarello Did The Little Things That Proved To Be The Difference In His Return at Hockey Wilderness (Thu Apr 30, 2026)
-
How ex-Rangers star got teammates ‘hearts pumping’ in Wild playoff return at Forever Blueshirts (Wed Apr 29, 2026)
-
Biggest winners (and a few losers) after Wild win Game 5 and push Stars to brink of elimination at Gone Puck Wild (Wed Apr 29, 2026)
-
Mats Zuccarello instantly reminded the Wild why they need him in Game 5 at Gone Puck Wild (Tue Apr 28, 2026)
-
John Hynes reveals official Game 5 status for Mats Zuccarello at Gone Puck Wild (Tue Apr 28, 2026)
-
Mats Zuccarello, Yakov Trenin Game-Time Decisions For Game 5 at Yahoo Sports NHL (Tue Apr 28, 2026)
-
Who's Out If Mats Zuccarello, Yakov Trenin Play In Game 5? at Yahoo Sports NHL (Tue Apr 28, 2026)
-
Wild get major Mats Zuccarello injury update ahead of Game 5 vs. Stars at Gone Puck Wild (Mon Apr 27, 2026)
-
Wild's Mats Zuccarello, Yakov Trenin On The Ice For Practice Listed As 'Questionable' at Yahoo Sports NHL (Mon Apr 27, 2026)
-
Why Can't the Wild Score On the Power Play Without Zuccarello? at Hockey Wilderness (Mon Apr 27, 2026)
-
Kirill Kaprizov said the quiet part out loud about Mats Zuccarello injury at Gone Puck Wild (Sat Apr 25, 2026)
-
The Mats Zuccarello Replacement Was Staring Us In the Face at Hockey Wilderness (Sat Apr 25, 2026)
-
Mats Zuccarello Can't Be the Piece That Topples the Jenga Tower at Hockey Wilderness (Fri Apr 24, 2026)
-
Wild’s frustrating Game 3 collapse in OT traces back to a brutal Game 1 moment at Gone Puck Wild (Thu Apr 23, 2026)
-
Is Mats Zuccarello playing tonight? Latest injury update ahead of Game 3 at Gone Puck Wild (Wed Apr 22, 2026)
-
Rangers Daily: Zuccarello injury concern; Carolina controversy at Forever Blueshirts (Tue Apr 21, 2026)
-
Mats Zuccarello scores in overtime as the Wild beat the Blackhawks 4-3 at Yahoo Sports NHL (Tue Mar 17, 2026)
-
Fantasy Hockey Waiver Wire: Mats Zuccarello is a top target with the Wild on a four-game week at Yahoo Sports NHL (Mon Mar 9, 2026)
-
Building an All-World Olympic Hockey Team at The Hockey Writers (Tue Feb 10, 2026)
-
Ryan Hartman Is Holding His Own While the Wild Explore the Trade Market at Hockey Wilderness (Mon Feb 2, 2026)
-
Mats Zuccarello’s overtime goal gives the Wild a 5-4 win over the red-hot Sabres at Sabres Space (Sun Jan 18, 2026)
-
Zuccarello the OT Hero as Wild Beat Kraken 3-2 at The Hockey Writers (Fri Jan 9, 2026)
-
Mats Zuccarello Is Still A Big Loss At Age 37 at Hockey Wilderness (Fri Dec 12, 2025)
-
Seattle's Vince Dunn Won't Receive Any Discipline From NHL From Hit To The Head Of Wild's Mats Zuccarello at Yahoo Sports NHL (Wed Dec 10, 2025)
-
'It's A Cool Achievement': Wild's Mats Zuccarello Becomes Third Undrafted Player In NHL History To Record 700 Points at Yahoo Sports NHL (Sun Nov 30, 2025)
-
Top-5 : Mats Zuccarello marque dans son propre but avec sa main at Dans Les Coulisses (Sun Nov 30, 2025)
-
Fantasy Hockey Waiver Wire: Mats Zuccarello leads top pickup options this week at Yahoo Sports NHL (Fri Nov 21, 2025)
-
NHL Rumors: Minnesota Wild – Mats Zuccarello, Trade Targets and Bait at NHL Rumors (Thu Nov 20, 2025)
-
Is Mats Zuccarello the Minnesota Wild's Savior? (Podcast) at Hockey Wilderness (Tue Nov 11, 2025)
-
What Does Mats Zuccarello Bring To Save the Wild's Season? at Hockey Wilderness (Fri Nov 7, 2025)
-
Minnesota's Best Trade Options Aren't the Ones You'd Expect at Hockey Wilderness (Mon Oct 27, 2025)
-
2 key injured Wild players going into the LA Kings matchup at Rink Royalty (Sun Oct 12, 2025)
-
Wild's Mats Zuccarello to Miss At Least Seven Weeks at Hockey Wilderness (Wed Oct 1, 2025)
-
Popular ex-Rangers forward out 7-8 weeks with lower-body injury for Wild at Forever Blueshirts (Tue Sep 30, 2025)
-
Top 10 Undersized NHL Players at The Hockey Writers (Mon Sep 29, 2025)
-
Minnesota Wild Top Takeaways Following Day 1 of Training Camp at The Hockey Writers (Fri Sep 19, 2025)
-
Wild's Mats Zuccarello Will Be Out For "A Little While" at Yahoo Sports NHL (Thu Sep 18, 2025)
-
Zuccarello's absence could lead to an improved roster spot for Wild rookie at Gone Puck Wild (Thu Sep 18, 2025)
-
Revisiting Mats Zuccarello’s Rangers Tenure & Trade to the Stars at The Hockey Writers (Thu Sep 11, 2025)
-
The Wild Need To Establish A Role For Liam Ohgren at Hockey Wilderness (Mon Aug 25, 2025)
-
Mats Zuccarello's Old Guy Magic Might Not Slow Down Soon at Hockey Wilderness (Mon Jul 28, 2025)
-
Free Agent Profile: Mats Zuccarello at Devils Army (Sun Jun 2, 2019)
Current Contract
Mats Zuccarello signed a $1,000,000 1-year contract with the Los Angeles Kings and General Manager Ken Holland on July 1, 2026 with an AAV of $1,000,000. This contract will start in 2026-27 and end after the 2026-27 season. In the first season of the contract the cap hit was equivalent to 0.96% of the salary cap.
Standard Contract (UFA) ( ) (0 ratings)
Mats Zuccarello signed a $8,250,000 2-year contract with the Minnesota Wild and General Manager Bill Guerin on September 29, 2023 with an AAV of $4,125,000. This contract will start in 2024-25 and end after the 2025-26 season. In the first season of the contract the cap hit was equivalent to 4.69% of the salary cap.
35+ Contract ( ) (0 ratings)
| Season | Age* | Clause | Cap Hit | AAV | Perf. Bonus | Sign. Bonus | Salary | Compensation | Minors Salary | Status | |
|---|---|---|---|---|---|---|---|---|---|---|---|
| 2024-25 | 37 | NMC | $4,125,000 | $4,125,000 | - | - | $4,700,000 | $4,700,000 | $4,700,000 | UFA | |
| 2025-26 | 38 | NMC | $4,125,000 | $4,125,000 | - | - | $3,550,000 | $3,550,000 | $3,550,000 | UFA | |
| Total | - | - | $8,250,000 | $8,250,000 | $8,250,000 |
Mats Zuccarello signed a $30,000,000 5-year contract with the Minnesota Wild and General Manager Paul Fenton on July 1, 2019 with an AAV of $6,000,000. This contract will start in 2019-20 and end after the 2023-24 season. In the first season of the contract the cap hit was equivalent to 7.36% of the salary cap.
Standard Contract (UFA) ( ) (0 ratings)
| Season | Age* | Clause | Cap Hit | AAV | Perf. Bonus | Sign. Bonus | Salary | Compensation | Minors Salary | Status | |
|---|---|---|---|---|---|---|---|---|---|---|---|
| 2019-20 | 32 | NMC | $6,000,000 | $6,000,000 | - | $2,000,000 | $3,000,000 | $5,000,000 | $5,000,000 | UFA | |
| 2020-21 | 33 | NMC | $6,000,000 | $6,000,000 | - | $3,000,000 | $2,000,000 | $5,000,000 | $5,000,000 | UFA | |
| 2021-22 | 34 | NMC | $6,000,000 | $6,000,000 | - | - | $7,500,000 | $7,500,000 | $7,500,000 | UFA | |
| 2022-23 | 35 | NMC M-NTC | $6,000,000 | $6,000,000 | - | $3,000,000 | $4,500,000 | $7,500,000 | $7,500,000 | UFA | |
| 2023-24 | 36 | NMC M-NTC | $6,000,000 | $6,000,000 | - | $2,000,000 | $3,000,000 | $5,000,000 | $5,000,000 | UFA | |
| Total | - | $10,000,000 | $20,000,000 | $30,000,000 | $30,000,000 |
Mats Zuccarello signed a $18,000,000 4-year contract with the New York Rangers and General Manager Glen Sather on March 2, 2015 with an AAV of $4,500,000. This contract will start in 2015-16 and end after the 2018-19 season. In the first season of the contract the cap hit was equivalent to 6.30% of the salary cap.
Standard Contract (UFA) ( ) (0 ratings)
| Season | Age* | Clause | Cap Hit | AAV | Perf. Bonus | Sign. Bonus | Salary | Compensation | Minors Salary | Status | |
|---|---|---|---|---|---|---|---|---|---|---|---|
| 2015-16 | 28 | NTC | $4,500,000 | $4,500,000 | - | - | $4,500,000 | $4,500,000 | $4,500,000 | UFA | |
| 2016-17 | 29 | $4,500,000 | $4,500,000 | - | - | $4,500,000 | $4,500,000 | $4,500,000 | UFA | ||
| 2017-18 | 30 | $4,500,000 | $4,500,000 | - | - | $4,500,000 | $4,500,000 | $4,500,000 | UFA | ||
| 2018-19 | 31 | $4,500,000 | $4,500,000 | - | - | $4,500,000 | $4,500,000 | $4,500,000 | UFA | ||
| Total | - | - | $18,000,000 | $18,000,000 | $18,000,000 |
Mats Zuccarello signed a $3,500,000 1-year contract with the New York Rangers and General Manager Glen Sather on July 22, 2014 with an AAV of $3,500,000. This contract will start in 2014-15 and end after the 2014-15 season. In the first season of the contract the cap hit was equivalent to 5.07% of the salary cap.
Standard Contract (RFA) ( ) (0 ratings)
| Season | Age* | Clause | Cap Hit | AAV | Perf. Bonus | Sign. Bonus | Salary | Compensation | Minors Salary | Status | |
|---|---|---|---|---|---|---|---|---|---|---|---|
| 2014-15 | 27 | $3,500,000 | $3,500,000 | - | - | $3,500,000 | $3,500,000 | $3,500,000 | RFA-arb | ||
| Total | - | - | $3,500,000 | $3,500,000 | $3,500,000 |
Mats Zuccarello signed a $1,150,000 1-year contract with the New York Rangers and General Manager Glen Sather on June 30, 2013 with an AAV of $1,150,000. This contract will start in 2013-14 and end after the 2013-14 season. In the first season of the contract the cap hit was equivalent to 1.79% of the salary cap.
Standard Contract (RFA) ( ) (0 ratings)
| Season | Age* | Clause | Cap Hit | AAV | Perf. Bonus | Sign. Bonus | Salary | Compensation | Minors Salary | Status | |
|---|---|---|---|---|---|---|---|---|---|---|---|
| 2013-14 | 26 | $1,150,000 | $1,150,000 | - | - | $1,150,000 | $1,150,000 | $1,150,000 | RFA-arb | ||
| Total | - | - | $1,150,000 | $1,150,000 | $1,150,000 |
Mats Zuccarello signed a $700,000 1-year contract with the New York Rangers and General Manager Glen Sather on March 29, 2013 with an AAV of $700,000. This contract will start in 2012-13 and end after the 2012-13 season. In the first season of the contract the cap hit was equivalent to 1.17% of the salary cap.
Standard Contract (RFA) ( ) (0 ratings)
| Season | Age* | Clause | Cap Hit | AAV | Perf. Bonus | Sign. Bonus | Salary | Compensation | Minors Salary | Status | |
|---|---|---|---|---|---|---|---|---|---|---|---|
| 2012-13 | 25 | $700,000 | $700,000 | - | - | $700,000 | $700,000 | $700,000 | RFA-arb | ||
| Total | - | - | $700,000 | $700,000 | $700,000 |
Mats Zuccarello signed a $1,800,000 2-year contract with the New York Rangers and General Manager Glen Sather on May 26, 2010 with an AAV of $900,000. This contract will start in 2010-11 and end after the 2011-12 season. In the first season of the contract the cap hit was equivalent to 1.52% of the salary cap.
Entry Level Contract ( ) (0 ratings)
| Season | Age* | Clause | Cap Hit | AAV | Perf. Bonus | Sign. Bonus | Salary | Compensation | Minors Salary | Status | |
|---|---|---|---|---|---|---|---|---|---|---|---|
| 2010-11 | 23 | $900,000 | $1,750,000 | $850,000 | $90,000 | $810,000 | $900,000 | $67,500 | ELC | ||
| 2011-12 | 24 | $900,000 | $1,750,000 | $850,000 | $90,000 | $810,000 | $900,000 | $67,500 | ELC | ||
| Total | $1,700,000 | $180,000 | $1,620,000 | $1,800,000 | $135,000 |
Career Statistics
| Regular Season | Playoffs | |||||||||||||||||||
|---|---|---|---|---|---|---|---|---|---|---|---|---|---|---|---|---|---|---|---|---|
| Season | League | Team | GP | G | A | Pts | +/- | PIM | Shots | Sh% | TOI/G | GP | G | A | Pts | +/- | PIM | Shots | Sh% | TOI/G |
| 2003-04 | WJ18-A | Norway | 6 | 0 | 2 | 2 | 8 | |||||||||||||
| 2003-04 | Norway-Jr. | Frisk Jr. | 20 | 7 | 14 | 21 | 14 | 3 | 2 | 2 | 0.0 | |||||||||
| 2003-04 | Nor-U18 | Frisk U18 | 24 | 23 | 14 | 37 | 44 | 2 | 3 | 1 | 4 | 0.0 | ||||||||
| 2004-05 | Nor-U18 | Frisk U18 | 12 | 11 | 18 | 29 | 50 | |||||||||||||
| 2004-05 | WJ18-B | Norway | 5 | 2 | 3 | 5 | 6 | |||||||||||||
| 2004-05 | Norway | Frisk-Asker | 1 | 0 | 0 | 0 | ||||||||||||||
| 2004-05 | Norway-Jr. | Frisk Jr. | 27 | 19 | 17 | 36 | 16 | 5 | 3 | 3 | 6 | 6 | 0.0 | |||||||
| 2005-06 | WJC-A | Norway | 6 | 0 | 2 | 2 | 4 | |||||||||||||
| 2005-06 | Norway | Asker | 21 | 5 | 3 | 8 | 12 | 4 | 2 | 0.0 | ||||||||||
| 2005-06 | Norway-Jr. | Asker Jr. | 2 | 7 | 0 | 7 | 2 | 2 | 3 | 5 | 0.0 | |||||||||
| 2006-07 | WJC-B | Norway | 5 | 2 | 5 | 7 | 2 | |||||||||||||
| 2006-07 | Norway | Frisk | 43 | 34 | 25 | 59 | 36 | 7 | 4 | 4 | 8 | 2 | 0.0 | |||||||
| 2006-07 | Norway-Jr. | Asker Jr. | 1 | 3 | 4 | 7 | 2 | 0.0 | ||||||||||||
| 2007-08 | WC-A | Norway | 7 | 1 | 0 | 1 | -5 | 2 | ||||||||||||
| 2007-08 | Norway | Frisk | 33 | 24 | 40 | 64 | 48 | 15 | 12 | 15 | 27 | 24 | 0.0 | |||||||
| 2008-09 | Sweden | Modo | 35 | 12 | 28 | 40 | 38 | |||||||||||||
| 2008-09 | WC-A | Norway | 6 | 3 | 0 | 3 | 8 | |||||||||||||
| 2008-09 | Oly-Q | Norway | 3 | 0 | 0 | 0 | ||||||||||||||
| 2009-10 | Sweden | Modo | 55 | 23 | 41 | 64 | 62 | |||||||||||||
| 2009-10 | WC-A | Norway | 6 | 3 | 1 | 4 | 6 | |||||||||||||
| 2009-10 | Olympics | Norway | 4 | 1 | 2 | 3 | 4 | |||||||||||||
| 2010-11 | AHL | Connecticut | 36 | 13 | 16 | 29 | +2 | 16 | 107 | 1,215.0 | 2 | 1 | 1 | 2 | +1 | 4 | ||||
| 2010-11 | NHL | New York Rangers | 42 | 6 | 17 | 23 | +3 | 4 | 74 | 8.1 | 14:10 | 1 | 2 | 1 | 0.0 | 7:34 | ||||
| 2011-12 | AHL | Connecticut | 37 | 12 | 24 | 36 | +5 | 22 | 92 | 1,304.0 | ||||||||||
| 2011-12 | NHL | New York Rangers | 10 | 2 | 1 | 3 | 6 | 10 | 20.0 | 10:03 | ||||||||||
| 2012-13 | NHL | New York Rangers | 15 | 3 | 5 | 8 | +10 | 8 | 27 | 11.1 | 16:25 | 12 | 1 | 6 | 7 | -2 | 4 | 22 | 4.6 | 16:22 |
| 2012-13 | KHL | Magnitogorsk | 44 | 11 | 17 | 28 | 30 | 7 | 2 | 2 | 4 | 10 | ||||||||
| 2013-14 | Olympics | Norway | 3 | 0 | 0 | 0 | -2 | 2 | 10 | |||||||||||
| 2013-14 | NHL | New York Rangers | 77 | 19 | 40 | 59 | +11 | 32 | 170 | 11.2 | 17:08 | 25 | 5 | 8 | 13 | +7 | 20 | 54 | 9.3 | 17:41 |
| 2014-15 | NHL | New York Rangers | 78 | 15 | 34 | 49 | +17 | 45 | 154 | 9.7 | 17:16 | 5 | 2 | 2 | +1 | 13 | 0.0 | 14:35 | ||
| 2015-16 | WC-A | Norway | 7 | 1 | 2 | 3 | -2 | 4 | 28 | |||||||||||
| 2015-16 | NHL | New York Rangers | 81 | 26 | 35 | 61 | +2 | 34 | 166 | 15.7 | 18:29 | 5 | 1 | 1 | 2 | -2 | 4 | 12 | 8.3 | 18:21 |
| 2016-17 | WCup | Team Europe | 6 | 1 | 3 | 4 | +2 | 4 | ||||||||||||
| 2016-17 | OGQ | Norway | 3 | 2 | 3 | 5 | +2 | |||||||||||||
| 2016-17 | NHL | New York Rangers | 80 | 15 | 44 | 59 | +15 | 26 | 189 | 7.9 | 18:50 | 12 | 4 | 3 | 7 | 16 | 25 | 16.0 | 20:33 | |
| 2017-18 | NHL | New York Rangers | 80 | 16 | 37 | 53 | -10 | 36 | 178 | 9.0 | 18:55 | |||||||||
| 2018-19 | NHL | New York Rangers | 46 | 11 | 26 | 37 | -11 | 24 | 99 | 11.1 | 20:01 | |||||||||
| 2018-19 | NHL | Dallas Stars | 2 | 1 | 2 | 3 | +3 | 5 | 20.0 | 15:59 | 13 | 4 | 7 | 11 | +2 | 6 | 22 | 18.2 | 17:07 | |
| 2019-20 | NHL | Minnesota Wild | 65 | 15 | 22 | 37 | -9 | 18 | 96 | 15.6 | 15:56 | 4 | 1 | 1 | -1 | 3 | 0.0 | 14:07 | ||
| 2020-21 | NHL | Minnesota Wild | 42 | 11 | 24 | 35 | +9 | 8 | 74 | 14.9 | 16:41 | 7 | 3 | 3 | -2 | 2 | 15 | 0.0 | 16:40 | |
| 2021-22 | OGQ | Norway | 3 | 1 | 1 | 2 | +3 | 4 | ||||||||||||
| 2021-22 | NHL | Minnesota Wild | 70 | 24 | 55 | 79 | +21 | 24 | 159 | 15.1 | 18:35 | 6 | 1 | 3 | 4 | -1 | 2 | 9 | 11.1 | 19:15 |
| 2022-23 | NHL | Minnesota Wild | 78 | 22 | 45 | 67 | -3 | 26 | 198 | 11.1 | 20:12 | 6 | 2 | 3 | 5 | -2 | 4 | 15 | 13.3 | 21:30 |
| 2023-24 | NHL | Minnesota Wild | 69 | 12 | 51 | 63 | -5 | 30 | 173 | 6.9 | 18:54 | |||||||||
| 2024-25 | OGQ | Norway | 3 | 1 | 4 | 5 | +2 | |||||||||||||
| 2024-25 | NHL | Minnesota Wild | 69 | 19 | 35 | 54 | 22 | 151 | 12.6 | 19:39 | 6 | 1 | 2 | 3 | -1 | 8 | 12.5 | 18:40 | ||
| 2025-26 | NHL | Minnesota Wild | 59 | 15 | 39 | 54 | -5 | 20 | 122 | 12.3 | 18:39 | 8 | 2 | 7 | 9 | -3 | 2 | 15 | 13.3 | 18:22 |
| NHL Career | 963 | 232 | 512 | 744 | +48 | 363 | 2045 | 11.3 | 18:07 | 110 | 21 | 46 | 67 | -4 | 62 | 214 | 9.8 | 17:47 | ||