
 Marc McLaughlin
| Position | Center | Current Team | New Jersey Devils |
| Shoots | Right | Current Contract | 1 year ($850.0K CapHit) |
| Height | 6'0" | Expires | 2026-27 |
| Weight (lbs) | 202 | Expiry Age (Jun 30) | 27 |
| Age (DOB) | 27 (July 26, 1999) | Expiry Status | UFA |
| Drafted | Undrafted |
| Date | Team | Transaction | |
|---|---|---|---|
| Jul 1, 2026 | New Jersey Devils | Signed 1 year @ $850K AAV starting in 2026-27 | |
| Apr 15, 2026 | New Jersey Devils | Assigned to AHL | |
| Apr 3, 2026 | New Jersey Devils | Recalled from AHL | |
| Feb 12, 2026 | New Jersey Devils | Assigned to AHL | |
| Feb 12, 2026 | New Jersey Devils | Activated from SOIR. | |
| Feb 12, 2026 | New Jersey Devils | Cleared Waivers | |
| Feb 11, 2026 | New Jersey Devils | Placed on Waivers | |
| Oct 6, 2025 | New Jersey Devils | Placed on LTIR | |
| Jun 30, 2025 | New Jersey Devils | Signed 1 year @ $775K AAV starting in 2025-26 | |
| Apr 17, 2025 | New Jersey Devils | Assigned to AHL | |
| Apr 14, 2025 | New Jersey Devils | Recalled from AHL | |
| Mar 7, 2025 | New Jersey Devils | Acquired from Boston Bruins | |
| Mar 7, 2025 | Boston Bruins | Traded to New Jersey Devils | |
| Jan 13, 2025 | Boston Bruins | Assigned to AHL | |
| Jan 13, 2025 | Boston Bruins | Cleared Waivers | |
| Jan 12, 2025 | Boston Bruins | Placed on Waivers | |
| Dec 27, 2024 | Boston Bruins | Recalled from AHL | |
| Dec 23, 2024 | Boston Bruins | Assigned to AHL | |
| Dec 21, 2024 | Boston Bruins | Recalled from AHL | |
| Dec 20, 2024 | Boston Bruins | Assigned to AHL | |
| Dec 13, 2024 | Boston Bruins | Recalled from AHL | |
| Dec 12, 2024 | Boston Bruins | Assigned to AHL | |
| Dec 9, 2024 | Boston Bruins | Recalled from AHL | |
| Dec 8, 2024 | Boston Bruins | Assigned to AHL | |
| Dec 6, 2024 | Boston Bruins | Recalled from AHL | |
| Dec 5, 2024 | Boston Bruins | Assigned to AHL | |
| Nov 29, 2024 | Boston Bruins | Recalled from AHL | |
| Nov 28, 2024 | Boston Bruins | Assigned to AHL | |
| Nov 25, 2024 | Boston Bruins | Recalled from AHL | |
| Nov 24, 2024 | Boston Bruins | Assigned to AHL | |
| Nov 22, 2024 | Boston Bruins | Recalled from AHL | |
| Jul 17, 2024 | Boston Bruins | Signed 1 year @ $775K AAV starting in 2024-25 | |
| Mar 15, 2022 | Boston Bruins | Signed to an entry level contract. |
Player Card(s)
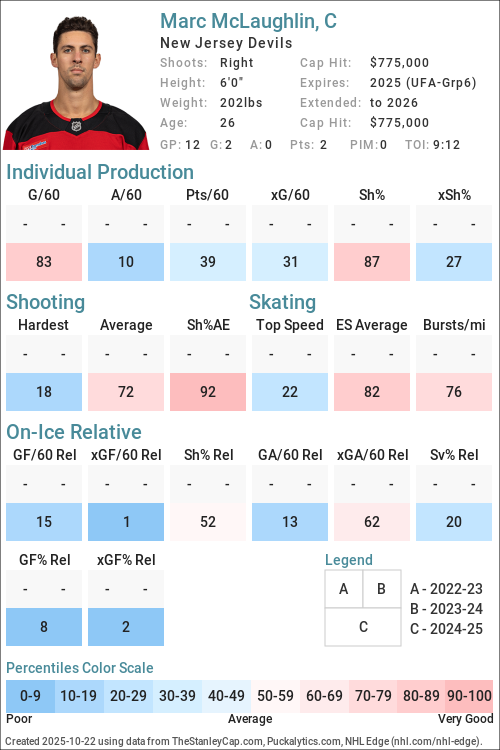
URL: https://thestanleycap.com/cdn/player_cards/20242025/marc-mclaughlin-8483397.png
About Player Cards
Player cards present an infographic of a players performance using a series of Player Archetypes developed for Puckalytics.com and TheStanleyCap.com. The boxes in the rink image show the archetype ratings for the season specified in the card while the graphs to the right show the five-year trends for those archetypes.
Except for Faceoffs, the values shown are the players z-score (standard deviation from the mean) for the specific metric used to calculate the archetype values. When calculating z-scores forwards were compared to forwards and defensemen were compared to defensemen. Positive values indicate the player is above average and shaded in blue, while negative values indicate the player is below average and shaded in pink. The five year trend charts show a range of -4.0 to 4.0.
The value shown for Faceoffs is the faceoff winning percentage rather than their z-score with winning percentages below 50 in pink shades and above 50 in blue shades.
All archetypes are 5v5 except 5v4 TOI, 4v5 TOI, Skating (even strength) and Faceoffs (all situations). Archetypes use regular season data only.
Archetypes Summary
- Sniper - Measures the to score above the expected goal rate.
- Rebound - Measures the percent of a players shot attempts that come from rebounds (forwards only).
- 5v4 TOI - Powerplay ice time, calculated as the percentage of his teams 5v4 ice time that the player was on the ice for.
- Shooter - Measures whether a players points come from shots (goals or assists on rebounds from his shots).
- Producer - Measures a players ability to produce goals and assists, adjusted for quality of teammates.
- Playmaker - Measures whether a players points come from passes.
- Drive - Measures a players ability to drive puck possession and generate shot attempts for his team.
- Rush - Measures the percent of a players shot attempts that come from rush plays
- Possession - An indicator of a players ability to improve his teams puck possession game.
- Faceoffs - Faceoff Winning Percentage (min. 75 faceoffs taken).
- 5v5 TOI - The percentage of his teams 5v5 TOI that the player was on the ice for.
- Suppress - Measures a players ability to suppress opponent puck possession and shot attempts against.
- Skating - An indicator of a players skating ability, or speed bursts above 20mph per mile skated.
- Defend - An indicator of a players ability to suppress shot quality against.
- 4v5 TOI - Penalty Kill ice time, calculated as the percentage of his teams 4v5 ice time that the player was on the ice for.
Data Sources
- Salary data is from TheStanleyCap.com
- Skating data is from NHL Edge
- Other statistics are from Puckalytics.com and derived from data from NHL.com
Terms of Use
You are free to use include player cards in written articles, share on social media, or on other public websites under the following conditions:
- You credit TheStanleyCap.com as the source and provide a link back to TheStanleyCap.com or this player page.
- You do not mass copy/duplicate/publish dozens or hundreds of player cards. A few, or a handful for a written article is fine. Be reasonable. Fair use rules apply.
- If you are a high-traffic website you must download and host the image(s) on your site rather than overload TheStanleyCap servers with traffic.
Note: Player cards will update daily throughout the season so if you want to include snapshot then you must download the image.
If you have any questions, send an e-mail to the e-mail address at the top of this page.
Read Introducing Player Archetypes on HockeyAnalysis.com for more details on archetype calculations.
Core Archetypes
| Season | Team(s) | GP | TOI | Producer | Playmaker | Shooter | Sniper | Rebound | Rush | Skating | Defend |
|---|---|---|---|---|---|---|---|---|---|---|---|
| 2021-22 | BOS | 11 | -0.27 | -1.69 | 4.34 | 4.65 | -2.34 | 1.34 | -0.14 | -0.19 | |
| 2022-23 | BOS | 2 | - | - | - | -2.08 | -2.29 | -1.90 | 1.81 | -0.24 | |
| 2023-24 | BOS | 1 | 9.20 | -1.72 | 30.36 | 9.67 | -2.60 | -1.85 | -1.63 | 13.28 | |
| 2024-25 | BOS, NJD | 14 | 0.02 | -1.03 | 1.48 | 1.50 | 1.11 | 1.86 | 0.67 | -0.73 | |
| 2025-26 | NJD | 7 | -2.30 | -1.74 | -1.48 | - | -2.54 | -1.69 | 1.06 | 0.50 |
Situational and Secondary Archetypes
| Season | Team(s) | GP | TOI | 5v5 TOI | 5v4 TOI | 4v5 TOI | Possession | Drive | Suppress | Faceoffs |
|---|---|---|---|---|---|---|---|---|---|---|
| 2021-22 | BOS | 11 | -1.13 | -1.85 | -2.01 | -2.02 | -1.85 | -1.22 | - | |
| 2022-23 | BOS | 2 | -1.52 | -1.50 | -1.11 | -3.60 | -1.55 | -5.25 | - | |
| 2023-24 | BOS | 1 | -0.77 | -1.87 | 0.50 | 3.11 | 1.48 | 2.08 | - | |
| 2024-25 | BOS, NJD | 14 | -1.93 | -1.95 | -2.05 | -1.38 | -1.53 | 0.07 | - | |
| 2025-26 | NJD | 7 | -2.61 | -1.80 | -1.99 | -5.53 | -4.36 | -1.23 | - |
5v5 Individual Stats
| Season | Team(s) | GP | TOI | G/60 | A/60 | Pts/60 | xG/60 | GAE/60 | Sh% | xSh% | Sh%AE | %SA Rush | %SA Reb. |
|---|---|---|---|---|---|---|---|---|---|---|---|---|---|
| 2021-22 | BOS | 11 | 107:44 | 1.67 | 0.00 | 1.67 | 0.65 | 1.03 | 27.27 | 10.54 | 16.73 | 6.67 | 0.00 |
| 2022-23 | BOS | 2 | 17:31 | 0.00 | 0.00 | 0.00 | 0.84 | -0.84 | 0.00 | 8.14 | -8.14 | 0.00 | 0.00 |
| 2023-24 | BOS | 1 | 11:09 | 5.38 | 0.00 | 5.38 | 1.44 | 3.94 | 50.00 | 13.38 | 36.62 | 0.00 | 0.00 |
| 2024-25 | BOS | 12 | 108:40 | 1.10 | 0.00 | 1.10 | 0.65 | 0.46 | 15.38 | 9.02 | 6.36 | 5.56 | 11.11 |
| 2024-25 | NJD | 2 | 18:32 | 0.00 | 3.24 | 3.24 | 0.36 | -0.36 | - | - | - | 0.00 | 0.00 |
| 2024-25 | BOS, NJD | 14 | 127:12 | 0.94 | 0.47 | 1.42 | 0.61 | 0.34 | 15.38 | 9.88 | 5.50 | 5.26 | 10.53 |
| 2025-26 | NJD | 7 | 57:05 | 0.00 | 0.00 | 0.00 | 0.21 | -0.21 | - | - | - | 0.00 | 0.00 |
5v5 On Ice Stats
| Season | Team(s) | GP | TOI | SAF/60 | GF/60 | xGF/60 | SAA/60 | GA/60 | xGA/60 | GF% | xGF% | xGF Rel | xGA Rel | xGF% Rel |
|---|---|---|---|---|---|---|---|---|---|---|---|---|---|---|
| 2021-22 | BOS | 11 | 107:44 | 43.44 | 2.78 | 2.26 | 38.99 | 2.78 | 2.10 | 50.00 | 51.81 | -0.81 | -0.04 | -7.10 |
| 2022-23 | BOS | 2 | 17:31 | 34.25 | 0.00 | 2.41 | 65.08 | 3.43 | 4.88 | 0.00 | 33.09 | -1.17 | 1.77 | -20.45 |
| 2023-24 | BOS | 1 | 11:09 | 37.67 | 5.38 | 2.23 | 26.91 | 0.00 | 1.40 | 100.00 | 61.39 | 0.77 | -1.13 | 24.79 |
| 2024-25 | BOS | 12 | 108:40 | 34.23 | 1.66 | 1.82 | 35.89 | 2.21 | 1.80 | 42.86 | 50.26 | -0.93 | -0.36 | -5.64 |
| 2024-25 | NJD | 2 | 18:32 | 29.14 | 3.24 | 1.99 | 38.85 | 6.47 | 2.79 | 33.33 | 41.57 | -0.77 | 1.19 | -21.74 |
| 2024-25 | BOS, NJD | 14 | 127:12 | 33.49 | 1.89 | 1.85 | 36.32 | 2.83 | 1.95 | 40.00 | 48.67 | -0.90 | -0.14 | -8.18 |
| 2025-26 | NJD | 7 | 57:05 | 22.07 | 1.05 | 1.38 | 40.99 | 3.15 | 3.03 | 25.00 | 31.35 | -1.45 | 0.43 | -20.78 |
NHL Edge Stats
| Skating | Shooting | Zone Time | |||||||||||
|---|---|---|---|---|---|---|---|---|---|---|---|---|---|
| Season | GP | Top Speed | Bursts>20/mi | Avg. Speed | Top Speed | Avg. Speed | %Long Range | %Mid Range | %High Danger | ES DZ% | ES NZ% | ES OZ% | |
| This table is for Basic and Premium subscribers only. To view please login to and/or subscribe to one of our subscription plans. | |||||||||||||
Legend
| Percentile 0-25 | Percentile 25-50 | Percentile 50-75 | Percentile 75-100 |
5v5 Lines
| Season | Teammate | Teammate | Team | TOI | GF/60 | GA/60 | GF% | xGF/60 | xGA/60 | xGF% | xGF Rel | xGA Rel | xGF% Rel |
|---|
Glossary
| Type | Statistic | Definition |
|---|---|---|
| Individual | G/60 | Goals Against per 60 minutes. |
| Individual | A/60 | Assists per 60 minutes. |
| Individual | Pts/60 | Points per 60 minutes. |
| Individual | xG/60 | Expected Goals per 60 minutes. |
| Individual | GAE/60 | Goals Above Expected (G/60 - xG/60). |
| Individual | Sh% | Shooting Percentage. |
| Individual | xSh% | Expected Shooting Percentage. |
| Individual | Sh%AE | Shooting percentage above expected (Sh% - xSh%). |
| Individual | %SA Rush | Percentage of shot attempts determined to be on the rush. |
| Individual | %SA Reb. | Percentage of shot attempts determined to be from rebounds. |
| On Ice | SAF/60 | Shot Attempts For per 60 minutes. |
| On Ice | GF/60 | Goals For per 60 minutes. |
| On Ice | xGF/60 | Expected Goals For per 60 minutes. |
| On Ice | SAA/60 | Shot Attempts Against per 60 minutes (lower is better). |
| On Ice | GA/60 | Goals Against per 60 minutes (lower is better). |
| On Ice | xGA/60 | Expected Goals Against per 60 minutes (lower is better). |
| On Ice | GF% | Goals For Percentage = Goals For / (Goals For + Goals Against) |
| On Ice | xGF% | Expected Goals For Percentage = Expected Goals For / (Expected Goals For + Expected Goals Against) |
| On Ice | xGF Rel | xGF/60 when On Ice - xGF/60 when not On Ice. |
| On Ice | xGA Rel | xGA/60 when On Ice - xGA/60 when not On Ice (lower is better). |
| On Ice | xGF% Rel | xGF% when On Ice - xGF% when not On Ice. |
News and Opinions
-
New Jersey Devils UFA Forwards Profile: Brian Halonen and Marc McLaughlin at All About the Jersey (Thu May 7, 2026)
-
Devils Recall Brian Halonen and Marc McLaughlin at The Hockey Writers (Sat Apr 4, 2026)
-
Utica Weekly: Comets Sweep Belleville To End Week at Devils Army (Tue Mar 3, 2026)
-
Utica Weekly: Offensive Outburst Leads Comets To Split at Devils Army (Tue Feb 17, 2026)
-
Devils Place Marc McLaughlin on Waivers at The Hockey Writers (Wed Feb 11, 2026)
-
Utica Weekly: McLaughlin, Hardman Excel In Another Tough Week at Devils Army (Mon Mar 24, 2025)
-
Grading Every Trade The Devils Made Prior To The Deadline at Devils Army (Sat Mar 8, 2025)
Current Contract
Marc McLaughlin signed a $850,000 1-year contract with the New Jersey Devils and General Manager Tom Fitzgerald on July 1, 2026 with an AAV of $850,000. This contract will start in 2026-27 and end after the 2026-27 season. In the first season of the contract the cap hit was equivalent to 0.82% of the salary cap.
Standard Contract (UFA) ( ) (0 ratings)
Marc McLaughlin signed a $775,000 1-year contract with the New Jersey Devils and General Manager Tom Fitzgerald on June 30, 2025 with an AAV of $775,000. This contract will start in 2025-26 and end after the 2025-26 season. In the first season of the contract the cap hit was equivalent to 0.81% of the salary cap.
Standard Contract (UFA) ( ) (0 ratings)
| Season | Age* | Clause | Cap Hit | AAV | Perf. Bonus | Sign. Bonus | Salary | Compensation | Minors Salary | Status | |
|---|---|---|---|---|---|---|---|---|---|---|---|
| 2025-26 | 26 | $775,000 | $775,000 | - | - | $775,000 | $775,000 | $350,000 | UFA-Grp6 | ||
| Total | - | - | $775,000 | $775,000 | $350,000 |
Marc McLaughlin signed a $775,000 1-year contract with the Boston Bruins and General Manager Don Sweeney on July 17, 2024 with an AAV of $775,000. This contract will start in 2024-25 and end after the 2024-25 season. In the first season of the contract the cap hit was equivalent to 0.88% of the salary cap.
Standard Contract (RFA) ( ) (0 ratings)
| Season | Age* | Clause | Cap Hit | AAV | Perf. Bonus | Sign. Bonus | Salary | Compensation | Minors Salary | Status | |
|---|---|---|---|---|---|---|---|---|---|---|---|
| 2024-25 | 25 | $775,000 | $775,000 | - | - | $775,000 | $775,000 | $120,000 | RFA-arb | ||
| Total | - | - | $775,000 | $775,000 | $120,000 |
Marc McLaughlin signed a $1,767,500 2-year contract with the Boston Bruins and General Manager Don Sweeney on March 15, 2022 with an AAV of $883,750. This contract will start in 2021-22 and end after the 2022-23 season. In the first season of the contract the cap hit was equivalent to 1.08% of the salary cap.
Entry Level Contract ( ) (0 ratings)
| Season | Age* | Clause | Cap Hit | AAV | Perf. Bonus | Sign. Bonus | Salary | Compensation | Minors Salary | Status | |
|---|---|---|---|---|---|---|---|---|---|---|---|
| 2021-22 | 22 | $883,750 | $925,000 | $82,500 | $92,500 | $750,000 | $842,500 | $80,000 | ELC | ||
| 2022-23 | 23 | $883,750 | $925,000 | - | $92,500 | $832,500 | $925,000 | $80,000 | ELC | ||
| Total | $82,500 | $185,000 | $1,582,500 | $1,767,500 | $160,000 |
Career Statistics
| Regular Season | Playoffs | |||||||||||||||||||
|---|---|---|---|---|---|---|---|---|---|---|---|---|---|---|---|---|---|---|---|---|
| Season | League | Team | GP | G | A | Pts | +/- | PIM | Shots | Sh% | TOI/G | GP | G | A | Pts | +/- | PIM | Shots | Sh% | TOI/G |
| 2011-12 | QC Int PW | Providence Capitals Peewee | 2 | 1 | 1 | 2 | ||||||||||||||
| 2014-15 | USHS-Prep | Cushing Academy | 33 | 13 | 9 | 22 | ||||||||||||||
| 2014-15 | MHSL U16 | NV River Rats 16U AAA National | 14 | 5 | 10 | 15 | 4 | |||||||||||||
| 2014-15 | USA-S15 | Team Blue | 5 | 1 | 3 | 4 | ||||||||||||||
| 2015-16 | USHS-Prep | Cushing Academy | 33 | 24 | 19 | 43 | ||||||||||||||
| 2015-16 | MHSL U16 | Cape Cod Whalers 16U AAA | 10 | 0 | 0 | 0 | ||||||||||||||
| 2015-16 | USA-S16 | Team Orange | 5 | 0 | 5 | 5 | ||||||||||||||
| 2016-17 | USHL | Cedar Rapids RoughRiders | 60 | 4 | 12 | 16 | -33 | 45 | ||||||||||||
| 2016-17 | USA-S17 | Team Black | 5 | 2 | 2 | 4 | ||||||||||||||
| 2017-18 | USHL | Cedar Rapids RoughRiders | 21 | 10 | 10 | 20 | 33 | |||||||||||||
| 2018-19 | NCAA | Boston College | 39 | 4 | 4 | 8 | -4 | 20 | ||||||||||||
| 2019-20 | NCAA | Boston College | 34 | 5 | 7 | 12 | +8 | 14 | ||||||||||||
| 2020-21 | NCAA | Boston College | 24 | 10 | 14 | 24 | +16 | 6 | ||||||||||||
| 2021-22 | NCAA | Boston College | 33 | 21 | 11 | 32 | +10 | 22 | ||||||||||||
| 2021-22 | NHL | Boston Bruins | 11 | 3 | 0 | 3 | -1 | 8 | 12 | 25.0 | 10:29 | |||||||||
| 2021-22 | OG | USA | 2 | 0 | 0 | 0 | ||||||||||||||
| 2021-22 | AHL | Providence Bruins | 1 | 0 | 0 | 0 | -1 | 2 | -2 | |||||||||||
| 2022-23 | NHL | Boston Bruins | 2 | 0 | 0 | 0 | -1 | 2 | 3 | 0.0 | 10:04 | |||||||||
| 2022-23 | AHL | Providence Bruins | 66 | 13 | 17 | 30 | +2 | 45 | 2 | -1 | ||||||||||
| 2023-24 | NHL | Boston Bruins | 1 | 1 | 0 | 1 | +1 | 2 | 50.0 | 12:39 | ||||||||||
| 2023-24 | AHL | Providence Bruins | 68 | 8 | 6 | 14 | -7 | 24 | 4 | 1 | 1 | |||||||||
| 2024-25 | AHL | Providence Bruins | 34 | 5 | 9 | 14 | +1 | 16 | ||||||||||||
| 2024-25 | AHL | Utica Comets | 16 | 0 | 6 | 6 | +5 | 11 | ||||||||||||
| 2024-25 | NHL | Boston Bruins | 12 | 2 | 0 | 2 | -1 | 13 | 15.4 | 9:12 | ||||||||||
| 2024-25 | NHL | New Jersey Devils | 2 | 0 | 1 | 1 | -1 | 0.0 | 9:16 | |||||||||||
| 2025-26 | AHL | Utica Comets | 23 | 6 | 8 | 14 | +4 | 6 | ||||||||||||
| 2025-26 | NHL | New Jersey Devils | 7 | 0 | 0 | 0 | -2 | 0.0 | 8:12 | |||||||||||
| NHL Career | 35 | 6 | 1 | 7 | -5 | 10 | 30 | 20.0 | 9:33 | |||||||||||