
Kevin Hayes
| Position | Center / Right Wing | Current Team | |
| Shoots | Left | Current Contract | |
| Height | 6'3" | Expires | |
| Weight (lbs) | 217 | Expiry Age (Jun 30) | |
| Age (DOB) | 34 (May 8, 1992) | Expiry Status | |
| Drafted | 2010, Round 1, Overall 24 (CHI) |
| Date | Team | Transaction | |
|---|---|---|---|
| Nov 8, 2025 | Pittsburgh Penguins | Activated from IR | |
| Oct 6, 2025 | Pittsburgh Penguins | Placed on IR | |
| Nov 23, 2024 | Pittsburgh Penguins | Activated from IR | |
| Nov 11, 2024 | Pittsburgh Penguins | Placed on IR | |
| Jun 18, 2019 | Philadelphia Flyers | Signed 7 years @ $7.143M AAV starting in 2019-20 | |
| Jul 30, 2018 | New York Rangers | Signed 1 year @ $5.175M AAV starting in 2018-19 | |
| Jun 22, 2016 | New York Rangers | Signed 2 years @ $2.600M AAV starting in 2016-17 | |
| Aug 20, 2014 | New York Rangers | Signed to an entry level contract. |
Player Card(s)

URL: https://thestanleycap.com/cdn/player_cards/20252026/kevin-hayes-8475763.png
URL: https://thestanleycap.com/cdn/player_cards/20242025/kevin-hayes-8475763.png
URL: https://thestanleycap.com/cdn/player_cards/20232024/kevin-hayes-8475763.png
About Player Cards
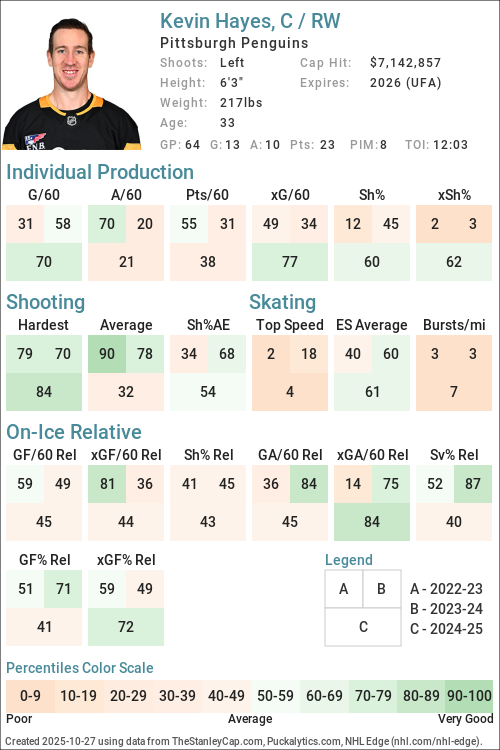
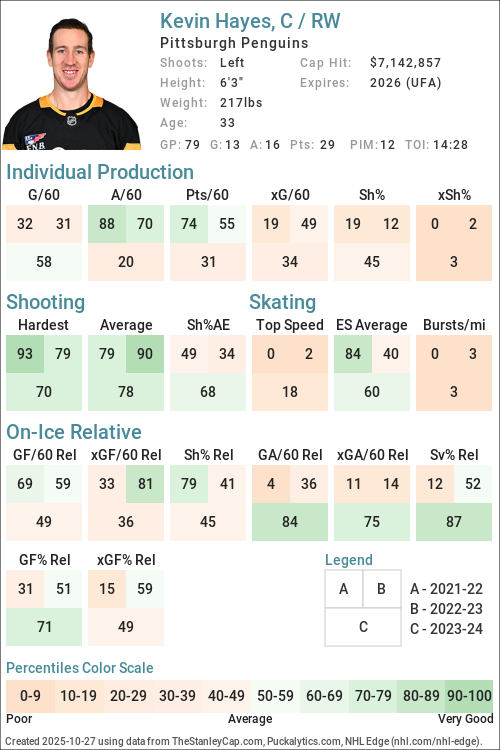
Player cards present an infographic of a players performance using a series of Player Archetypes developed for Puckalytics.com and TheStanleyCap.com. The boxes in the rink image show the archetype ratings for the season specified in the card while the graphs to the right show the five-year trends for those archetypes.
Except for Faceoffs, the values shown are the players z-score (standard deviation from the mean) for the specific metric used to calculate the archetype values. When calculating z-scores forwards were compared to forwards and defensemen were compared to defensemen. Positive values indicate the player is above average and shaded in blue, while negative values indicate the player is below average and shaded in pink. The five year trend charts show a range of -4.0 to 4.0.
The value shown for Faceoffs is the faceoff winning percentage rather than their z-score with winning percentages below 50 in pink shades and above 50 in blue shades.
All archetypes are 5v5 except 5v4 TOI, 4v5 TOI, Skating (even strength) and Faceoffs (all situations). Archetypes use regular season data only.
Archetypes Summary
- Sniper - Measures the to score above the expected goal rate.
- Rebound - Measures the percent of a players shot attempts that come from rebounds (forwards only).
- 5v4 TOI - Powerplay ice time, calculated as the percentage of his teams 5v4 ice time that the player was on the ice for.
- Shooter - Measures whether a players points come from shots (goals or assists on rebounds from his shots).
- Producer - Measures a players ability to produce goals and assists, adjusted for quality of teammates.
- Playmaker - Measures whether a players points come from passes.
- Drive - Measures a players ability to drive puck possession and generate shot attempts for his team.
- Rush - Measures the percent of a players shot attempts that come from rush plays
- Possession - An indicator of a players ability to improve his teams puck possession game.
- Faceoffs - Faceoff Winning Percentage (min. 75 faceoffs taken).
- 5v5 TOI - The percentage of his teams 5v5 TOI that the player was on the ice for.
- Suppress - Measures a players ability to suppress opponent puck possession and shot attempts against.
- Skating - An indicator of a players skating ability, or speed bursts above 20mph per mile skated.
- Defend - An indicator of a players ability to suppress shot quality against.
- 4v5 TOI - Penalty Kill ice time, calculated as the percentage of his teams 4v5 ice time that the player was on the ice for.
Data Sources
- Salary data is from TheStanleyCap.com
- Skating data is from NHL Edge
- Other statistics are from Puckalytics.com and derived from data from NHL.com
Terms of Use
You are free to use include player cards in written articles, share on social media, or on other public websites under the following conditions:
- You credit TheStanleyCap.com as the source and provide a link back to TheStanleyCap.com or this player page.
- You do not mass copy/duplicate/publish dozens or hundreds of player cards. A few, or a handful for a written article is fine. Be reasonable. Fair use rules apply.
- If you are a high-traffic website you must download and host the image(s) on your site rather than overload TheStanleyCap servers with traffic.
Note: Player cards will update daily throughout the season so if you want to include snapshot then you must download the image.
If you have any questions, send an e-mail to the e-mail address at the top of this page.
Read Introducing Player Archetypes on HockeyAnalysis.com for more details on archetype calculations.
Core Archetypes
| Season | Team(s) | GP | TOI | Producer | Playmaker | Shooter | Sniper | Rebound | Rush | Skating | Defend |
|---|---|---|---|---|---|---|---|---|---|---|---|
| 2015-16 | NYR | 78 | 0.80 | 0.44 | 0.29 | 0.32 | -0.99 | -0.02 | - | 0.62 | |
| 2016-17 | NYR | 76 | -0.04 | -0.33 | 0.14 | 0.75 | -1.31 | 0.82 | - | -0.38 | |
| 2017-18 | NYR | 76 | 0.77 | -0.43 | 1.57 | 1.28 | -0.84 | 0.18 | - | 1.01 | |
| 2018-19 | NYR, WPG | 71 | 1.46 | 2.39 | -0.42 | -0.01 | 0.35 | -0.70 | - | -0.73 | |
| 2019-20 | PHI | 69 | -0.02 | -0.61 | 0.46 | -0.00 | -0.81 | 0.84 | - | -1.33 | |
| 2020-21 | PHI | 55 | 0.30 | 0.05 | 0.14 | -0.25 | -0.08 | -0.99 | - | 1.53 | |
| 2021-22 | PHI | 48 | 0.70 | 1.35 | -0.45 | -0.13 | -1.35 | 0.61 | -1.46 | -1.14 | |
| 2022-23 | PHI | 81 | 0.17 | 0.42 | -0.42 | -0.45 | 0.30 | -1.25 | -1.28 | 0.04 | |
| 2023-24 | STL | 79 | -0.56 | -0.97 | 0.20 | 0.49 | -0.06 | -0.70 | -1.30 | 1.08 | |
| 2024-25 | PIT | 64 | -0.38 | -0.94 | 0.54 | 0.27 | 0.60 | -0.99 | -1.19 | -0.21 | |
| 2025-26 | PIT | 28 | -0.65 | -0.97 | 0.03 | -0.16 | -0.80 | 1.88 | -1.12 | -1.51 |
Situational and Secondary Archetypes
| Season | Team(s) | GP | TOI | 5v5 TOI | 5v4 TOI | 4v5 TOI | Possession | Drive | Suppress | Faceoffs |
|---|---|---|---|---|---|---|---|---|---|---|
| 2015-16 | NYR | 78 | -0.38 | -0.18 | -1.94 | 0.70 | 0.47 | 0.61 | 36.0 | |
| 2016-17 | NYR | 76 | 0.34 | -0.45 | 0.40 | -1.63 | -1.26 | -1.22 | 45.7 | |
| 2017-18 | NYR | 76 | 0.55 | -0.91 | 1.34 | -0.29 | -0.16 | -0.34 | 50.5 | |
| 2018-19 | NYR, WPG | 71 | 0.54 | 0.22 | 0.63 | 1.36 | 0.75 | 1.09 | 49.2 | |
| 2019-20 | PHI | 69 | 0.60 | -0.55 | 0.88 | -0.68 | -0.32 | -0.75 | 50.2 | |
| 2020-21 | PHI | 55 | 0.37 | 0.47 | -0.16 | -0.48 | 0.30 | -1.33 | 49.0 | |
| 2021-22 | PHI | 48 | 0.64 | 0.53 | -0.49 | -0.98 | -0.39 | -1.41 | 42.8 | |
| 2022-23 | PHI | 81 | 0.92 | 0.67 | -1.73 | 0.85 | 1.34 | -0.59 | 49.4 | |
| 2023-24 | STL | 79 | 0.02 | -0.45 | -1.70 | -0.12 | -0.09 | -0.12 | 57.0 | |
| 2024-25 | PIT | 64 | -1.72 | -0.10 | -1.58 | 0.37 | 0.27 | 0.22 | 52.1 | |
| 2025-26 | PIT | 28 | -0.63 | -0.79 | -1.98 | 0.04 | -0.44 | 0.60 | 40.3 |
5v5 Individual Stats
| Season | Team(s) | GP | TOI | G/60 | A/60 | Pts/60 | xG/60 | GAE/60 | Sh% | xSh% | Sh%AE | %SA Rush | %SA Reb. |
|---|---|---|---|---|---|---|---|---|---|---|---|---|---|
| 2015-16 | NYR | 78 | 896:23 | 0.67 | 1.20 | 1.87 | 0.62 | 0.05 | 9.90 | 9.18 | 0.72 | 4.00 | 2.67 |
| 2016-17 | NYR | 76 | 964:28 | 0.75 | 0.81 | 1.56 | 0.58 | 0.17 | 11.22 | 8.70 | 2.51 | 5.71 | 2.14 |
| 2017-18 | NYR | 76 | 1001:42 | 0.96 | 0.96 | 1.92 | 0.62 | 0.34 | 12.21 | 7.88 | 4.33 | 4.32 | 3.09 |
| 2018-19 | WPG | 20 | 245:20 | 0.73 | 1.71 | 2.45 | 0.58 | 0.15 | 10.71 | 8.53 | 2.18 | 8.57 | 5.71 |
| 2018-19 | NYR | 51 | 689:52 | 0.61 | 1.57 | 2.17 | 0.68 | -0.07 | 8.75 | 9.78 | -1.03 | 0.88 | 6.14 |
| 2018-19 | NYR, WPG | 71 | 935:12 | 0.64 | 1.60 | 2.25 | 0.66 | -0.01 | 9.26 | 9.46 | -0.20 | 2.68 | 6.04 |
| 2019-20 | PHI | 69 | 891:47 | 0.74 | 0.81 | 1.55 | 0.75 | -0.01 | 9.32 | 9.45 | -0.13 | 5.66 | 3.77 |
| 2020-21 | PHI | 55 | 695:31 | 0.69 | 0.95 | 1.64 | 0.76 | -0.07 | 8.79 | 9.74 | -0.94 | 1.61 | 5.65 |
| 2021-22 | PHI | 48 | 643:28 | 0.56 | 1.49 | 2.05 | 0.60 | -0.04 | 6.74 | 7.27 | -0.52 | 5.22 | 2.61 |
| 2022-23 | PHI | 81 | 1124:21 | 0.53 | 1.17 | 1.71 | 0.73 | -0.20 | 5.95 | 8.15 | -2.19 | 1.29 | 8.19 |
| 2023-24 | STL | 79 | 970:14 | 0.74 | 0.62 | 1.36 | 0.59 | 0.15 | 9.60 | 7.66 | 1.94 | 2.41 | 7.83 |
| 2024-25 | PIT | 64 | 602:47 | 0.80 | 0.60 | 1.39 | 0.74 | 0.06 | 11.43 | 10.55 | 0.88 | 0.91 | 9.09 |
| 2025-26 | PIT | 28 | 309:04 | 0.78 | 0.78 | 1.55 | 0.88 | -0.11 | 9.76 | 11.09 | -1.34 | 5.56 | 5.56 |
5v5 On Ice Stats
| Season | Team(s) | GP | TOI | SAF/60 | GF/60 | xGF/60 | SAA/60 | GA/60 | xGA/60 | GF% | xGF% | xGF Rel | xGA Rel | xGF% Rel |
|---|---|---|---|---|---|---|---|---|---|---|---|---|---|---|
| 2015-16 | NYR | 78 | 896:23 | 39.63 | 2.68 | 2.40 | 40.36 | 1.61 | 2.43 | 62.50 | 49.67 | 0.22 | -0.02 | 2.62 |
| 2016-17 | NYR | 76 | 964:28 | 34.84 | 2.49 | 2.08 | 44.36 | 2.61 | 2.59 | 48.78 | 44.48 | -0.28 | 0.32 | -6.42 |
| 2017-18 | NYR | 76 | 1001:42 | 40.01 | 2.58 | 2.47 | 48.34 | 2.46 | 2.89 | 51.19 | 46.07 | 0.05 | 0.20 | -1.31 |
| 2018-19 | WPG | 20 | 245:20 | 44.51 | 2.93 | 2.34 | 45.73 | 2.93 | 2.68 | 50.00 | 46.62 | 0.33 | 0.27 | 1.12 |
| 2018-19 | NYR | 51 | 689:52 | 40.09 | 2.78 | 2.60 | 40.44 | 2.35 | 2.23 | 54.24 | 53.75 | 0.29 | -0.52 | 8.22 |
| 2018-19 | NYR, WPG | 71 | 935:12 | 41.25 | 2.82 | 2.53 | 41.83 | 2.50 | 2.35 | 53.01 | 51.82 | 0.31 | -0.30 | 6.30 |
| 2019-20 | PHI | 69 | 891:47 | 39.63 | 2.22 | 2.40 | 40.84 | 2.96 | 2.45 | 42.86 | 49.53 | -0.04 | 0.13 | -1.80 |
| 2020-21 | PHI | 55 | 695:31 | 41.24 | 2.16 | 2.47 | 41.32 | 2.33 | 2.36 | 48.08 | 51.09 | 0.26 | 0.08 | 1.95 |
| 2021-22 | PHI | 48 | 643:28 | 38.14 | 2.80 | 2.31 | 49.33 | 3.73 | 2.96 | 42.86 | 43.84 | -0.07 | 0.22 | -2.61 |
| 2022-23 | PHI | 81 | 1124:21 | 45.20 | 2.40 | 2.67 | 43.76 | 2.72 | 2.84 | 46.88 | 48.46 | 0.37 | 0.23 | 1.60 |
| 2023-24 | STL | 79 | 970:14 | 37.54 | 2.23 | 2.04 | 46.44 | 2.16 | 2.65 | 50.70 | 43.47 | -0.18 | -0.20 | -0.28 |
| 2024-25 | PIT | 64 | 602:47 | 43.30 | 2.19 | 2.48 | 41.61 | 2.89 | 2.27 | 43.14 | 52.20 | -0.01 | -0.34 | 3.37 |
| 2025-26 | PIT | 28 | 309:04 | 40.19 | 3.11 | 2.95 | 37.66 | 3.11 | 2.37 | 50.00 | 55.51 | 0.34 | -0.22 | 5.33 |
NHL Edge Stats
| Skating | Shooting | Zone Time | |||||||||||
|---|---|---|---|---|---|---|---|---|---|---|---|---|---|
| Season | GP | Top Speed | Bursts>20/mi | Avg. Speed | Top Speed | Avg. Speed | %Long Range | %Mid Range | %High Danger | ES DZ% | ES NZ% | ES OZ% | |
| This table is for Basic and Premium subscribers only. To view please login to and/or subscribe to one of our subscription plans. | |||||||||||||
Legend
| Percentile 0-25 | Percentile 25-50 | Percentile 50-75 | Percentile 75-100 |
5v5 Lines
| Season | Teammate | Teammate | Team | TOI | GF/60 | GA/60 | GF% | xGF/60 | xGA/60 | xGF% | xGF Rel | xGA Rel | xGF% Rel |
|---|
Glossary
| Type | Statistic | Definition |
|---|---|---|
| Individual | G/60 | Goals Against per 60 minutes. |
| Individual | A/60 | Assists per 60 minutes. |
| Individual | Pts/60 | Points per 60 minutes. |
| Individual | xG/60 | Expected Goals per 60 minutes. |
| Individual | GAE/60 | Goals Above Expected (G/60 - xG/60). |
| Individual | Sh% | Shooting Percentage. |
| Individual | xSh% | Expected Shooting Percentage. |
| Individual | Sh%AE | Shooting percentage above expected (Sh% - xSh%). |
| Individual | %SA Rush | Percentage of shot attempts determined to be on the rush. |
| Individual | %SA Reb. | Percentage of shot attempts determined to be from rebounds. |
| On Ice | SAF/60 | Shot Attempts For per 60 minutes. |
| On Ice | GF/60 | Goals For per 60 minutes. |
| On Ice | xGF/60 | Expected Goals For per 60 minutes. |
| On Ice | SAA/60 | Shot Attempts Against per 60 minutes (lower is better). |
| On Ice | GA/60 | Goals Against per 60 minutes (lower is better). |
| On Ice | xGA/60 | Expected Goals Against per 60 minutes (lower is better). |
| On Ice | GF% | Goals For Percentage = Goals For / (Goals For + Goals Against) |
| On Ice | xGF% | Expected Goals For Percentage = Expected Goals For / (Expected Goals For + Expected Goals Against) |
| On Ice | xGF Rel | xGF/60 when On Ice - xGF/60 when not On Ice. |
| On Ice | xGA Rel | xGA/60 when On Ice - xGA/60 when not On Ice (lower is better). |
| On Ice | xGF% Rel | xGF% when On Ice - xGF% when not On Ice. |
News and Opinions
-
2025-26 Season in Review: Avery Hayes at Yahoo Sports NHL (Tue Jun 9, 2026)
-
2025-26 Season in Review: Avery Hayes at Pens Burgh (Tue Jun 9, 2026)
-
2025-26 Season in Review: Kevin Hayes at Pens Burgh (Wed Jun 3, 2026)
-
Breaking Down the Penguins’ 2026 Unrestricted Free Agent Class at The Hockey Writers (Mon May 25, 2026)
-
Comparing this year’s Flyers lineup to the last time they were in the playoffs at Broad Street Hockey (Thu Apr 16, 2026)
-
Penguins/Blues Recap: Pens fall 7-5 to end regular season at Yahoo Sports NHL (Wed Apr 15, 2026)
-
Which depth players helped or hurt their causes over the weekend? at Pens Burgh (Mon Apr 13, 2026)
-
Which depth players helped or hurt their causes over the weekend? at Yahoo Sports NHL (Mon Apr 13, 2026)
-
Penguins Notebook: Erik Karlsson Returns To Practice, Avery Hayes On The Top Line at Yahoo Sports NHL (Tue Feb 24, 2026)
-
Takeaways: Led By Rookies, Penguins Earn Convincing Win Over Sabres at Yahoo Sports NHL (Fri Feb 6, 2026)
-
Penguins/Sabres Recap: Avery Hayes, Ben Kindel each score, Pens win big in Buffalo at Yahoo Sports NHL (Thu Feb 5, 2026)
-
Penguins/Sabres Recap: Avery Hayes, Ben Kindel each score, Pens win big in Buffalo at Pens Burgh (Thu Feb 5, 2026)
-
Projecting the Penguins’ 2025-26 roster at Pens Burgh (Tue Sep 30, 2025)
-
Former Rangers forward will miss start of Penguins season after camp injury at Forever Blueshirts (Sat Sep 20, 2025)
-
Kevin Hayes hurt, out at least a month at Pens Burgh (Sat Sep 20, 2025)
-
What Role Will Kevin Hayes Have On The Penguins This Year? at Yahoo Sports NHL (Mon Aug 25, 2025)
-
What Role Will Kevin Hayes Have On The Penguins This Year? at Yahoo Sports (Mon Aug 25, 2025)
-
3 Forwards Not Named Rust Or Rakell That The Penguins Should Shop This Summer at Yahoo Sports (Mon Jul 28, 2025)
Current Contract
Player does not currently have a contract.Kevin Hayes signed a $50,000,000 7-year contract with the Philadelphia Flyers and General Manager Chuck Fletcher on June 18, 2019 with an AAV of $7,142,857. This contract will start in 2019-20 and end after the 2025-26 season. In the first season of the contract the cap hit was equivalent to 8.76% of the salary cap.
Standard Contract (UFA) ( ) (0 ratings)
| Season | Age* | Clause | Cap Hit | AAV | Perf. Bonus | Sign. Bonus | Salary | Compensation | Minors Salary | Status | |
|---|---|---|---|---|---|---|---|---|---|---|---|
| 2019-20 | 27 | NMC | $7,142,857 | $7,142,857 | - | $5,000,000 | $4,000,000 | $9,000,000 | $9,000,000 | UFA | |
| 2020-21 | 28 | NMC | $7,142,857 | $7,142,857 | - | $3,750,000 | $3,750,000 | $7,500,000 | $7,500,000 | UFA | |
| 2021-22 | 29 | NMC | $7,142,857 | $7,142,857 | - | - | $9,000,000 | $9,000,000 | $9,000,000 | UFA | |
| 2022-23 | 30 | M-NTC | $7,142,857 | $7,142,857 | - | $3,750,000 | $3,750,000 | $7,500,000 | $7,500,000 | UFA | |
| 2023-24 | 31 | M-NTC | $7,142,857 | $7,142,857 | - | - | $6,500,000 | $6,500,000 | $6,500,000 | UFA | |
| 2024-25 | 32 | M-NTC | $7,142,857 | $7,142,857 | - | $1,250,000 | $4,000,000 | $5,250,000 | $5,250,000 | UFA | |
| 2025-26 | 33 | M-NTC | $7,142,857 | $7,142,857 | - | $1,250,000 | $4,000,000 | $5,250,000 | $5,250,000 | UFA | |
| Total | - | $15,000,000 | $35,000,000 | $50,000,000 | $50,000,000 |
Kevin Hayes signed a $5,175,000 1-year contract with the New York Rangers and General Manager Jeff Gorton on July 30, 2018 with an AAV of $5,175,000. This contract will start in 2018-19 and end after the 2018-19 season. In the first season of the contract the cap hit was equivalent to 6.51% of the salary cap.
Standard Contract (RFA) ( ) (0 ratings)
| Season | Age* | Clause | Cap Hit | AAV | Perf. Bonus | Sign. Bonus | Salary | Compensation | Minors Salary | Status | |
|---|---|---|---|---|---|---|---|---|---|---|---|
| 2018-19 | 26 | $5,175,000 | $5,175,000 | - | - | $5,175,000 | $5,175,000 | $5,175,000 | RFA-arb | ||
| Total | - | - | $5,175,000 | $5,175,000 | $5,175,000 |
Kevin Hayes signed a $5,200,000 2-year contract with the New York Rangers and General Manager Jeff Gorton on June 22, 2016 with an AAV of $2,600,000. This contract will start in 2016-17 and end after the 2017-18 season. In the first season of the contract the cap hit was equivalent to 3.56% of the salary cap.
Standard Contract (RFA) ( ) (0 ratings)
| Season | Age* | Clause | Cap Hit | AAV | Perf. Bonus | Sign. Bonus | Salary | Compensation | Minors Salary | Status | |
|---|---|---|---|---|---|---|---|---|---|---|---|
| 2016-17 | 24 | $2,600,000 | $2,600,000 | - | $500,000 | $2,100,000 | $2,600,000 | $2,600,000 | RFA-arb | ||
| 2017-18 | 25 | $2,600,000 | $2,600,000 | - | - | $2,600,000 | $2,600,000 | $2,600,000 | RFA-arb | ||
| Total | - | $500,000 | $4,700,000 | $5,200,000 | $5,200,000 |
Kevin Hayes signed a $1,800,000 2-year contract with the New York Rangers and General Manager Glen Sather on August 20, 2014 with an AAV of $900,000. This contract will start in 2014-15 and end after the 2015-16 season. In the first season of the contract the cap hit was equivalent to 1.30% of the salary cap.
Entry Level Contract ( ) (0 ratings)
| Season | Age* | Clause | Cap Hit | AAV | Perf. Bonus | Sign. Bonus | Salary | Compensation | Minors Salary | Status | |
|---|---|---|---|---|---|---|---|---|---|---|---|
| 2014-15 | 22 | $900,000 | $3,750,000 | $2,850,000 | $90,000 | $810,000 | $900,000 | $67,500 | ELC | ||
| 2015-16 | 23 | $900,000 | $3,750,000 | $2,850,000 | $90,000 | $810,000 | $900,000 | $67,500 | ELC | ||
| Total | $5,700,000 | $180,000 | $1,620,000 | $1,800,000 | $135,000 |
Career Statistics
| Regular Season | Playoffs | |||||||||||||||||||
|---|---|---|---|---|---|---|---|---|---|---|---|---|---|---|---|---|---|---|---|---|
| Season | League | Team | GP | G | A | Pts | +/- | PIM | Shots | Sh% | TOI/G | GP | G | A | Pts | +/- | PIM | Shots | Sh% | TOI/G |
| 2007-08 | High-MA | Nobles | 29 | 8 | 5 | 13 | 2 | |||||||||||||
| 2008-09 | High-MA | Nobles | 23 | 28 | 27 | 55 | 15 | |||||||||||||
| 2009-10 | High-MA | Nobles | 29 | 25 | 44 | 69 | 8 | |||||||||||||
| 2009-10 | Minor-MA | Cape Cod | 25 | 21 | 30 | 51 | ||||||||||||||
| 2009-10 | U-18 | USNTDP | 2 | 2 | 0 | 2 | ||||||||||||||
| 2010-11 | H-East | Boston College | 31 | 4 | 10 | 14 | 8 | |||||||||||||
| 2011-12 | H-East | Boston College | 44 | 7 | 21 | 28 | 10 | |||||||||||||
| 2012-13 | H-East | Boston College | 27 | 6 | 19 | 25 | 14 | |||||||||||||
| 2013-14 | H-East | Boston College | 40 | 27 | 38 | 65 | 16 | |||||||||||||
| 2013-14 | WC-A | USA | 7 | 1 | 1 | 2 | -2 | 10 | ||||||||||||
| 2014-15 | NHL | New York Rangers | 79 | 17 | 28 | 45 | +15 | 22 | 111 | 15.3 | 13:02 | 19 | 2 | 5 | 7 | -3 | 2 | 25 | 8.0 | 14:13 |
| 2015-16 | NHL | New York Rangers | 79 | 14 | 22 | 36 | +4 | 30 | 133 | 10.5 | 13:40 | 3 | -1 | 4 | 3 | 0.0 | 10:49 | |||
| 2016-17 | WC | USA | 3 | 2 | 2 | 4 | +4 | 4 | ||||||||||||
| 2016-17 | NHL | New York Rangers | 76 | 17 | 32 | 49 | +10 | 18 | 143 | 11.9 | 16:34 | 12 | 3 | 3 | 4 | 21 | 0.0 | 17:44 | ||
| 2017-18 | NHL | New York Rangers | 76 | 25 | 19 | 44 | +1 | 18 | 172 | 14.5 | 17:21 | |||||||||
| 2018-19 | NHL | New York Rangers | 51 | 14 | 28 | 42 | +1 | 10 | 119 | 11.8 | 19:27 | |||||||||
| 2018-19 | NHL | Winnipeg Jets | 20 | 5 | 8 | 13 | -3 | 2 | 37 | 13.5 | 15:17 | 6 | 2 | 1 | 3 | +2 | 2 | 10 | 20.0 | 11:59 |
| 2019-20 | NHL | Philadelphia Flyers | 69 | 23 | 18 | 41 | -6 | 34 | 175 | 13.1 | 17:44 | 16 | 4 | 9 | 13 | +7 | 2 | 44 | 9.1 | 18:35 |
| 2020-21 | NHL | Philadelphia Flyers | 55 | 12 | 19 | 31 | -2 | 22 | 127 | 9.4 | 17:31 | |||||||||
| 2021-22 | NHL | Philadelphia Flyers | 48 | 10 | 21 | 31 | -20 | 26 | 126 | 7.9 | 17:55 | |||||||||
| 2022-23 | NHL | Philadelphia Flyers | 81 | 18 | 36 | 54 | -22 | 23 | 209 | 8.6 | 17:34 | |||||||||
| 2023-24 | NHL | St. Louis Blues | 79 | 13 | 16 | 29 | 12 | 153 | 8.5 | 14:28 | ||||||||||
| 2024-25 | NHL | Pittsburgh Penguins | 64 | 13 | 10 | 23 | -15 | 8 | 98 | 13.3 | 12:03 | |||||||||
| 2025-26 | NHL | Pittsburgh Penguins | 28 | 4 | 4 | 8 | -1 | 8 | 45 | 8.9 | 12:28 | |||||||||
| NHL Career | 805 | 185 | 261 | 446 | -38 | 233 | 1648 | 11.2 | 15:48 | 56 | 8 | 18 | 26 | +5 | 14 | 103 | 7.8 | 15:48 | ||