
 K'Andre Miller
| Position | Left Defense | Current Team | Carolina Hurricanes |
| Shoots | Left | Current Contract | 8 years ($7.5M CapHit) |
| Height | 6'5" | Expires | 2032-33 |
| Weight (lbs) | 210 | Expiry Age (Jun 30) | 33 |
| Age (DOB) | 26 (Jan 21, 2000) | Expiry Status | UFA |
| Drafted | 2018, Round 1, Overall 22 (NYR) |
| Date | Team | Transaction | |
|---|---|---|---|
| Nov 6, 2025 | Carolina Hurricanes | Activated from IR | |
| Oct 31, 2025 | Carolina Hurricanes | Placed on IR | |
| Jul 1, 2025 | Carolina Hurricanes | Acquired from New York Rangers | |
| Jul 1, 2025 | New York Rangers | Traded to Carolina Hurricanes | |
| Jul 1, 2025 | New York Rangers | Signed 8 years @ $7.500M AAV starting in 2025-26 | |
| Dec 27, 2024 | New York Rangers | Activated from IR | |
| Dec 13, 2024 | New York Rangers | Placed on IR | |
| Jul 11, 2023 | New York Rangers | Signed 2 years @ $3.872M AAV starting in 2023-24 | |
| Mar 13, 2020 | New York Rangers | Signed to an entry level contract. |
Player Card(s)
URL: https://thestanleycap.com/cdn/player_cards/20252026/k-andre-miller-8480817.png

URL: https://thestanleycap.com/cdn/player_cards/20242025/k-andre-miller-8480817.png

URL: https://thestanleycap.com/cdn/player_cards/20232024/k-andre-miller-8480817.png
About Player Cards
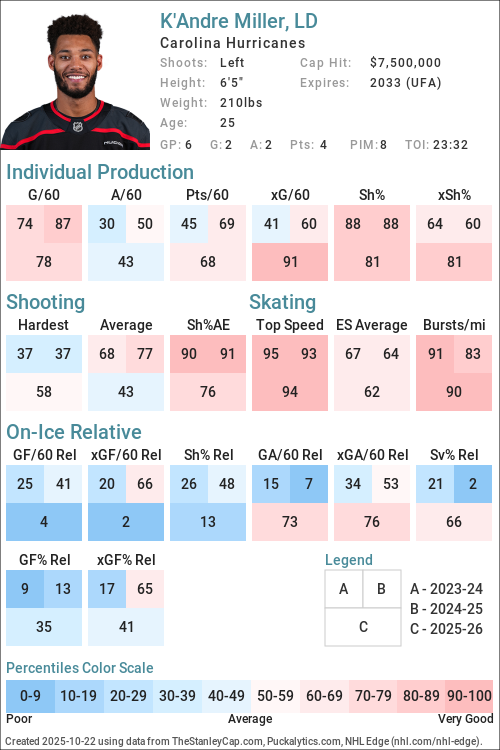
Player cards present an infographic of a players performance using a series of Player Archetypes developed for Puckalytics.com and TheStanleyCap.com. The boxes in the rink image show the archetype ratings for the season specified in the card while the graphs to the right show the five-year trends for those archetypes.
Except for Faceoffs, the values shown are the players z-score (standard deviation from the mean) for the specific metric used to calculate the archetype values. When calculating z-scores forwards were compared to forwards and defensemen were compared to defensemen. Positive values indicate the player is above average and shaded in blue, while negative values indicate the player is below average and shaded in pink. The five year trend charts show a range of -4.0 to 4.0.
The value shown for Faceoffs is the faceoff winning percentage rather than their z-score with winning percentages below 50 in pink shades and above 50 in blue shades.
All archetypes are 5v5 except 5v4 TOI, 4v5 TOI, Skating (even strength) and Faceoffs (all situations). Archetypes use regular season data only.
Archetypes Summary
- Sniper - Measures the to score above the expected goal rate.
- Rebound - Measures the percent of a players shot attempts that come from rebounds (forwards only).
- 5v4 TOI - Powerplay ice time, calculated as the percentage of his teams 5v4 ice time that the player was on the ice for.
- Shooter - Measures whether a players points come from shots (goals or assists on rebounds from his shots).
- Producer - Measures a players ability to produce goals and assists, adjusted for quality of teammates.
- Playmaker - Measures whether a players points come from passes.
- Drive - Measures a players ability to drive puck possession and generate shot attempts for his team.
- Rush - Measures the percent of a players shot attempts that come from rush plays
- Possession - An indicator of a players ability to improve his teams puck possession game.
- Faceoffs - Faceoff Winning Percentage (min. 75 faceoffs taken).
- 5v5 TOI - The percentage of his teams 5v5 TOI that the player was on the ice for.
- Suppress - Measures a players ability to suppress opponent puck possession and shot attempts against.
- Skating - An indicator of a players skating ability, or speed bursts above 20mph per mile skated.
- Defend - An indicator of a players ability to suppress shot quality against.
- 4v5 TOI - Penalty Kill ice time, calculated as the percentage of his teams 4v5 ice time that the player was on the ice for.
Data Sources
- Salary data is from TheStanleyCap.com
- Skating data is from NHL Edge
- Other statistics are from Puckalytics.com and derived from data from NHL.com
Terms of Use
You are free to use include player cards in written articles, share on social media, or on other public websites under the following conditions:
- You credit TheStanleyCap.com as the source and provide a link back to TheStanleyCap.com or this player page.
- You do not mass copy/duplicate/publish dozens or hundreds of player cards. A few, or a handful for a written article is fine. Be reasonable. Fair use rules apply.
- If you are a high-traffic website you must download and host the image(s) on your site rather than overload TheStanleyCap servers with traffic.
Note: Player cards will update daily throughout the season so if you want to include snapshot then you must download the image.
If you have any questions, send an e-mail to the e-mail address at the top of this page.
Read Introducing Player Archetypes on HockeyAnalysis.com for more details on archetype calculations.
Core Archetypes
| Season | Team(s) | GP | TOI | Producer | Playmaker | Shooter | Sniper | Rebound | Rush | Skating | Defend |
|---|---|---|---|---|---|---|---|---|---|---|---|
| 2020-21 | NYR | 53 | -0.87 | -1.02 | -0.01 | 1.78 | - | 0.28 | - | 0.49 | |
| 2021-22 | NYR | 82 | -0.66 | -0.60 | -0.52 | 0.34 | - | -1.07 | 1.15 | 0.86 | |
| 2022-23 | NYR | 79 | 1.41 | 1.69 | 0.23 | 0.63 | - | -0.27 | 1.29 | -2.00 | |
| 2023-24 | NYR | 80 | -0.17 | -0.46 | 0.28 | 1.39 | - | 2.09 | 1.46 | -0.81 | |
| 2024-25 | NYR | 74 | 0.05 | -0.73 | 1.22 | 1.44 | - | 1.55 | 0.77 | -1.78 | |
| 2025-26 | CAR | 72 | 0.20 | -0.08 | 0.32 | 0.25 | - | 0.72 | 0.49 | -2.06 |
Situational and Secondary Archetypes
| Season | Team(s) | GP | TOI | 5v5 TOI | 5v4 TOI | 4v5 TOI | Possession | Drive | Suppress | Faceoffs |
|---|---|---|---|---|---|---|---|---|---|---|
| 2020-21 | NYR | 53 | 0.88 | -0.75 | -0.25 | 0.69 | 0.65 | 0.24 | - | |
| 2021-22 | NYR | 82 | 0.67 | -1.09 | -0.36 | 1.65 | 1.24 | 1.12 | - | |
| 2022-23 | NYR | 79 | 1.10 | -0.94 | 0.41 | 0.67 | 0.65 | 0.32 | - | |
| 2023-24 | NYR | 80 | 1.05 | -1.10 | 0.11 | -1.04 | -0.70 | -0.81 | - | |
| 2024-25 | NYR | 74 | 0.81 | -0.63 | 0.58 | 0.31 | -0.05 | 0.60 | - | |
| 2025-26 | CAR | 72 | 1.08 | -0.58 | 0.33 | 1.08 | 0.62 | 1.09 | - |
5v5 Individual Stats
| Season | Team(s) | GP | TOI | G/60 | A/60 | Pts/60 | xG/60 | GAE/60 | Sh% | xSh% | Sh%AE | %SA Rush | %SA Reb. |
|---|---|---|---|---|---|---|---|---|---|---|---|---|---|
| 2020-21 | NYR | 53 | 915:15 | 0.26 | 0.33 | 0.59 | 0.12 | 0.14 | 7.55 | 3.40 | 4.15 | 1.32 | 2.63 |
| 2021-22 | NYR | 82 | 1446:39 | 0.17 | 0.54 | 0.71 | 0.14 | 0.02 | 4.76 | 4.11 | 0.65 | 0.00 | 2.61 |
| 2022-23 | NYR | 79 | 1458:43 | 0.29 | 0.99 | 1.28 | 0.23 | 0.05 | 7.14 | 5.83 | 1.31 | 0.68 | 2.05 |
| 2023-24 | NYR | 80 | 1455:34 | 0.29 | 0.54 | 0.82 | 0.15 | 0.14 | 8.24 | 4.37 | 3.86 | 3.17 | 3.97 |
| 2024-25 | NYR | 74 | 1334:11 | 0.31 | 0.63 | 0.94 | 0.18 | 0.13 | 7.69 | 4.44 | 3.25 | 1.44 | 2.16 |
| 2025-26 | CAR | 72 | 1323:48 | 0.27 | 0.77 | 1.04 | 0.22 | 0.05 | 5.50 | 4.47 | 1.03 | 1.15 | 5.75 |
5v5 On Ice Stats
| Season | Team(s) | GP | TOI | SAF/60 | GF/60 | xGF/60 | SAA/60 | GA/60 | xGA/60 | GF% | xGF% | xGF Rel | xGA Rel | xGF% Rel |
|---|---|---|---|---|---|---|---|---|---|---|---|---|---|---|
| 2020-21 | NYR | 53 | 915:15 | 38.94 | 2.56 | 2.38 | 40.84 | 2.16 | 2.77 | 54.17 | 46.19 | 0.16 | 0.49 | -3.05 |
| 2021-22 | NYR | 82 | 1446:39 | 39.90 | 2.49 | 2.31 | 39.48 | 1.82 | 2.52 | 57.69 | 47.90 | 0.08 | -0.13 | 2.15 |
| 2022-23 | NYR | 79 | 1458:43 | 42.20 | 2.71 | 2.65 | 39.32 | 2.67 | 2.70 | 50.38 | 49.52 | 0.06 | 0.07 | -0.08 |
| 2023-24 | NYR | 80 | 1455:34 | 40.81 | 2.27 | 2.31 | 43.94 | 2.80 | 2.54 | 44.72 | 47.62 | -0.21 | 0.07 | -2.86 |
| 2024-25 | NYR | 74 | 1334:11 | 41.46 | 2.74 | 2.50 | 42.27 | 2.88 | 2.75 | 48.80 | 47.65 | 0.13 | 0.11 | 0.32 |
| 2025-26 | CAR | 72 | 1323:48 | 50.54 | 2.76 | 3.17 | 31.09 | 2.81 | 2.34 | 49.59 | 57.53 | 0.16 | -0.04 | 1.69 |
NHL Edge Stats
| Skating | Shooting | Zone Time | |||||||||||
|---|---|---|---|---|---|---|---|---|---|---|---|---|---|
| Season | GP | Top Speed | Bursts>20/mi | Avg. Speed | Top Speed | Avg. Speed | %Long Range | %Mid Range | %High Danger | ES DZ% | ES NZ% | ES OZ% | |
| This table is for Basic and Premium subscribers only. To view please login to and/or subscribe to one of our subscription plans. | |||||||||||||
Legend
| Percentile 0-25 | Percentile 25-50 | Percentile 50-75 | Percentile 75-100 |
5v5 Defense Pairs
| Season | Teammate | Team | TOI | GF/60 | GA/60 | GF% | xGF/60 | xGA/60 | xGF% | xGF Rel | xGA Rel | xGF% Rel |
|---|
Glossary
| Type | Statistic | Definition |
|---|---|---|
| Individual | G/60 | Goals Against per 60 minutes. |
| Individual | A/60 | Assists per 60 minutes. |
| Individual | Pts/60 | Points per 60 minutes. |
| Individual | xG/60 | Expected Goals per 60 minutes. |
| Individual | GAE/60 | Goals Above Expected (G/60 - xG/60). |
| Individual | Sh% | Shooting Percentage. |
| Individual | xSh% | Expected Shooting Percentage. |
| Individual | Sh%AE | Shooting percentage above expected (Sh% - xSh%). |
| Individual | %SA Rush | Percentage of shot attempts determined to be on the rush. |
| Individual | %SA Reb. | Percentage of shot attempts determined to be from rebounds. |
| On Ice | SAF/60 | Shot Attempts For per 60 minutes. |
| On Ice | GF/60 | Goals For per 60 minutes. |
| On Ice | xGF/60 | Expected Goals For per 60 minutes. |
| On Ice | SAA/60 | Shot Attempts Against per 60 minutes (lower is better). |
| On Ice | GA/60 | Goals Against per 60 minutes (lower is better). |
| On Ice | xGA/60 | Expected Goals Against per 60 minutes (lower is better). |
| On Ice | GF% | Goals For Percentage = Goals For / (Goals For + Goals Against) |
| On Ice | xGF% | Expected Goals For Percentage = Expected Goals For / (Expected Goals For + Expected Goals Against) |
| On Ice | xGF Rel | xGF/60 when On Ice - xGF/60 when not On Ice. |
| On Ice | xGA Rel | xGA/60 when On Ice - xGA/60 when not On Ice (lower is better). |
| On Ice | xGF% Rel | xGF% when On Ice - xGF% when not On Ice. |
News and Opinions
-
Hurricanes’ Miller & Ehlers Poised to Have an Excellent Second Season in Raleigh at The Hockey Writers (Wed Jul 15, 2026)
-
Nashville Predators acquire Jack Drury from Colorado for Fedor Svechkov, Zach L'Heureux at Yahoo Sports NHL (Wed Jun 24, 2026)
-
Why did Blackhawks trade for Bowen Byram? While baffling on paper, Chicago has to move at Yahoo Sports NHL (Wed Jun 24, 2026)
-
Darren Raddysh joins Maple Leafs in sign-and-trade deal: Top remaining free agents at Yahoo Sports NHL (Fri Jun 19, 2026)
-
Toronto Maple Leafs hire Jim Hiller as next head coach at Yahoo Sports NHL (Wed Jun 17, 2026)
-
Nashville Predators acquire center Ross Colton in trade with Colorado Avalanche at Yahoo Sports NHL (Tue Jun 16, 2026)
-
Golden Knights coaching candidates: Who's available with John Tortorella out? at Yahoo Sports NHL (Tue Jun 16, 2026)
-
John Tortorella out as Golden Knights coach after Stanley Cup Final run at Yahoo Sports NHL (Tue Jun 16, 2026)
-
What's next for Hurricanes, Golden Knights? Could they be back? at Yahoo Sports NHL (Mon Jun 15, 2026)
-
Chris Drury emerges as the early loser of K’Andre Miller trade at Blue Line Station (Mon Jun 15, 2026)
-
When is Carolina Hurricanes' Stanley Cup parade? What we know at Yahoo Sports NHL (Mon Jun 15, 2026)
-
K'Andre Miller Becomes A Stanley Cup Champion While Flipping The Narrative About Himself at Yahoo Sports NHL (Mon Jun 15, 2026)
-
Former Rangers defensemen wins Stanley Cup in first year with new club at Blue Line Station (Mon Jun 15, 2026)
-
Broadcaster Ron MacLean apologizes for roofies comment in Stanley Cup pregame show at Yahoo Sports NHL (Mon Jun 15, 2026)
-
Ex-Rangers defenseman addresses doubters: ‘can’t wait for them to see my ring’ at Forever Blueshirts (Mon Jun 15, 2026)
-
NY Rangers Fan Confidence Poll-June 15, 2026: K’Andre Miller, Stanley Cup champion at Blue Seat Blogs (Mon Jun 15, 2026)
-
Watch: Rod Brind'Amour lifts Stanley Cup 20 years apart as captain, coach at Yahoo Sports NHL (Mon Jun 15, 2026)
-
Frederik Andersen lifts Stanley Cup second for getting Hurricanes to final at Yahoo Sports NHL (Mon Jun 15, 2026)
-
Hurricanes star Jordan Staal wins Conn Smythe Trophy as Stanley Cup playoff MVP at Yahoo Sports NHL (Mon Jun 15, 2026)
-
Why Rangers shouldn’t be ‘kicking themselves’ over K’Andre Miller trade at Forever Blueshirts (Thu Jun 4, 2026)
-
Rangers defense development: K’Andre Miller is a microcosm of a terrible cycle at Blue Seat Blogs (Mon Jun 1, 2026)
-
Rangers Still Right to Trade K’Andre Miller Almost a Year Later at The Hockey Writers (Mon Jun 1, 2026)
-
Rangers and Hurricanes both got exactly what they needed from the K'Andre Miller trade at Blue Line Station (Sat May 30, 2026)
-
Wayne Gretzky Praises K’Andre Miller As One Of The Best Defensemen In Playoffs at Yahoo Sports NHL (Fri May 29, 2026)
-
The Penguins need to find their K’Andre Miller type of trade at Pens Burgh (Fri May 29, 2026)
-
Round 3, Game 5 – Canadiens @ Hurricanes: Preview and Game Thread at Canes Country (Fri May 29, 2026)
-
K'Andre Miller Blossoming Into The Player The Rangers Thought They Once Had at Yahoo Sports NHL (Tue May 26, 2026)
-
K'Andre Miller had a brutal blunder for Hurricanes in Eastern Conference Finals at Blue Line Station (Fri May 22, 2026)
-
TNT crew rips ex-Rangers defenseman after costly gaffe in Game 1 of ECF at Forever Blueshirts (Fri May 22, 2026)
-
Best version of ex-Rangers defenseman on display in latest postseason run at Forever Blueshirts (Sun May 10, 2026)
-
Checking in on former Rangers chasing a championship in the 2026 playoffs at Blue Line Station (Fri May 8, 2026)
-
Hurricanes’ K’Andre Miller Is Playing His Best Hockey at the Right Time at The Hockey Writers (Wed May 6, 2026)
-
Dallas Stars first-round exit finalizes New York Rangers return for K'Andre Miller at Blue Line Station (Fri May 1, 2026)
-
Former Rangers performances have made Mike Sullivan's comments look silly at Blue Line Station (Thu Apr 23, 2026)
-
The 2025-26 New York Rangers Final Report Card; Grades & In-Detail Profiles on Every Player, Blueshirts’ Break-Up Day Not That Encouraging; The ZOOM ZOOM Pizza Man Chris Drury Ducks-And-Dodges Everyone Again, Complete 2026 Stanley Cup Playoffs Preview & Predictions, Looking Ahead; Mark Down Cinco De Mayo On Your Calendar & Much More at Blue Collar Blue Shirts (Mon Apr 20, 2026)
-
How Did These Former Rangers Perform on Their New Teams This Season? at The Hockey Writers (Sun Apr 12, 2026)
-
Nikishin Calls Game As Hurricanes Hold On For OT Win In Toronto at Yahoo Sports NHL (Fri Mar 20, 2026)
-
How GM’s trades past 18 months helped sink Rangers in NHL standings at Forever Blueshirts (Fri Feb 13, 2026)
-
Podcast Ombudsman Report for Blueshirt Bandwidth Ep. 70 at Blue Shirt Banter (Thu Feb 12, 2026)
-
Grading 3 Carolina Hurricanes Players Heading Into the Olympic Break at The Hockey Writers (Tue Feb 10, 2026)
-
Recap: Rangers Sleepwalk Into Olympic Break With 2–0 Loss to Hurricanes at Blue Shirt Banter (Thu Feb 5, 2026)
-
Fantasy Hockey Waiver Wire: K'Andre Miller among top category adds to start the week at Yahoo Sports NHL (Mon Jan 12, 2026)
-
The 2025-26 New York Rangers Mid-Season Report Card: Grades & Detailed Reviews of Every Blueshirt, Thoughts at the 50% Mark of the Season, The Highs & Lows, Predictions, Looking at Last Year, “Same Old Rangers,” The Lack of Scoring, What Is Drury Doing, NYR v. NYI & More at Blue Collar Blue Shirts (Mon Dec 29, 2025)
-
NYR/CAR 11/26 Review: Rangers Rally in Raleigh; Wolf Pack Alum (Berard/Laba/Brodzinski) Dominate & Dazzle in a “Blueshirts’ Bizarro World” Win, Cuylle May Need To File a Restraining Order Against Lafreniere, CZAR IGOR & Top Pair Crush Canes’ Chances, See Ya Parssinen; What. Is. Chris. Doing?, M$GN & More at Blue Collar Blue Shirts (Thu Nov 27, 2025)
-
Former Rangers defenseman ‘loving life’ with division rival at Forever Blueshirts (Wed Nov 26, 2025)
-
Rangers vs. Hurricanes: Lineups, storylines for Thanksgiving Eve clash at Forever Blueshirts (Wed Nov 26, 2025)
-
Why Rangers should consider trading Braden Schneider after this season at Forever Blueshirts (Fri Nov 21, 2025)
-
K’Andre Miller & Nikolaj Ehlers Showing Why the Hurricanes Targeted Them in the Offseason at The Hockey Writers (Tue Nov 11, 2025)
-
2025-26 Metropolitan Division Snapshot #1: One Month Down and First to 10 Wins at All About the Jersey (Fri Nov 7, 2025)
-
K'Andre Miller Nearing Return To Hurricanes Blueline; Likely To Play Against Minnesota Wild at Yahoo Sports NHL (Wed Nov 5, 2025)
-
Ex-Rangers defenseman reflects on New York tenure, embraces ‘second start’ at Forever Blueshirts (Tue Nov 4, 2025)
-
Rangers vs. Hurricanes: Lineups, storylines eyeing 1st home win at Forever Blueshirts (Tue Nov 4, 2025)
-
K'Andre Miller Won't Make Return From Injury Against The Rangers at Yahoo Sports NHL (Tue Nov 4, 2025)
-
Ex-Rangers defenseman set to miss 1st visit back to Garden due to injury at Forever Blueshirts (Fri Oct 31, 2025)
-
Why Chris Drury Should Be on the Hot Seat for the Rangers at Blue Line Station (Tue Oct 28, 2025)
-
Ex-Rangers defenseman might miss 1st visit back to Garden due to injury at Forever Blueshirts (Sat Oct 25, 2025)
-
VGK Breakdowns: Golden Knights Lose Hill, Squash Hurricanes at Vegas Hockey Now (Tue Oct 21, 2025)
-
Four Players Who Impressed In Their Debut With Their New Team at The Hockey News (Sat Oct 11, 2025)
-
Former Rangers defenseman ‘exceptional,’ scores 2 goals in Hurricanes debut at Forever Blueshirts (Fri Oct 10, 2025)
-
Former Rangers defenseman ‘exceptional,’ scores 2 goals in Hurricanes debut at Forever Blueshirts (Fri Oct 10, 2025)
-
Miller scores twice in 'exceptional' Canes debut at ESPN (Fri Oct 10, 2025)
-
Weak Start, Good Fight, Disastrous Finish: Devils Drop Opener 6-3 to Hurricanes With Three Late Goals Against at All About the Jersey (Fri Oct 10, 2025)
-
Miller and Jarvis double dip as the iron-happy Hurricanes score an Opening Night win at Cardiac Cane (Fri Oct 10, 2025)
-
Jarvis & Miller’s 2 Goal Nights Lead Hurricanes to 6-3 Win Over Devils at The Hockey Writers (Thu Oct 9, 2025)
-
Blueshirt Banter 2026-26 Season Preview Roundtable at Blue Shirt Banter (Mon Oct 6, 2025)
-
Changing Speed: How K'Andre Miller Can Push The Hurricanes To New Heights at Yahoo Sports NHL (Sun Sep 28, 2025)
-
New York Rangers name J.T. Miller captain on the eve of training camp at NBC Sports (Tue Sep 16, 2025)
-
Key lineup battles that will define Rangers training camp 2025-26 at Blue Line Station (Sat Sep 13, 2025)
-
All eyes are focused on K'Andre Miller after a big move and contract this summer at Cardiac Cane (Fri Sep 5, 2025)
-
Vladislav Gavrikov ‘massive upgrade’ on Rangers defense corps, former NHL enforcer believes at Forever Blueshirts (Mon Sep 1, 2025)
-
NHL’s Metropolitan Division Is Weakest It’s Been in Years Entering 2025-26 at The Hockey Writers (Sat Aug 23, 2025)
-
The Hurricanes Used A Unique Strategy Tp Acquire K'Andre Miller at Yahoo Sports NHL (Fri Aug 22, 2025)
-
Hurricanes’ Refurbished Defense Raises Lineup Questions at The Hockey Writers (Fri Aug 15, 2025)
-
Are Blue Jackets Ready to Leapfrog Rangers Again in 2025-26? at The Hockey Writers (Mon Aug 4, 2025)
-
2024-2025 K’Andre Miller report card at Blue Seat Blogs (Wed Jul 30, 2025)
-
Rangers Fans Fighting Over K'Andre Miller at Yahoo Sports NHL (Tue Jul 22, 2025)
-
6 Must-Watch New York Rangers Games of the 2025-26 Season at The Hockey Writers (Tue Jul 22, 2025)
-
K'Andre Miller Sends Emotional Message To Rangers Fans And Organization After Signing With Hurricanes at Yahoo Sports NHL (Thu Jul 17, 2025)
-
‘Grateful’ former Rangers defenseman pens heartfelt message after trade to Hurricanes at Forever Blueshirts (Thu Jul 17, 2025)
-
10 can’t-miss games on the Rangers 2025-26 NHL schedule at Forever Blueshirts (Thu Jul 17, 2025)
-
What to takeaway from the Rangers' blueline transformation at Blue Line Station (Wed Jul 2, 2025)
-
Hurricanes Acquire and Sign K’Andre Miller (poll) at Canes Country (Tue Jul 1, 2025)
-
Fans say Carolina was fleeced in trade for K'Andre Miller at Blue Line Station (Tue Jul 1, 2025)
-
Division rivals strike a deal as the Hurricanes and Rangers complete a sign-and-trade at Cardiac Cane (Tue Jul 1, 2025)
-
Rangers trade K'Andre Miller to Carolina Hurricanes for a haul of futures at Blue Line Station (Tue Jul 1, 2025)
-
Red Wings miss golden chance to land rising star defenseman at Octopus Thrower (Tue Jul 1, 2025)
-
Rangers working on K'Andre Miller trade to Carolina Hurricanes at Blue Line Station (Tue Jul 1, 2025)
-
Red Wings fans would celebrate if Steve Yzerman acquired blueliner at Octopus Thrower (Mon Jun 30, 2025)
-
Detroit Red Wings are showing interest in Rangers RFA K'Andre Miller at Blue Line Station (Mon Jun 30, 2025)
-
What the New York Rangers need to figure out before NHL free agency frenzy begins at Blue Line Station (Sun Jun 29, 2025)
-
Are the New York Rangers making a mistake shopping K’Andre Miller? at Blue Line Station (Thu Jun 26, 2025)
-
2 bold 2025 offseason predictions for Rangers at Blue Line Station (Mon Jun 23, 2025)
Current Contract
K'Andre Miller signed an $60,000,000 8-year contract with the New York Rangers and General Manager Chris Drury on July 1, 2025 with an AAV of $7,500,000. This contract will start in 2025-26 and end after the 2032-33 season. In the first season of the contract the cap hit was equivalent to 7.85% of the salary cap.
Standard Contract (RFA) ( ) (0 ratings)
K'Andre Miller signed a $7,744,000 2-year contract with the New York Rangers and General Manager Chris Drury on July 11, 2023 with an AAV of $3,872,000. This contract will start in 2023-24 and end after the 2024-25 season. In the first season of the contract the cap hit was equivalent to 4.64% of the salary cap.
Standard Contract (RFA) ( ) (0 ratings)
| Season | Age* | Clause | Cap Hit | AAV | Perf. Bonus | Sign. Bonus | Salary | Compensation | Minors Salary | Status | |
|---|---|---|---|---|---|---|---|---|---|---|---|
| 2023-24 | 23 | $3,872,000 | $3,872,000 | - | $350,000 | $2,748,000 | $3,098,000 | $3,098,000 | RFA | ||
| 2024-25 | 24 | $3,872,000 | $3,872,000 | - | - | $4,646,000 | $4,646,000 | $4,646,000 | RFA-arb | ||
| Total | - | $350,000 | $7,394,000 | $7,744,000 | $7,744,000 |
K'Andre Miller signed a $2,775,000 3-year contract with the New York Rangers and General Manager Jeff Gorton on March 13, 2020 with an AAV of $925,000. This contract will start in 2020-21 and end after the 2022-23 season. In the first season of the contract the cap hit was equivalent to 1.13% of the salary cap.
Entry Level Contract ( ) (0 ratings)
| Season | Age* | Clause | Cap Hit | AAV | Perf. Bonus | Sign. Bonus | Salary | Compensation | Minors Salary | Status | |
|---|---|---|---|---|---|---|---|---|---|---|---|
| 2020-21 | 20 | $925,000 | $1,275,000 | $300,000 | $92,500 | $832,500 | $925,000 | $70,000 | ELC | ||
| 2021-22 | 21 | $925,000 | $1,275,000 | $350,000 | $92,500 | $832,500 | $925,000 | $70,000 | ELC | ||
| 2022-23 | 22 | $925,000 | $1,275,000 | $400,000 | $92,500 | $832,500 | $925,000 | $70,000 | ELC | ||
| Total | $1,050,000 | $277,500 | $2,497,500 | $2,775,000 | $210,000 |
Career Statistics
| Regular Season | Playoffs | |||||||||||||||||||
|---|---|---|---|---|---|---|---|---|---|---|---|---|---|---|---|---|---|---|---|---|
| Season | League | Team | GP | G | A | Pts | +/- | PIM | Shots | Sh% | TOI/G | GP | G | A | Pts | +/- | PIM | Shots | Sh% | TOI/G |
| 2014-15 | Bantam | MNBEL Canadiens | 16 | 7 | 9 | 16 | ||||||||||||||
| 2014-15 | USHS-MN | Minnetonka High | 25 | 4 | 2 | 6 | 2 | 3 | 1 | 1 | ||||||||||
| 2015-16 | USA-S15 | Team Kelly | 5 | 0 | 3 | 3 | ||||||||||||||
| 2015-16 | UMHSEHL | Team TDS Transportation | 2 | 0 | 0 | 0 | ||||||||||||||
| 2015-16 | USHS-MN | Minnetonka High | 25 | 5 | 11 | 16 | 12 | 1 | 2 | |||||||||||
| 2016-17 | USDP | U.S. National U17 Team | 54 | 3 | 14 | 17 | 16 | |||||||||||||
| 2016-17 | USHL | USNTDP Juniors | 34 | 0 | 7 | 7 | -29 | 12 | ||||||||||||
| 2016-17 | WHC-17 | USA U17 | 5 | 0 | 1 | 1 | ||||||||||||||
| 2016-17 | USDP | U.S. National U18 Team | 1 | 0 | 1 | 1 | ||||||||||||||
| 2017-18 | USDP | U.S. National U18 Team | 58 | 9 | 20 | 29 | 26 | |||||||||||||
| 2017-18 | USHL | USNTDP Juniors | 22 | 4 | 12 | 16 | +13 | 6 | ||||||||||||
| 2017-18 | WJC-18 | USA U18 | 7 | 1 | 2 | 3 | +4 | 4 | ||||||||||||
| 2018-19 | NCAA | Univ. of Wisconsin | 26 | 5 | 17 | 22 | +7 | 18 | ||||||||||||
| 2018-19 | WJC-20 | USA U20 | 6 | 0 | 1 | 1 | +1 | |||||||||||||
| 2019-20 | NCAA | Univ. of Wisconsin | 36 | 7 | 11 | 18 | -7 | 24 | ||||||||||||
| 2019-20 | WJC-20 | USA U20 | 5 | 0 | 2 | 2 | +1 | 2 | ||||||||||||
| 2020-21 | NHL | New York Rangers | 53 | 5 | 7 | 12 | +9 | 20 | 62 | 8.1 | 21:07 | |||||||||
| 2021-22 | NHL | New York Rangers | 82 | 7 | 13 | 20 | +23 | 24 | 102 | 6.9 | 20:36 | 20 | 2 | 5 | 7 | -5 | 10 | 20 | 10.0 | 24:47 |
| 2022-23 | NHL | New York Rangers | 79 | 9 | 34 | 43 | +12 | 47 | 113 | 8.0 | 21:57 | 7 | 1 | 1 | 4 | 4 | 0.0 | 22:24 | ||
| 2023-24 | NHL | New York Rangers | 80 | 8 | 22 | 30 | +5 | 49 | 96 | 8.3 | 21:34 | 16 | 1 | 3 | 4 | +2 | 8 | 13 | 7.7 | 21:05 |
| 2024-25 | NHL | New York Rangers | 74 | 7 | 20 | 27 | 22 | 110 | 6.4 | 21:57 | ||||||||||
| 2025-26 | NHL | Carolina Hurricanes | 72 | 8 | 29 | 37 | +7 | 56 | 123 | 6.5 | 22:24 | 19 | 9 | 9 | +12 | 10 | 19 | 0.0 | 24:03 | |
| NHL Career | 440 | 44 | 125 | 169 | +56 | 218 | 606 | 7.3 | 21:36 | 62 | 3 | 18 | 21 | +9 | 32 | 56 | 5.4 | 23:20 | ||