
 Jonny Brodzinski
| Position | Center | Current Team | Washington Capitals |
| Shoots | Right | Current Contract | 1 year ($850.0K CapHit) |
| Height | 6'0" | Expires | 2026-27 |
| Weight (lbs) | 206 | Expiry Age (Jun 30) | 34 |
| Age (DOB) | 33 (June 19, 1993) | Expiry Status | UFA |
| Drafted | 2013, Round 5, Overall 148 (LAK) |
| Date | Team | Transaction | |
|---|---|---|---|
| Jul 1, 2026 | Washington Capitals | Signed 1 year @ $850K AAV starting in 2026-27 | |
| Feb 21, 2024 | New York Rangers | Signed 2 years @ $787K AAV starting in 2024-25 | |
| Feb 28, 2022 | New York Rangers | Signed 2 years @ $762K AAV starting in 2022-23 | |
| Apr 19, 2021 | New York Rangers | Signed 1 year @ $750K AAV starting in 2021-22 | |
| Oct 9, 2020 | New York Rangers | Signed 1 year @ $700K AAV starting in 2020-21 | |
| Jul 2, 2019 | San Jose Sharks | Signed 1 year @ $700K AAV starting in 2019-20 | |
| Jul 14, 2017 | Los Angeles Kings | Signed 2 years @ $650K AAV starting in 2017-18 | |
| Apr 1, 2015 | Los Angeles Kings | Signed to an entry level contract. |
Player Card(s)

URL: https://thestanleycap.com/cdn/player_cards/20252026/jonny-brodzinski-8477380.png
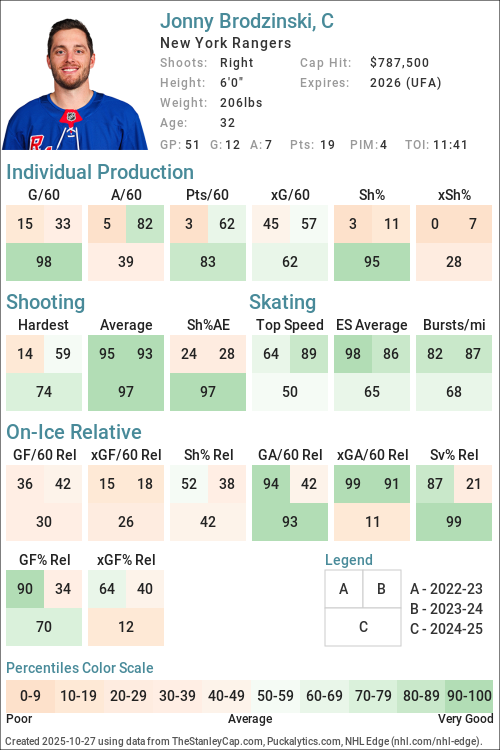
URL: https://thestanleycap.com/cdn/player_cards/20242025/jonny-brodzinski-8477380.png
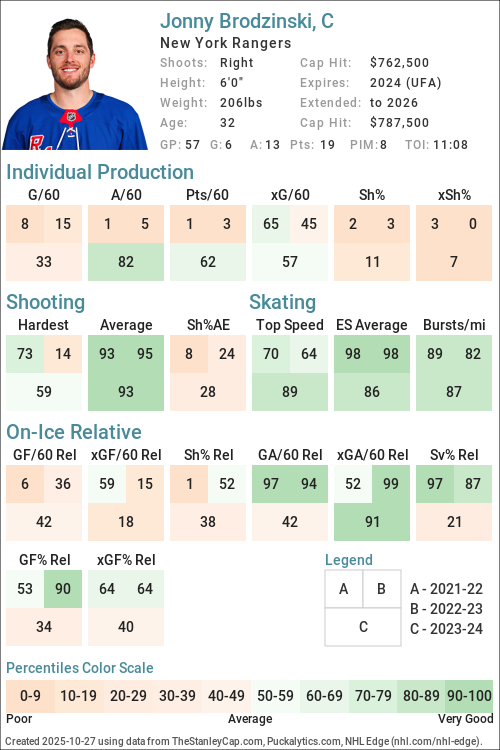
URL: https://thestanleycap.com/cdn/player_cards/20232024/jonny-brodzinski-8477380.png
About Player Cards
Player cards present an infographic of a players performance using a series of Player Archetypes developed for Puckalytics.com and TheStanleyCap.com. The boxes in the rink image show the archetype ratings for the season specified in the card while the graphs to the right show the five-year trends for those archetypes.
Except for Faceoffs, the values shown are the players z-score (standard deviation from the mean) for the specific metric used to calculate the archetype values. When calculating z-scores forwards were compared to forwards and defensemen were compared to defensemen. Positive values indicate the player is above average and shaded in blue, while negative values indicate the player is below average and shaded in pink. The five year trend charts show a range of -4.0 to 4.0.
The value shown for Faceoffs is the faceoff winning percentage rather than their z-score with winning percentages below 50 in pink shades and above 50 in blue shades.
All archetypes are 5v5 except 5v4 TOI, 4v5 TOI, Skating (even strength) and Faceoffs (all situations). Archetypes use regular season data only.
Archetypes Summary
- Sniper - Measures the to score above the expected goal rate.
- Rebound - Measures the percent of a players shot attempts that come from rebounds (forwards only).
- 5v4 TOI - Powerplay ice time, calculated as the percentage of his teams 5v4 ice time that the player was on the ice for.
- Shooter - Measures whether a players points come from shots (goals or assists on rebounds from his shots).
- Producer - Measures a players ability to produce goals and assists, adjusted for quality of teammates.
- Playmaker - Measures whether a players points come from passes.
- Drive - Measures a players ability to drive puck possession and generate shot attempts for his team.
- Rush - Measures the percent of a players shot attempts that come from rush plays
- Possession - An indicator of a players ability to improve his teams puck possession game.
- Faceoffs - Faceoff Winning Percentage (min. 75 faceoffs taken).
- 5v5 TOI - The percentage of his teams 5v5 TOI that the player was on the ice for.
- Suppress - Measures a players ability to suppress opponent puck possession and shot attempts against.
- Skating - An indicator of a players skating ability, or speed bursts above 20mph per mile skated.
- Defend - An indicator of a players ability to suppress shot quality against.
- 4v5 TOI - Penalty Kill ice time, calculated as the percentage of his teams 4v5 ice time that the player was on the ice for.
Data Sources
- Salary data is from TheStanleyCap.com
- Skating data is from NHL Edge
- Other statistics are from Puckalytics.com and derived from data from NHL.com
Terms of Use
You are free to use include player cards in written articles, share on social media, or on other public websites under the following conditions:
- You credit TheStanleyCap.com as the source and provide a link back to TheStanleyCap.com or this player page.
- You do not mass copy/duplicate/publish dozens or hundreds of player cards. A few, or a handful for a written article is fine. Be reasonable. Fair use rules apply.
- If you are a high-traffic website you must download and host the image(s) on your site rather than overload TheStanleyCap servers with traffic.
Note: Player cards will update daily throughout the season so if you want to include snapshot then you must download the image.
If you have any questions, send an e-mail to the e-mail address at the top of this page.
Read Introducing Player Archetypes on HockeyAnalysis.com for more details on archetype calculations.
Core Archetypes
| Season | Team(s) | GP | TOI | Producer | Playmaker | Shooter | Sniper | Rebound | Rush | Skating | Defend |
|---|---|---|---|---|---|---|---|---|---|---|---|
| 2016-17 | LAK | 6 | 0.39 | 4.41 | -1.43 | -2.82 | 2.45 | -1.95 | - | 6.80 | |
| 2017-18 | LAK | 35 | -1.14 | -1.36 | 0.10 | -0.04 | 0.55 | -0.45 | - | 0.20 | |
| 2018-19 | LAK | 13 | -0.53 | -1.14 | 0.77 | 0.56 | 1.19 | 1.93 | - | 2.10 | |
| 2019-20 | SJS | 3 | 1.38 | 7.13 | -1.47 | -1.53 | -2.06 | -1.80 | - | -4.19 | |
| 2020-21 | NYR | 5 | 0.11 | -1.46 | 5.06 | 3.58 | -2.02 | -1.74 | - | 4.90 | |
| 2021-22 | NYR | 22 | -1.77 | -1.40 | -1.21 | -1.18 | -1.52 | 0.16 | 1.21 | 1.98 | |
| 2022-23 | NYR | 17 | -1.72 | -1.28 | -1.04 | -0.43 | -2.29 | -1.90 | 0.83 | 1.14 | |
| 2023-24 | NYR | 57 | 0.47 | 0.66 | -0.30 | -0.38 | -0.57 | -0.15 | 1.16 | -0.78 | |
| 2024-25 | NYR | 51 | 1.49 | -0.41 | 2.85 | 2.22 | -0.75 | 1.17 | 0.38 | 2.15 | |
| 2025-26 | NYR | 55 | 0.13 | -0.02 | 0.04 | -0.24 | 0.28 | 0.23 | 0.57 | 0.98 |
Situational and Secondary Archetypes
| Season | Team(s) | GP | TOI | 5v5 TOI | 5v4 TOI | 4v5 TOI | Possession | Drive | Suppress | Faceoffs |
|---|---|---|---|---|---|---|---|---|---|---|
| 2016-17 | LAK | 6 | -0.52 | -1.62 | -2.02 | 3.21 | 2.37 | 2.71 | - | |
| 2017-18 | LAK | 35 | -1.73 | -1.80 | -2.02 | -1.61 | -1.20 | -0.97 | - | |
| 2018-19 | LAK | 13 | -1.56 | -1.66 | -1.97 | -1.60 | -2.29 | 1.11 | - | |
| 2019-20 | SJS | 3 | -3.28 | -1.69 | -1.61 | -0.15 | 2.34 | -2.44 | - | |
| 2020-21 | NYR | 5 | -0.46 | -1.73 | -2.21 | -3.13 | -0.90 | -6.21 | - | |
| 2021-22 | NYR | 22 | -1.63 | -1.92 | -0.68 | 0.98 | 0.47 | 0.95 | 50.5 | |
| 2022-23 | NYR | 17 | -2.04 | -1.87 | -1.26 | 0.07 | -0.63 | 1.02 | 53.1 | |
| 2023-24 | NYR | 57 | -1.23 | -1.01 | -2.02 | 0.21 | -0.33 | 0.89 | 50.2 | |
| 2024-25 | NYR | 51 | -1.00 | -1.14 | -2.11 | -1.63 | -0.91 | -1.55 | 47.6 | |
| 2025-26 | NYR | 55 | -1.12 | -1.16 | -1.99 | -0.23 | -0.16 | -0.14 | 53.0 |
5v5 Individual Stats
| Season | Team(s) | GP | TOI | G/60 | A/60 | Pts/60 | xG/60 | GAE/60 | Sh% | xSh% | Sh%AE | %SA Rush | %SA Reb. |
|---|---|---|---|---|---|---|---|---|---|---|---|---|---|
| 2016-17 | LAK | 6 | 69:11 | 0.00 | 1.73 | 1.73 | 1.22 | -1.22 | 0.00 | 10.04 | -10.04 | 0.00 | 10.53 |
| 2017-18 | LAK | 35 | 319:27 | 0.75 | 0.38 | 1.13 | 0.77 | -0.02 | 8.16 | 8.33 | -0.16 | 3.08 | 6.15 |
| 2018-19 | LAK | 13 | 125:07 | 0.96 | 0.48 | 1.44 | 0.82 | 0.14 | 11.76 | 10.03 | 1.73 | 8.00 | 8.00 |
| 2019-20 | SJS | 3 | 17:05 | 0.00 | 3.51 | 3.51 | 0.59 | -0.59 | 0.00 | 5.64 | -5.64 | 0.00 | 0.00 |
| 2020-21 | NYR | 5 | 52:10 | 1.15 | 0.00 | 1.15 | 0.27 | 0.88 | 20.00 | 4.72 | 15.28 | 0.00 | 0.00 |
| 2021-22 | NYR | 22 | 212:34 | 0.28 | 0.28 | 0.56 | 0.70 | -0.42 | 2.94 | 7.28 | -4.34 | 4.35 | 2.17 |
| 2022-23 | NYR | 17 | 150:23 | 0.40 | 0.40 | 0.80 | 0.60 | -0.20 | 4.17 | 6.30 | -2.13 | 0.00 | 0.00 |
| 2023-24 | NYR | 57 | 575:44 | 0.52 | 1.25 | 1.77 | 0.64 | -0.12 | 6.10 | 7.46 | -1.37 | 3.57 | 6.25 |
| 2024-25 | NYR | 51 | 549:55 | 1.31 | 0.76 | 2.07 | 0.71 | 0.60 | 17.91 | 9.69 | 8.22 | 4.21 | 5.26 |
| 2025-26 | NYR | 55 | 572:04 | 0.63 | 0.84 | 1.47 | 0.73 | -0.10 | 10.53 | 12.19 | -1.66 | 3.00 | 9.00 |
5v5 On Ice Stats
| Season | Team(s) | GP | TOI | SAF/60 | GF/60 | xGF/60 | SAA/60 | GA/60 | xGA/60 | GF% | xGF% | xGF Rel | xGA Rel | xGF% Rel |
|---|---|---|---|---|---|---|---|---|---|---|---|---|---|---|
| 2016-17 | LAK | 6 | 69:11 | 51.17 | 2.60 | 3.22 | 31.22 | 0.00 | 2.08 | 100.00 | 60.72 | 0.81 | -0.12 | 8.49 |
| 2017-18 | LAK | 35 | 319:27 | 35.87 | 2.25 | 1.87 | 43.57 | 1.69 | 2.31 | 57.14 | 44.79 | -0.26 | 0.05 | -3.80 |
| 2018-19 | LAK | 13 | 125:07 | 32.13 | 2.40 | 2.02 | 43.16 | 1.92 | 2.47 | 55.56 | 45.02 | -0.52 | -0.16 | -4.15 |
| 2019-20 | SJS | 3 | 17:05 | 63.22 | 7.02 | 2.23 | 38.63 | 7.02 | 2.71 | 50.00 | 45.20 | -0.68 | 1.11 | -19.41 |
| 2020-21 | NYR | 5 | 52:10 | 31.05 | 1.15 | 1.52 | 62.11 | 0.00 | 4.31 | 100.00 | 26.07 | -0.77 | 2.28 | -26.99 |
| 2021-22 | NYR | 22 | 212:34 | 39.23 | 1.41 | 2.20 | 38.11 | 1.13 | 2.63 | 55.56 | 45.63 | 0.05 | 0.02 | 0.36 |
| 2022-23 | NYR | 17 | 150:23 | 37.11 | 1.99 | 1.86 | 35.91 | 1.20 | 1.96 | 62.50 | 48.65 | -0.47 | -0.69 | 1.85 |
| 2023-24 | NYR | 57 | 575:44 | 40.64 | 2.40 | 2.03 | 40.33 | 2.81 | 2.28 | 46.00 | 47.05 | -0.43 | -0.33 | -1.43 |
| 2024-25 | NYR | 51 | 549:55 | 36.66 | 2.51 | 2.14 | 46.92 | 1.75 | 2.80 | 58.97 | 43.26 | -0.20 | 0.29 | -4.91 |
| 2025-26 | NYR | 55 | 572:04 | 36.60 | 1.89 | 2.13 | 41.74 | 1.99 | 2.65 | 48.65 | 44.64 | -0.28 | 0.14 | -4.36 |
NHL Edge Stats
| Skating | Shooting | Zone Time | |||||||||||
|---|---|---|---|---|---|---|---|---|---|---|---|---|---|
| Season | GP | Top Speed | Bursts>20/mi | Avg. Speed | Top Speed | Avg. Speed | %Long Range | %Mid Range | %High Danger | ES DZ% | ES NZ% | ES OZ% | |
| This table is for Basic and Premium subscribers only. To view please login to and/or subscribe to one of our subscription plans. | |||||||||||||
Legend
| Percentile 0-25 | Percentile 25-50 | Percentile 50-75 | Percentile 75-100 |
5v5 Lines
| Season | Teammate | Teammate | Team | TOI | GF/60 | GA/60 | GF% | xGF/60 | xGA/60 | xGF% | xGF Rel | xGA Rel | xGF% Rel |
|---|
Glossary
| Type | Statistic | Definition |
|---|---|---|
| Individual | G/60 | Goals Against per 60 minutes. |
| Individual | A/60 | Assists per 60 minutes. |
| Individual | Pts/60 | Points per 60 minutes. |
| Individual | xG/60 | Expected Goals per 60 minutes. |
| Individual | GAE/60 | Goals Above Expected (G/60 - xG/60). |
| Individual | Sh% | Shooting Percentage. |
| Individual | xSh% | Expected Shooting Percentage. |
| Individual | Sh%AE | Shooting percentage above expected (Sh% - xSh%). |
| Individual | %SA Rush | Percentage of shot attempts determined to be on the rush. |
| Individual | %SA Reb. | Percentage of shot attempts determined to be from rebounds. |
| On Ice | SAF/60 | Shot Attempts For per 60 minutes. |
| On Ice | GF/60 | Goals For per 60 minutes. |
| On Ice | xGF/60 | Expected Goals For per 60 minutes. |
| On Ice | SAA/60 | Shot Attempts Against per 60 minutes (lower is better). |
| On Ice | GA/60 | Goals Against per 60 minutes (lower is better). |
| On Ice | xGA/60 | Expected Goals Against per 60 minutes (lower is better). |
| On Ice | GF% | Goals For Percentage = Goals For / (Goals For + Goals Against) |
| On Ice | xGF% | Expected Goals For Percentage = Expected Goals For / (Expected Goals For + Expected Goals Against) |
| On Ice | xGF Rel | xGF/60 when On Ice - xGF/60 when not On Ice. |
| On Ice | xGA Rel | xGA/60 when On Ice - xGA/60 when not On Ice (lower is better). |
| On Ice | xGF% Rel | xGF% when On Ice - xGF% when not On Ice. |
News and Opinions
-
How Rangers plan to replace depth forwards who left in free agency at Forever Blueshirts (Thu Jul 2, 2026)
-
Capitals sign forward Jonny Brodzinski to a one-year, one-way contract at Russian Machine Never Breaks (Wed Jul 1, 2026)
-
2025-2026 Jonny Brodzinski report card at Blue Seat Blogs (Sat Jun 20, 2026)
-
What Rangers options are if Jonny Brodzinski leaves in free agency at Forever Blueshirts (Fri Jun 19, 2026)
-
Rangers likely to lose Jonny Brodzinski in free agency at Blue Seat Blogs (Sat Jun 6, 2026)
-
2026 Rangers Report Card: Jonny Brodzinski at Blue Shirt Banter (Sat May 16, 2026)
-
Jonny Brodzinski’s decade-long climb reaches a New York crossroad at Blue Line Station (Wed Apr 29, 2026)
-
Rangers rookies must embrace challenge: ‘Easier to get here … harder to stay’ at Forever Blueshirts (Thu Apr 23, 2026)
-
The 2025-26 New York Rangers Final Report Card; Grades & In-Detail Profiles on Every Player, Blueshirts’ Break-Up Day Not That Encouraging; The ZOOM ZOOM Pizza Man Chris Drury Ducks-And-Dodges Everyone Again, Complete 2026 Stanley Cup Playoffs Preview & Predictions, Looking Ahead; Mark Down Cinco De Mayo On Your Calendar & Much More at Blue Collar Blue Shirts (Mon Apr 20, 2026)
-
'I Want To Be Here': Notes From Rangers Breakup Day at Blue Shirt Banter (Fri Apr 17, 2026)
-
Rangers Daily: Jonny Brodzinski future on Broadway; Devils fire GM at Forever Blueshirts (Tue Apr 7, 2026)
-
Jonny Brodzinski's Role In The Development Of Rangers' Young Players at Yahoo Sports NHL (Mon Mar 30, 2026)
-
Recap: Fortescue, Sykora, and Brodzinski Shine in Rangers' 6-1 Blowout of Blackhawks at Blue Shirt Banter (Fri Mar 27, 2026)
-
Trade One, Keep One: Jonny Brodzinski vs. Sam Carrick at Blue Shirt Banter (Tue Feb 3, 2026)
-
Mike Sullivan sends a clear message to Jonny Brodzinski as the Rangers lineup shifts again at Blue Line Station (Fri Jan 23, 2026)
-
Blueshirt Banter Roundtable: Where Are the Rangers One Year After 'The Memo'? at Blue Shirt Banter (Wed Nov 26, 2025)
-
Rangers’ Jonny Brodzinski’s Story From Minnesota to Madison Square Garden at The Hockey Writers (Fri Nov 21, 2025)
-
NYR/VGK 11/18 Review: Schmid Happens (Again)! Notorious Ranger Killer Breezes By Bad-And-Boring Blueshirts; Fat Cats Talk The Talk But Don’t Walk The Walk, It’s Time For J.T. Miller To Take a Break; Playing Hurt Isn’t Helping, How To Make M$GN Entertaining; Let Dave “Right” Maloney Hit the Liquor Cabinet, Thanksgiving Tent Pole & More at Blue Collar Blue Shirts (Wed Nov 19, 2025)
-
Jonny Brodzinski Raises Daughters, Lifts Teammates, Anchors Rangers Depth at Forever Blueshirts (Mon Oct 13, 2025)
-
2025 Rangers Season Previews: Jonny Brodzinski at Blue Shirt Banter (Sat Sep 6, 2025)
-
2025 Rangers Season Previews: Sam Carrick at Blue Shirt Banter (Mon Sep 1, 2025)
-
2024-2025 Jonny Brodzinski report card at Blue Seat Blogs (Wed Aug 27, 2025)
-
Jonny Brodzinski preps for Rangers season with summer league hat trick in Da Beauty League at Forever Blueshirts (Thu Jul 31, 2025)
Current Contract
Jonny Brodzinski signed a $850,000 1-year contract with the Washington Capitals and General Manager Chris Patrick on July 1, 2026 with an AAV of $850,000. This contract will start in 2026-27 and end after the 2026-27 season. In the first season of the contract the cap hit was equivalent to 0.82% of the salary cap.
Standard Contract (UFA) ( ) (0 ratings)
Jonny Brodzinski signed a $1,575,000 2-year contract with the New York Rangers and General Manager Chris Drury on February 21, 2024 with an AAV of $787,500. This contract will start in 2024-25 and end after the 2025-26 season. In the first season of the contract the cap hit was equivalent to 0.89% of the salary cap.
Standard Contract (UFA) ( ) (0 ratings)
| Season | Age* | Clause | Cap Hit | AAV | Perf. Bonus | Sign. Bonus | Salary | Compensation | Minors Salary | Status | |
|---|---|---|---|---|---|---|---|---|---|---|---|
| 2024-25 | 31 | $787,500 | $787,500 | - | - | $775,000 | $775,000 | $775,000 | UFA | ||
| 2025-26 | 32 | $787,500 | $787,500 | - | - | $800,000 | $800,000 | $800,000 | UFA | ||
| Total | - | - | $1,575,000 | $1,575,000 | $1,575,000 |
Jonny Brodzinski signed a $1,525,000 2-year contract with the New York Rangers and General Manager Chris Drury on February 28, 2022 with an AAV of $762,500. This contract will start in 2022-23 and end after the 2023-24 season. In the first season of the contract the cap hit was equivalent to 0.92% of the salary cap.
Standard Contract (UFA) ( ) (0 ratings)
| Season | Age* | Clause | Cap Hit | AAV | Perf. Bonus | Sign. Bonus | Salary | Compensation | Minors Salary | Status | |
|---|---|---|---|---|---|---|---|---|---|---|---|
| 2022-23 | 29 | $762,500 | $762,500 | - | - | $750,000 | $750,000 | $315,000 | UFA | ||
| 2023-24 | 30 | $762,500 | $762,500 | - | - | $775,000 | $775,000 | $325,000 | UFA | ||
| Total | - | - | $1,525,000 | $1,525,000 | $640,000 |
Jonny Brodzinski signed a $750,000 1-year contract with the New York Rangers and General Manager Jeff Gorton on April 19, 2021 with an AAV of $750,000. This contract will start in 2021-22 and end after the 2021-22 season. In the first season of the contract the cap hit was equivalent to 0.92% of the salary cap.
Standard Contract (UFA) ( ) (0 ratings)
| Season | Age* | Clause | Cap Hit | AAV | Perf. Bonus | Sign. Bonus | Salary | Compensation | Minors Salary | Status | |
|---|---|---|---|---|---|---|---|---|---|---|---|
| 2021-22 | 28 | $750,000 | $750,000 | - | - | $750,000 | $750,000 | $215,000 | UFA | ||
| Total | - | - | $750,000 | $750,000 | $215,000 |
Jonny Brodzinski signed a $700,000 1-year contract with the New York Rangers and General Manager Jeff Gorton on October 9, 2020 with an AAV of $700,000. This contract will start in 2020-21 and end after the 2020-21 season. In the first season of the contract the cap hit was equivalent to 0.86% of the salary cap.
Standard Contract (UFA) ( ) (0 ratings)
| Season | Age* | Clause | Cap Hit | AAV | Perf. Bonus | Sign. Bonus | Salary | Compensation | Minors Salary | Status | |
|---|---|---|---|---|---|---|---|---|---|---|---|
| 2020-21 | 27 | $700,000 | $700,000 | - | - | $700,000 | $700,000 | $200,000 | UFA | ||
| Total | - | - | $700,000 | $700,000 | $200,000 |
Jonny Brodzinski signed a $700,000 1-year contract with the San Jose Sharks and General Manager Doug Wilson on July 2, 2019 with an AAV of $700,000. This contract will start in 2019-20 and end after the 2019-20 season. In the first season of the contract the cap hit was equivalent to 0.86% of the salary cap.
Standard Contract (UFA) ( ) (0 ratings)
| Season | Age* | Clause | Cap Hit | AAV | Perf. Bonus | Sign. Bonus | Salary | Compensation | Minors Salary | Status | |
|---|---|---|---|---|---|---|---|---|---|---|---|
| 2019-20 | 26 | $700,000 | $700,000 | - | - | $700,000 | $700,000 | $200,000 | UFA-Grp6 | ||
| Total | - | - | $700,000 | $700,000 | $200,000 |
Jonny Brodzinski signed a $1,300,000 2-year contract with the Los Angeles Kings and General Manager Rob Blake on July 14, 2017 with an AAV of $650,000. This contract will start in 2017-18 and end after the 2018-19 season. In the first season of the contract the cap hit was equivalent to 0.87% of the salary cap.
Standard Contract (RFA) ( ) (0 ratings)
| Season | Age* | Clause | Cap Hit | AAV | Perf. Bonus | Sign. Bonus | Salary | Compensation | Minors Salary | Status | |
|---|---|---|---|---|---|---|---|---|---|---|---|
| 2017-18 | 24 | $650,000 | $650,000 | - | - | $650,000 | $650,000 | $200,000 | RFA-arb | ||
| 2018-19 | 25 | $650,000 | $650,000 | - | - | $650,000 | $650,000 | $650,000 | RFA-arb | ||
| Total | - | - | $1,300,000 | $1,300,000 | $850,000 |
Jonny Brodzinski signed a $1,617,500 2-year contract with the Los Angeles Kings and General Manager Dean Lombardi on April 1, 2015 with an AAV of $808,750. This contract will start in 2015-16 and end after the 2016-17 season. In the first season of the contract the cap hit was equivalent to 1.13% of the salary cap.
Entry Level Contract ( ) (0 ratings)
| Season | Age* | Clause | Cap Hit | AAV | Perf. Bonus | Sign. Bonus | Salary | Compensation | Minors Salary | Status | |
|---|---|---|---|---|---|---|---|---|---|---|---|
| 2015-16 | 22 | $808,750 | $925,000 | $232,500 | $92,500 | $600,000 | $692,500 | $70,000 | ELC | ||
| 2016-17 | 23 | $808,750 | $925,000 | - | $92,500 | $832,500 | $925,000 | $70,000 | ELC | ||
| Total | $232,500 | $185,000 | $1,432,500 | $1,617,500 | $140,000 |
Career Statistics
| Regular Season | Playoffs | |||||||||||||||||||
|---|---|---|---|---|---|---|---|---|---|---|---|---|---|---|---|---|---|---|---|---|
| Season | League | Team | GP | G | A | Pts | +/- | PIM | Shots | Sh% | TOI/G | GP | G | A | Pts | +/- | PIM | Shots | Sh% | TOI/G |
| 2009-10 | High-MN | Blaine | 30 | 22 | 26 | 48 | 18 | 5 | 6 | 6 | ||||||||||
| 2010-11 | High-MN | Blaine | 30 | 31 | 29 | 60 | 18 | 5 | 4 | 4 | 8 | 2 | ||||||||
| 2010-11 | UMHSEL | Northwest | 21 | 11 | 14 | 25 | 10 | 3 | 2 | 3 | 5 | 2 | ||||||||
| 2010-11 | USHL | Fargo | 10 | 2 | 3 | 5 | +2 | 2 | 25 | 800.0 | 2 | 0.0 | ||||||||
| 2011-12 | USHL | Fargo | 58 | 10 | 12 | 22 | +5 | 18 | 164 | 610.0 | 6 | 1 | 1 | 2 | +3 | 20 | 500.0 | |||
| 2012-13 | WCHA | St. Cloud State | 42 | 22 | 11 | 33 | 10 | |||||||||||||
| 2013-14 | NCHC | St. Cloud State | 38 | 21 | 20 | 41 | 16 | |||||||||||||
| 2014-15 | NCHC | St. Cloud State | 40 | 21 | 17 | 38 | 49 | |||||||||||||
| 2015-16 | AHL | Ontario | 65 | 15 | 13 | 28 | +11 | 16 | 173 | 870.0 | 4 | 2 | 1 | 3 | +2 | 2 | 14 | 1,430.0 | ||
| 2016-17 | NHL | Los Angeles Kings | 6 | 0 | 2 | 2 | +2 | 2 | 17 | 0.0 | 12:17 | |||||||||
| 2016-17 | AHL | Ontario Reign | 59 | 27 | 22 | 49 | +3 | 12 | 5 | 2 | 2 | 4 | +1 | 2 | ||||||
| 2017-18 | NHL | Los Angeles Kings | 35 | 4 | 2 | 6 | +4 | 6 | 53 | 7.6 | 9:30 | |||||||||
| 2017-18 | AHL | Ontario Reign | 29 | 13 | 17 | 30 | +9 | 18 | 4 | 1 | 2 | 3 | +2 | 2 | ||||||
| 2018-19 | NHL | Los Angeles Kings | 13 | 2 | 1 | 3 | 2 | 17 | 11.8 | 9:55 | ||||||||||
| 2018-19 | AHL | Ontario Reign | 3 | 1 | 0 | 1 | -3 | 2 | ||||||||||||
| 2019-20 | AHL | San Jose Barracuda | 44 | 14 | 16 | 30 | -1 | 26 | ||||||||||||
| 2019-20 | NHL | San Jose Sharks | 3 | 0 | 1 | 1 | 5 | 0.0 | 7:24 | |||||||||||
| 2020-21 | AHL | Hartford Wolf Pack | 14 | 6 | 11 | 17 | +4 | 8 | ||||||||||||
| 2020-21 | NHL | New York Rangers | 5 | 1 | 0 | 1 | 4 | 7 | 14.3 | 11:20 | ||||||||||
| 2021-22 | AHL | Hartford Wolf Pack | 36 | 18 | 21 | 39 | +8 | 34 | ||||||||||||
| 2021-22 | NHL | New York Rangers | 22 | 1 | 1 | 2 | +1 | 10 | 34 | 2.9 | 10:51 | 1 | 2 | 1 | 0.0 | 10:39 | ||||
| 2022-23 | NHL | New York Rangers | 17 | 1 | 1 | 2 | +3 | 8 | 27 | 3.7 | 9:19 | |||||||||
| 2022-23 | AHL | Hartford Wolf Pack | 47 | 21 | 27 | 48 | +8 | 39 | 5 | 1 | 1 | 2 | -4 | |||||||
| 2023-24 | AHL | Hartford Wolf Pack | 16 | 11 | 14 | 25 | +8 | 4 | ||||||||||||
| 2023-24 | NHL | New York Rangers | 57 | 6 | 13 | 19 | -3 | 8 | 89 | 6.7 | 11:08 | 3 | -1 | 2 | 0.0 | 8:36 | ||||
| 2024-25 | NHL | New York Rangers | 51 | 12 | 7 | 19 | +6 | 4 | 73 | 16.4 | 11:41 | |||||||||
| 2025-26 | NHL | New York Rangers | 55 | 6 | 10 | 16 | -1 | 12 | 63 | 9.5 | 11:10 | |||||||||
| NHL Career | 264 | 33 | 38 | 71 | +12 | 56 | 385 | 8.6 | 10:49 | 4 | -1 | 2 | 3 | 0.0 | 9:07 | |||||