
 Jared Spurgeon
| Position | Right Defense | Current Team | Minnesota Wild |
| Shoots | Right | Current Contract | 7 years ($7.6M CapHit) |
| Height | 5'9" | Expires | 2026-27 |
| Weight (lbs) | 166 | Expiry Age (Jun 30) | 37 |
| Age (DOB) | 36 (Nov 29, 1989) | Expiry Status | UFA |
| Drafted | 2008, Round 6, Overall 156 (NYI) |
| Date | Team | Transaction | |
|---|---|---|---|
| Jan 23, 2025 | Minnesota Wild | Activated from IR | |
| Jan 6, 2025 | Minnesota Wild | Placed on IR | |
| Sep 14, 2019 | Minnesota Wild | Signed 7 years @ $7.575M AAV starting in 2020-21 | |
| Dec 21, 2015 | Minnesota Wild | Signed 4 years @ $5.188M AAV starting in 2016-17 | |
| Jul 5, 2013 | Minnesota Wild | Signed 3 years @ $2.667M AAV starting in 2013-14 | |
| Sep 23, 2010 | Minnesota Wild | Signed to an entry level contract. |
Player Card(s)
URL: https://thestanleycap.com/cdn/player_cards/20252026/jared-spurgeon-8474716.png
URL: https://thestanleycap.com/cdn/player_cards/20242025/jared-spurgeon-8474716.png
URL: https://thestanleycap.com/cdn/player_cards/20232024/jared-spurgeon-8474716.png
About Player Cards
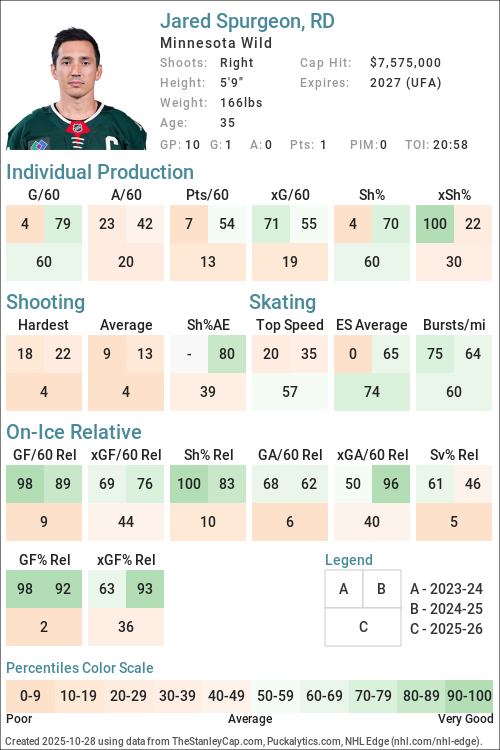
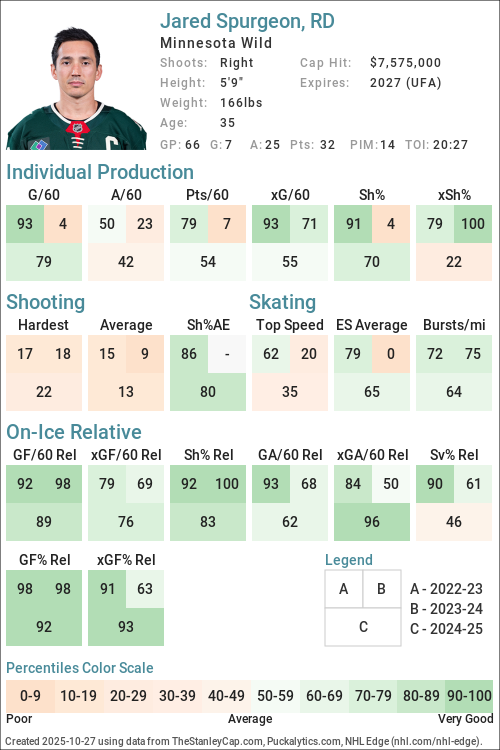
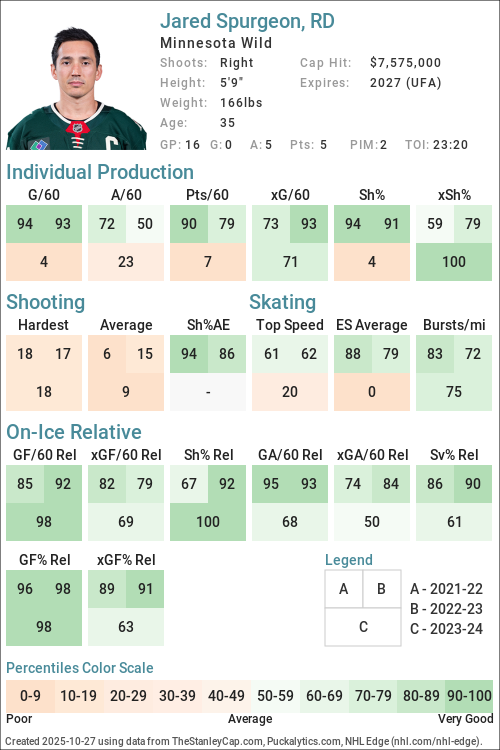
Player cards present an infographic of a players performance using a series of Player Archetypes developed for Puckalytics.com and TheStanleyCap.com. The boxes in the rink image show the archetype ratings for the season specified in the card while the graphs to the right show the five-year trends for those archetypes.
Except for Faceoffs, the values shown are the players z-score (standard deviation from the mean) for the specific metric used to calculate the archetype values. When calculating z-scores forwards were compared to forwards and defensemen were compared to defensemen. Positive values indicate the player is above average and shaded in blue, while negative values indicate the player is below average and shaded in pink. The five year trend charts show a range of -4.0 to 4.0.
The value shown for Faceoffs is the faceoff winning percentage rather than their z-score with winning percentages below 50 in pink shades and above 50 in blue shades.
All archetypes are 5v5 except 5v4 TOI, 4v5 TOI, Skating (even strength) and Faceoffs (all situations). Archetypes use regular season data only.
Archetypes Summary
- Sniper - Measures the to score above the expected goal rate.
- Rebound - Measures the percent of a players shot attempts that come from rebounds (forwards only).
- 5v4 TOI - Powerplay ice time, calculated as the percentage of his teams 5v4 ice time that the player was on the ice for.
- Shooter - Measures whether a players points come from shots (goals or assists on rebounds from his shots).
- Producer - Measures a players ability to produce goals and assists, adjusted for quality of teammates.
- Playmaker - Measures whether a players points come from passes.
- Drive - Measures a players ability to drive puck possession and generate shot attempts for his team.
- Rush - Measures the percent of a players shot attempts that come from rush plays
- Possession - An indicator of a players ability to improve his teams puck possession game.
- Faceoffs - Faceoff Winning Percentage (min. 75 faceoffs taken).
- 5v5 TOI - The percentage of his teams 5v5 TOI that the player was on the ice for.
- Suppress - Measures a players ability to suppress opponent puck possession and shot attempts against.
- Skating - An indicator of a players skating ability, or speed bursts above 20mph per mile skated.
- Defend - An indicator of a players ability to suppress shot quality against.
- 4v5 TOI - Penalty Kill ice time, calculated as the percentage of his teams 4v5 ice time that the player was on the ice for.
Data Sources
- Salary data is from TheStanleyCap.com
- Skating data is from NHL Edge
- Other statistics are from Puckalytics.com and derived from data from NHL.com
Terms of Use
You are free to use include player cards in written articles, share on social media, or on other public websites under the following conditions:
- You credit TheStanleyCap.com as the source and provide a link back to TheStanleyCap.com or this player page.
- You do not mass copy/duplicate/publish dozens or hundreds of player cards. A few, or a handful for a written article is fine. Be reasonable. Fair use rules apply.
- If you are a high-traffic website you must download and host the image(s) on your site rather than overload TheStanleyCap servers with traffic.
Note: Player cards will update daily throughout the season so if you want to include snapshot then you must download the image.
If you have any questions, send an e-mail to the e-mail address at the top of this page.
Read Introducing Player Archetypes on HockeyAnalysis.com for more details on archetype calculations.
Core Archetypes
| Season | Team(s) | GP | TOI | Producer | Playmaker | Shooter | Sniper | Rebound | Rush | Skating | Defend |
|---|---|---|---|---|---|---|---|---|---|---|---|
| 2015-16 | MIN | 77 | -0.83 | -1.19 | 0.22 | 1.34 | - | 1.45 | - | -1.32 | |
| 2016-17 | MIN | 76 | 0.85 | 0.57 | 0.38 | 0.50 | - | -0.33 | - | 0.74 | |
| 2017-18 | MIN | 61 | 1.61 | 1.93 | 0.03 | 0.21 | - | -0.15 | - | -1.50 | |
| 2018-19 | MIN | 82 | 1.89 | 1.01 | 2.21 | 2.26 | - | -0.45 | - | 0.49 | |
| 2019-20 | MIN | 62 | 0.02 | -0.75 | 1.44 | 2.04 | - | -0.17 | - | 0.46 | |
| 2020-21 | MIN | 54 | -0.37 | -0.58 | 0.08 | 0.12 | - | 0.92 | - | -0.44 | |
| 2021-22 | MIN | 65 | 0.91 | -0.07 | 1.90 | 1.50 | - | 0.82 | 0.93 | 1.01 | |
| 2022-23 | MIN | 79 | 0.62 | -0.11 | 1.58 | 0.91 | - | 0.64 | 0.37 | 1.28 | |
| 2023-24 | MIN | 16 | -1.32 | -0.88 | -1.01 | -3.08 | - | -1.10 | 0.49 | 0.24 | |
| 2024-25 | MIN | 66 | -0.03 | -0.46 | 0.55 | 0.79 | - | -0.68 | 0.11 | -0.10 | |
| 2025-26 | MIN | 79 | -0.84 | -0.56 | -0.79 | -0.82 | - | 2.78 | -0.33 | 1.12 |
Situational and Secondary Archetypes
| Season | Team(s) | GP | TOI | 5v5 TOI | 5v4 TOI | 4v5 TOI | Possession | Drive | Suppress | Faceoffs |
|---|---|---|---|---|---|---|---|---|---|---|
| 2015-16 | MIN | 77 | 0.88 | -0.05 | 0.55 | 1.29 | 1.48 | 0.37 | - | |
| 2016-17 | MIN | 76 | 1.11 | 0.73 | 0.74 | 1.05 | 1.09 | 0.48 | - | |
| 2017-18 | MIN | 61 | 1.08 | 0.94 | 0.95 | 1.54 | 1.33 | 0.92 | - | |
| 2018-19 | MIN | 82 | 1.04 | 0.59 | 0.55 | 0.56 | 0.89 | -0.11 | - | |
| 2019-20 | MIN | 62 | 0.30 | 0.59 | 0.67 | 1.32 | 1.58 | 0.35 | - | |
| 2020-21 | MIN | 54 | 0.08 | 0.77 | 0.11 | 0.53 | 0.61 | 0.07 | - | |
| 2021-22 | MIN | 65 | -0.62 | 1.18 | 0.06 | 1.94 | 1.45 | 1.49 | - | |
| 2022-23 | MIN | 79 | 0.17 | -0.36 | 1.21 | 0.91 | 0.80 | 0.56 | - | |
| 2023-24 | MIN | 16 | -0.07 | 0.84 | 1.35 | 0.87 | 1.06 | 0.10 | - | |
| 2024-25 | MIN | 66 | 0.14 | 0.29 | -0.85 | 1.76 | 1.03 | 1.63 | - | |
| 2025-26 | MIN | 79 | -0.39 | -0.20 | 0.26 | 0.17 | -0.19 | 0.55 | - |
5v5 Individual Stats
| Season | Team(s) | GP | TOI | G/60 | A/60 | Pts/60 | xG/60 | GAE/60 | Sh% | xSh% | Sh%AE | %SA Rush | %SA Reb. |
|---|---|---|---|---|---|---|---|---|---|---|---|---|---|
| 2015-16 | MIN | 77 | 1307:05 | 0.28 | 0.23 | 0.50 | 0.15 | 0.12 | 6.98 | 3.92 | 3.06 | 2.42 | 1.61 |
| 2016-17 | MIN | 76 | 1344:45 | 0.27 | 0.85 | 1.12 | 0.22 | 0.05 | 6.06 | 5.03 | 1.03 | 0.72 | 3.60 |
| 2017-18 | MIN | 61 | 1066:46 | 0.22 | 0.73 | 0.96 | 0.19 | 0.03 | 5.80 | 5.00 | 0.80 | 1.03 | 4.12 |
| 2018-19 | MIN | 82 | 1452:06 | 0.41 | 0.83 | 1.24 | 0.21 | 0.20 | 9.09 | 4.58 | 4.51 | 0.65 | 0.65 |
| 2019-20 | MIN | 62 | 986:34 | 0.49 | 0.49 | 0.97 | 0.24 | 0.24 | 9.20 | 4.61 | 4.59 | 0.79 | 1.57 |
| 2020-21 | MIN | 54 | 870:41 | 0.28 | 0.48 | 0.76 | 0.27 | 0.01 | 6.35 | 6.19 | 0.16 | 2.08 | 2.08 |
| 2021-22 | MIN | 65 | 950:53 | 0.44 | 0.82 | 1.26 | 0.25 | 0.19 | 8.33 | 4.75 | 3.58 | 1.79 | 0.89 |
| 2022-23 | MIN | 79 | 1262:22 | 0.43 | 0.67 | 1.09 | 0.31 | 0.12 | 7.38 | 5.36 | 2.02 | 1.70 | 3.41 |
| 2023-24 | MIN | 16 | 239:22 | 0.00 | 0.50 | 0.50 | 0.20 | -0.20 | 0.00 | 7.35 | -7.35 | 0.00 | 0.00 |
| 2024-25 | MIN | 66 | 1122:05 | 0.27 | 0.59 | 0.86 | 0.18 | 0.08 | 5.68 | 3.93 | 1.75 | 0.00 | 0.79 |
| 2025-26 | MIN | 79 | 1237:03 | 0.10 | 0.48 | 0.58 | 0.18 | -0.08 | 2.60 | 4.80 | -2.20 | 2.80 | 3.74 |
5v5 On Ice Stats
| Season | Team(s) | GP | TOI | SAF/60 | GF/60 | xGF/60 | SAA/60 | GA/60 | xGA/60 | GF% | xGF% | xGF Rel | xGA Rel | xGF% Rel |
|---|---|---|---|---|---|---|---|---|---|---|---|---|---|---|
| 2015-16 | MIN | 77 | 1307:05 | 40.40 | 2.48 | 2.18 | 39.34 | 2.11 | 1.91 | 54.00 | 53.31 | 0.27 | -0.08 | 4.34 |
| 2016-17 | MIN | 76 | 1344:45 | 43.28 | 3.08 | 2.64 | 40.33 | 2.01 | 1.86 | 60.53 | 58.59 | 0.50 | -0.11 | 6.59 |
| 2017-18 | MIN | 61 | 1066:46 | 42.63 | 1.69 | 2.44 | 40.95 | 2.64 | 1.88 | 38.96 | 56.45 | 0.21 | -0.25 | 5.30 |
| 2018-19 | MIN | 82 | 1452:06 | 45.29 | 2.48 | 2.50 | 40.66 | 2.31 | 2.04 | 51.72 | 55.07 | 0.12 | -0.09 | 2.36 |
| 2019-20 | MIN | 62 | 986:34 | 45.67 | 3.16 | 2.62 | 40.99 | 2.31 | 1.96 | 57.78 | 57.24 | 0.39 | -0.16 | 5.90 |
| 2020-21 | MIN | 54 | 870:41 | 39.21 | 2.55 | 2.27 | 41.55 | 2.48 | 2.05 | 50.68 | 52.58 | -0.00 | -0.18 | 2.08 |
| 2021-22 | MIN | 65 | 950:53 | 46.13 | 3.34 | 2.73 | 36.66 | 1.77 | 2.12 | 65.43 | 56.24 | 0.22 | -0.08 | 3.07 |
| 2022-23 | MIN | 79 | 1262:22 | 43.73 | 2.71 | 2.55 | 39.88 | 1.66 | 2.28 | 61.96 | 52.73 | 0.14 | -0.24 | 3.89 |
| 2023-24 | MIN | 16 | 239:22 | 42.86 | 3.01 | 2.42 | 37.60 | 1.75 | 2.05 | 63.16 | 54.17 | 0.04 | 0.00 | 0.40 |
| 2024-25 | MIN | 66 | 1122:05 | 42.35 | 2.35 | 2.19 | 37.91 | 2.03 | 1.98 | 53.66 | 52.46 | 0.12 | -0.40 | 6.01 |
| 2025-26 | MIN | 79 | 1237:03 | 40.35 | 1.94 | 2.48 | 41.86 | 1.79 | 2.45 | 51.95 | 50.30 | -0.12 | -0.26 | 1.32 |
NHL Edge Stats
| Skating | Shooting | Zone Time | |||||||||||
|---|---|---|---|---|---|---|---|---|---|---|---|---|---|
| Season | GP | Top Speed | Bursts>20/mi | Avg. Speed | Top Speed | Avg. Speed | %Long Range | %Mid Range | %High Danger | ES DZ% | ES NZ% | ES OZ% | |
| This table is for Basic and Premium subscribers only. To view please login to and/or subscribe to one of our subscription plans. | |||||||||||||
Legend
| Percentile 0-25 | Percentile 25-50 | Percentile 50-75 | Percentile 75-100 |
5v5 Defense Pairs
| Season | Teammate | Team | TOI | GF/60 | GA/60 | GF% | xGF/60 | xGA/60 | xGF% | xGF Rel | xGA Rel | xGF% Rel |
|---|
Glossary
| Type | Statistic | Definition |
|---|---|---|
| Individual | G/60 | Goals Against per 60 minutes. |
| Individual | A/60 | Assists per 60 minutes. |
| Individual | Pts/60 | Points per 60 minutes. |
| Individual | xG/60 | Expected Goals per 60 minutes. |
| Individual | GAE/60 | Goals Above Expected (G/60 - xG/60). |
| Individual | Sh% | Shooting Percentage. |
| Individual | xSh% | Expected Shooting Percentage. |
| Individual | Sh%AE | Shooting percentage above expected (Sh% - xSh%). |
| Individual | %SA Rush | Percentage of shot attempts determined to be on the rush. |
| Individual | %SA Reb. | Percentage of shot attempts determined to be from rebounds. |
| On Ice | SAF/60 | Shot Attempts For per 60 minutes. |
| On Ice | GF/60 | Goals For per 60 minutes. |
| On Ice | xGF/60 | Expected Goals For per 60 minutes. |
| On Ice | SAA/60 | Shot Attempts Against per 60 minutes (lower is better). |
| On Ice | GA/60 | Goals Against per 60 minutes (lower is better). |
| On Ice | xGA/60 | Expected Goals Against per 60 minutes (lower is better). |
| On Ice | GF% | Goals For Percentage = Goals For / (Goals For + Goals Against) |
| On Ice | xGF% | Expected Goals For Percentage = Expected Goals For / (Expected Goals For + Expected Goals Against) |
| On Ice | xGF Rel | xGF/60 when On Ice - xGF/60 when not On Ice. |
| On Ice | xGA Rel | xGA/60 when On Ice - xGA/60 when not On Ice (lower is better). |
| On Ice | xGF% Rel | xGF% when On Ice - xGF% when not On Ice. |
News and Opinions
-
Wild 2025-26 Report Cards: Jared Spurgeon at The Hockey Writers (Mon Jul 6, 2026)
-
Spurgeon’s Unpredictable Surge Took Him From NHL Long Shot To Minnesota’s Leader at Hockey Wilderness (Mon Jun 8, 2026)
-
Will the Wild Pass the Torch On the Blue Line This Summer? at Hockey Wilderness (Tue May 26, 2026)
-
The Wild Can’t Keep Rolling With Spurgeon and Middleton at Hockey Wilderness (Thu May 7, 2026)
-
Jared Spurgeon’s Injury Will Test the Wild's Resilience at Hockey Wilderness (Wed Apr 1, 2026)
-
Cernak scores on crazy carom late in 3rd period as the Wild beat the Lightning 6-3 at Yahoo Sports NHL (Tue Mar 24, 2026)
-
Jared Spurgeon, other Wild players and coaches pay tribute to Jessi Pierce at Gone Puck Wild (Mon Mar 23, 2026)
-
Jared Spurgeon Is the Wild's Quiet Heartbeat at Hockey Wilderness (Wed Mar 18, 2026)
-
The NHL Needs More Players Like Jared Spurgeon at Hockey Wilderness (Mon Mar 16, 2026)
-
'He's The Captain For A Reason': From Undersized Prospect To Wild Captain, Jared Spurgeon Reaches 1,000 Games at Yahoo Sports NHL (Sat Mar 14, 2026)
-
Zach Whitecloud Is Worth A Look For the Wild at Hockey Wilderness (Tue Feb 10, 2026)
-
Why Isn't Zeev Buium Quarterbacking the Wild's Power Play More Often? at Hockey Wilderness (Wed Dec 10, 2025)
-
Jared Spurgeon Is Invincible For The Wild at Hockey Wilderness (Thu Nov 27, 2025)
-
Indefinitely Might Have Ended For Jared Spurgeon at Hockey Wilderness (Fri Oct 31, 2025)
-
Top 10 Undersized NHL Players at The Hockey Writers (Mon Sep 29, 2025)
-
Wild 2024-25 Report Cards: Jake Middleton & Jared Spurgeon at The Hockey Writers (Mon Aug 18, 2025)
-
The Wild Shouldn’t Be Thinking About Trading Jared Spurgeon Right Now at Hockey Wilderness (Tue Aug 12, 2025)
-
The State of Hockey... In the State of Hockey (Week Eight Edition) at Gone Puck Wild (Tue Dec 3, 2024)
-
Who's Next in Line for the "C" in Minnesota? at Gone Puck Wild (Sun Oct 27, 2024)
-
DAB Trade Series: Minnesota Wild at Devils Army (Wed May 1, 2019)
Current Contract
Jared Spurgeon signed a $53,025,000 7-year contract with the Minnesota Wild and General Manager Bill Guerin on September 14, 2019 with an AAV of $7,575,000. This contract will start in 2020-21 and end after the 2026-27 season. In the first season of the contract the cap hit was equivalent to 9.29% of the salary cap.
Standard Contract (UFA) ( ) (0 ratings)
Jared Spurgeon signed a $20,750,000 4-year contract with the Minnesota Wild and General Manager Chuck Fletcher on December 21, 2015 with an AAV of $5,187,500. This contract will start in 2016-17 and end after the 2019-20 season. In the first season of the contract the cap hit was equivalent to 7.11% of the salary cap.
Standard Contract (RFA) ( ) (0 ratings)
| Season | Age* | Clause | Cap Hit | AAV | Perf. Bonus | Sign. Bonus | Salary | Compensation | Minors Salary | Status | |
|---|---|---|---|---|---|---|---|---|---|---|---|
| 2016-17 | 26 | $5,187,500 | $5,187,500 | - | - | $4,250,000 | $4,250,000 | $4,250,000 | RFA-arb | ||
| 2017-18 | 27 | M-NTC | $5,187,500 | $5,187,500 | - | - | $5,500,000 | $5,500,000 | $5,500,000 | UFA | |
| 2018-19 | 28 | M-NTC | $5,187,500 | $5,187,500 | - | - | $5,500,000 | $5,500,000 | $5,500,000 | UFA | |
| 2019-20 | 29 | NMC | $5,187,500 | $5,187,500 | - | - | $5,500,000 | $5,500,000 | $5,500,000 | UFA | |
| Total | - | - | $20,750,000 | $20,750,000 | $20,750,000 |
Jared Spurgeon signed a $8,000,000 3-year contract with the Minnesota Wild and General Manager Chuck Fletcher on July 5, 2013 with an AAV of $2,666,667. This contract will start in 2013-14 and end after the 2015-16 season. In the first season of the contract the cap hit was equivalent to 4.15% of the salary cap.
Standard Contract (RFA) ( ) (0 ratings)
| Season | Age* | Clause | Cap Hit | AAV | Perf. Bonus | Sign. Bonus | Salary | Compensation | Minors Salary | Status | |
|---|---|---|---|---|---|---|---|---|---|---|---|
| 2013-14 | 23 | $2,666,667 | $2,666,667 | - | - | $1,500,000 | $1,500,000 | $1,500,000 | RFA | ||
| 2014-15 | 24 | $2,666,667 | $2,666,667 | - | - | $2,900,000 | $2,900,000 | $2,900,000 | RFA-arb | ||
| 2015-16 | 25 | $2,666,667 | $2,666,667 | - | - | $3,600,000 | $3,600,000 | $3,600,000 | RFA-arb | ||
| Total | - | - | $8,000,000 | $8,000,000 | $8,000,000 |
Jared Spurgeon signed a $1,580,000 3-year contract with the Minnesota Wild and General Manager Chuck Fletcher on September 23, 2010 with an AAV of $526,667. This contract will start in 2010-11 and end after the 2012-13 season. In the first season of the contract the cap hit was equivalent to 0.89% of the salary cap.
Entry Level Contract ( ) (0 ratings)
| Season | Age* | Clause | Cap Hit | AAV | Perf. Bonus | Sign. Bonus | Salary | Compensation | Minors Salary | Status | |
|---|---|---|---|---|---|---|---|---|---|---|---|
| 2010-11 | 20 | $526,667 | $526,667 | - | $10,000 | $500,000 | $510,000 | $50,000 | ELC | ||
| 2011-12 | 21 | $526,667 | $526,667 | - | $10,000 | $525,000 | $535,000 | $50,000 | ELC | ||
| 2012-13 | 22 | $526,667 | $526,667 | - | $10,000 | $525,000 | $535,000 | $50,000 | ELC | ||
| Total | - | $30,000 | $1,550,000 | $1,580,000 | $150,000 |
Career Statistics
| Regular Season | Playoffs | |||||||||||||||||||
|---|---|---|---|---|---|---|---|---|---|---|---|---|---|---|---|---|---|---|---|---|
| Season | League | Team | GP | G | A | Pts | +/- | PIM | Shots | Sh% | TOI/G | GP | G | A | Pts | +/- | PIM | Shots | Sh% | TOI/G |
| 2002-03 | AMBHL | Knights of Columbus Squires Btm | 36 | 2 | 19 | 21 | 12 | |||||||||||||
| 2003-04 | AMBHL | Knights of Columbus Squires Btm | 37 | 16 | 19 | 35 | 58 | |||||||||||||
| 2003-04 | AEHL U15 | Knights of Columbus Squires U15 | 3 | 2 | 2 | 4 | ||||||||||||||
| 2004-05 | AMHL | K of C Pats | 26 | 9 | 21 | 30 | 16 | |||||||||||||
| 2005-06 | WHL | Spokane | 46 | 3 | 9 | 12 | -10 | 28 | ||||||||||||
| 2006-07 | WHL | Spokane | 38 | 4 | 15 | 19 | -2 | 16 | ||||||||||||
| 2007-08 | WHL | Spokane | 69 | 12 | 31 | 43 | +36 | 19 | 21 | 5 | 5 | +7 | 16 | |||||||
| 2007-08 | M-Cup | Spokane | 4 | 1 | 1 | 0.0 | ||||||||||||||
| 2008-09 | WHL | Spokane | 59 | 10 | 35 | 45 | +36 | 37 | 12 | 2 | 3 | 5 | +3 | 10 | ||||||
| 2009-10 | WHL | Spokane | 54 | 8 | 43 | 51 | +4 | 18 | 7 | 4 | 4 | -2 | 2 | |||||||
| 2010-11 | NHL | Minnesota Wild | 53 | 4 | 8 | 12 | -1 | 2 | 38 | 10.5 | 15:04 | |||||||||
| 2010-11 | AHL | Houston | 23 | 2 | 7 | 9 | -5 | 10 | 34 | 588.0 | 23 | 1 | 10 | 11 | +5 | 10 | ||||
| 2011-12 | NHL | Minnesota Wild | 70 | 3 | 20 | 23 | -4 | 6 | 92 | 3.3 | 21:36 | |||||||||
| 2012-13 | Swiss | Langnau | 12 | 3 | 4 | 7 | 6 | |||||||||||||
| 2012-13 | NHL | Minnesota Wild | 39 | 5 | 10 | 15 | +1 | 4 | 67 | 7.5 | 21:33 | 5 | -3 | 2 | 8 | 0.0 | 21:15 | |||
| 2013-14 | NHL | Minnesota Wild | 67 | 5 | 21 | 26 | +15 | 16 | 91 | 5.5 | 22:38 | 13 | 3 | 3 | 6 | 2 | 22 | 13.6 | 24:04 | |
| 2014-15 | NHL | Minnesota Wild | 66 | 9 | 16 | 25 | +3 | 6 | 128 | 7.0 | 22:37 | 10 | 1 | 3 | 4 | 4 | 11 | 9.1 | 21:20 | |
| 2015-16 | NHL | Minnesota Wild | 77 | 11 | 18 | 29 | +11 | 14 | 122 | 9.0 | 22:41 | 6 | 2 | 3 | 5 | +1 | 4 | 10 | 20.0 | 26:00 |
| 2016-17 | NHL | Minnesota Wild | 76 | 10 | 28 | 38 | +33 | 20 | 144 | 6.9 | 24:02 | 5 | 1 | 1 | -1 | 13 | 0.0 | 25:20 | ||
| 2017-18 | NHL | Minnesota Wild | 61 | 9 | 28 | 37 | -6 | 8 | 110 | 8.2 | 24:33 | 5 | 1 | 1 | -4 | 3 | 0.0 | 21:48 | ||
| 2018-19 | NHL | Minnesota Wild | 82 | 14 | 29 | 43 | -1 | 20 | 152 | 9.2 | 24:09 | |||||||||
| 2019-20 | NHL | Minnesota Wild | 62 | 12 | 20 | 32 | -1 | 18 | 112 | 10.7 | 22:34 | 4 | 2 | 2 | 4 | -1 | 4 | 7 | 28.6 | 22:48 |
| 2020-21 | NHL | Minnesota Wild | 54 | 7 | 18 | 25 | -2 | 6 | 94 | 7.4 | 22:05 | 7 | 3 | 3 | -6 | 7 | 0.0 | 22:55 | ||
| 2021-22 | NHL | Minnesota Wild | 65 | 10 | 30 | 40 | +32 | 10 | 116 | 8.6 | 21:09 | 6 | 3 | 3 | +1 | 4 | 9 | 0.0 | 20:33 | |
| 2022-23 | NHL | Minnesota Wild | 79 | 11 | 23 | 34 | +32 | 14 | 149 | 7.4 | 21:49 | 6 | 2 | 2 | -6 | 4 | 7 | 0.0 | 24:07 | |
| 2023-24 | NHL | Minnesota Wild | 16 | 0 | 5 | 5 | +5 | 2 | 21 | 0.0 | 23:20 | |||||||||
| 2024-25 | WC | Canada | 8 | 0 | 2 | 2 | +7 | |||||||||||||
| 2024-25 | NHL | Minnesota Wild | 66 | 7 | 25 | 32 | +8 | 14 | 107 | 6.5 | 20:27 | 6 | 1 | 1 | +5 | 12 | 8.3 | 22:52 | ||
| 2025-26 | NHL | Minnesota Wild | 79 | 6 | 16 | 22 | +2 | 14 | 90 | 6.7 | 19:36 | 11 | 1 | 1 | -2 | 4 | 11 | 0.0 | 21:01 | |
| NHL Career | 1012 | 123 | 315 | 438 | +127 | 174 | 1633 | 7.5 | 21:55 | 84 | 9 | 22 | 31 | -16 | 28 | 120 | 7.5 | 22:46 | ||