
 Jared McCann
| Position | Center / Left Wing | Current Team | Seattle Kraken |
| Shoots | Left | Current Contract | 5 years ($5.0M CapHit) |
| Height | 6'1" | Expires | 2026-27 |
| Weight (lbs) | 191 | Expiry Age (Jun 30) | 31 |
| Age (DOB) | 30 (May 31, 1996) | Expiry Status | UFA |
| Drafted | 2014, Round 1, Overall 24 (VAN) |
| Date | Team | Transaction | |
|---|---|---|---|
| Dec 28, 2025 | Seattle Kraken | Activated from IR | |
| Dec 13, 2025 | Seattle Kraken | Placed on IR | |
| Nov 26, 2025 | Seattle Kraken | Activated from IR | |
| Oct 25, 2025 | Seattle Kraken | Placed on IR | |
| Mar 8, 2022 | Seattle Kraken | Signed 5 years @ $5.000M AAV starting in 2022-23 | |
| Sep 18, 2020 | Pittsburgh Penguins | Signed 2 years @ $2.940M AAV starting in 2020-21 | |
| Jul 1, 2018 | Florida Panthers | Signed 2 years @ $1.250M AAV starting in 2018-19 | |
| Jul 26, 2014 | Vancouver Canucks | Signed to an entry level contract. |
Player Card(s)
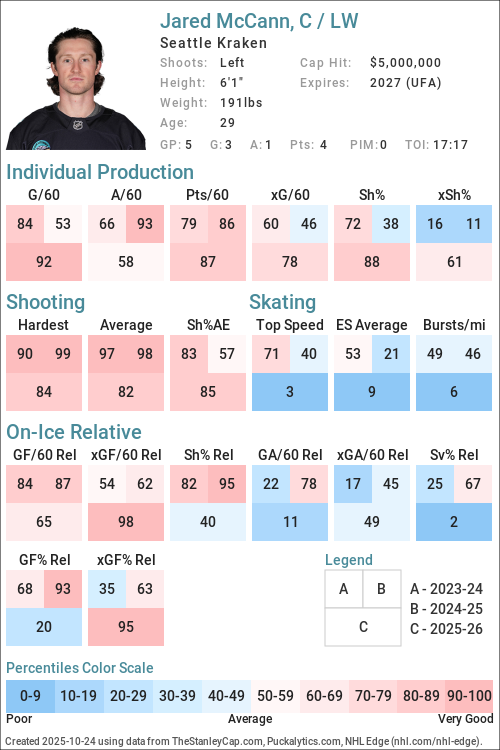
URL: https://thestanleycap.com/cdn/player_cards/20252026/jared-mccann-8477955.png
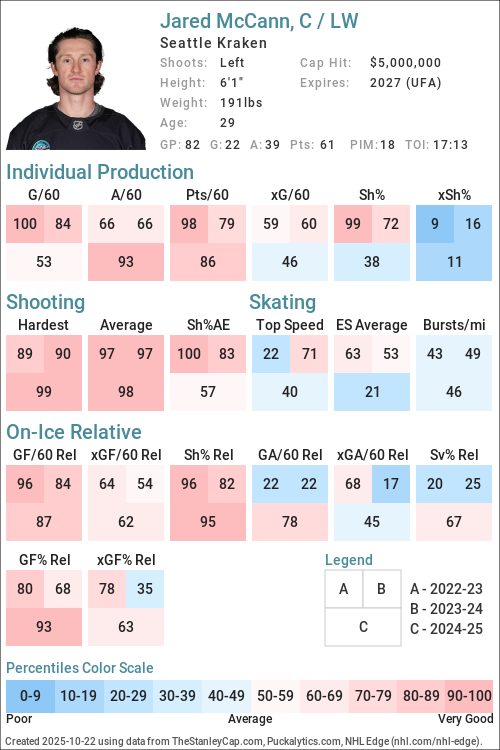
URL: https://thestanleycap.com/cdn/player_cards/20242025/jared-mccann-8477955.png
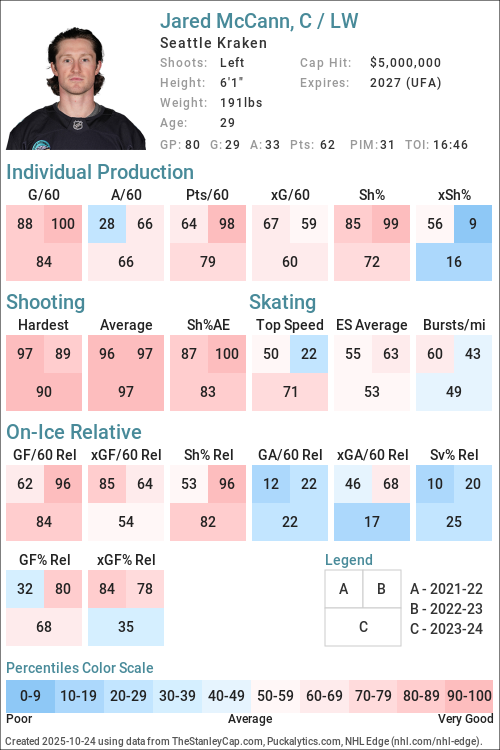
URL: https://thestanleycap.com/cdn/player_cards/20232024/jared-mccann-8477955.png
About Player Cards
Player cards present an infographic of a players performance using a series of Player Archetypes developed for Puckalytics.com and TheStanleyCap.com. The boxes in the rink image show the archetype ratings for the season specified in the card while the graphs to the right show the five-year trends for those archetypes.
Except for Faceoffs, the values shown are the players z-score (standard deviation from the mean) for the specific metric used to calculate the archetype values. When calculating z-scores forwards were compared to forwards and defensemen were compared to defensemen. Positive values indicate the player is above average and shaded in blue, while negative values indicate the player is below average and shaded in pink. The five year trend charts show a range of -4.0 to 4.0.
The value shown for Faceoffs is the faceoff winning percentage rather than their z-score with winning percentages below 50 in pink shades and above 50 in blue shades.
All archetypes are 5v5 except 5v4 TOI, 4v5 TOI, Skating (even strength) and Faceoffs (all situations). Archetypes use regular season data only.
Archetypes Summary
- Sniper - Measures the to score above the expected goal rate.
- Rebound - Measures the percent of a players shot attempts that come from rebounds (forwards only).
- 5v4 TOI - Powerplay ice time, calculated as the percentage of his teams 5v4 ice time that the player was on the ice for.
- Shooter - Measures whether a players points come from shots (goals or assists on rebounds from his shots).
- Producer - Measures a players ability to produce goals and assists, adjusted for quality of teammates.
- Playmaker - Measures whether a players points come from passes.
- Drive - Measures a players ability to drive puck possession and generate shot attempts for his team.
- Rush - Measures the percent of a players shot attempts that come from rush plays
- Possession - An indicator of a players ability to improve his teams puck possession game.
- Faceoffs - Faceoff Winning Percentage (min. 75 faceoffs taken).
- 5v5 TOI - The percentage of his teams 5v5 TOI that the player was on the ice for.
- Suppress - Measures a players ability to suppress opponent puck possession and shot attempts against.
- Skating - An indicator of a players skating ability, or speed bursts above 20mph per mile skated.
- Defend - An indicator of a players ability to suppress shot quality against.
- 4v5 TOI - Penalty Kill ice time, calculated as the percentage of his teams 4v5 ice time that the player was on the ice for.
Data Sources
- Salary data is from TheStanleyCap.com
- Skating data is from NHL Edge
- Other statistics are from Puckalytics.com and derived from data from NHL.com
Terms of Use
You are free to use include player cards in written articles, share on social media, or on other public websites under the following conditions:
- You credit TheStanleyCap.com as the source and provide a link back to TheStanleyCap.com or this player page.
- You do not mass copy/duplicate/publish dozens or hundreds of player cards. A few, or a handful for a written article is fine. Be reasonable. Fair use rules apply.
- If you are a high-traffic website you must download and host the image(s) on your site rather than overload TheStanleyCap servers with traffic.
Note: Player cards will update daily throughout the season so if you want to include snapshot then you must download the image.
If you have any questions, send an e-mail to the e-mail address at the top of this page.
Read Introducing Player Archetypes on HockeyAnalysis.com for more details on archetype calculations.
Core Archetypes
| Season | Team(s) | GP | TOI | Producer | Playmaker | Shooter | Sniper | Rebound | Rush | Skating | Defend |
|---|---|---|---|---|---|---|---|---|---|---|---|
| 2015-16 | VAN | 69 | -0.72 | -1.02 | 0.12 | 0.44 | -1.00 | -0.27 | - | 0.87 | |
| 2016-17 | FLA | 29 | -0.77 | 0.39 | -1.21 | -1.18 | -1.37 | -1.95 | - | -0.41 | |
| 2017-18 | FLA | 68 | 1.16 | 1.95 | -0.41 | -0.16 | 0.80 | -0.12 | - | 2.61 | |
| 2018-19 | FLA, PIT | 78 | -0.33 | -0.48 | -0.19 | 0.06 | 0.84 | -1.06 | - | -0.64 | |
| 2019-20 | PIT | 66 | -0.04 | -0.26 | 0.06 | 0.20 | -0.45 | 0.46 | - | -0.17 | |
| 2020-21 | PIT | 43 | 0.49 | 0.83 | -0.39 | 0.32 | 0.38 | -1.20 | - | 0.78 | |
| 2021-22 | SEA | 74 | 0.55 | -0.88 | 2.09 | 1.15 | -1.43 | -0.83 | 0.05 | -1.27 | |
| 2022-23 | SEA | 79 | 2.24 | -0.47 | 4.03 | 3.62 | -1.31 | -0.60 | -0.41 | -0.82 | |
| 2023-24 | SEA | 80 | 1.10 | 0.33 | 1.01 | 0.80 | -1.10 | 0.61 | -0.18 | -0.60 | |
| 2024-25 | SEA | 82 | 0.97 | 1.32 | -0.19 | 0.23 | -2.02 | 0.59 | -0.29 | 0.44 | |
| 2025-26 | SEA | 52 | 0.80 | 0.75 | 0.16 | 0.54 | -0.37 | -1.06 | -1.03 | -0.91 |
Situational and Secondary Archetypes
| Season | Team(s) | GP | TOI | 5v5 TOI | 5v4 TOI | 4v5 TOI | Possession | Drive | Suppress | Faceoffs |
|---|---|---|---|---|---|---|---|---|---|---|
| 2015-16 | VAN | 69 | -0.68 | -0.87 | -1.92 | -0.15 | 0.28 | -0.91 | 34.7 | |
| 2016-17 | FLA | 29 | -0.77 | -1.13 | -2.00 | 1.04 | 0.71 | 0.90 | 39.0 | |
| 2017-18 | FLA | 68 | -0.36 | -1.41 | -1.03 | -0.11 | -0.60 | 0.67 | 38.5 | |
| 2018-19 | FLA, PIT | 78 | -0.14 | -1.19 | -0.06 | -0.29 | -0.44 | 0.12 | 46.2 | |
| 2019-20 | PIT | 66 | -0.01 | -0.34 | -1.18 | -0.16 | -0.66 | 0.66 | 46.4 | |
| 2020-21 | PIT | 43 | -0.51 | 0.13 | -2.12 | 0.84 | 0.85 | 0.35 | 43.4 | |
| 2021-22 | SEA | 74 | -0.08 | 0.72 | -1.64 | 0.83 | 1.05 | -0.22 | 45.5 | |
| 2022-23 | SEA | 79 | -0.03 | 0.50 | -0.38 | 0.19 | 0.50 | -0.37 | 33.3 | |
| 2023-24 | SEA | 80 | -0.29 | 0.45 | 0.44 | -0.02 | 0.46 | -0.82 | 47.9 | |
| 2024-25 | SEA | 82 | -0.30 | 0.44 | 0.86 | -0.32 | 0.09 | -0.77 | 44.7 | |
| 2025-26 | SEA | 52 | -0.02 | 0.74 | -1.81 | 1.45 | 1.62 | 0.01 | - |
5v5 Individual Stats
| Season | Team(s) | GP | TOI | G/60 | A/60 | Pts/60 | xG/60 | GAE/60 | Sh% | xSh% | Sh%AE | %SA Rush | %SA Reb. |
|---|---|---|---|---|---|---|---|---|---|---|---|---|---|
| 2015-16 | VAN | 69 | 745:34 | 0.64 | 0.48 | 1.13 | 0.56 | 0.08 | 8.89 | 7.75 | 1.14 | 3.51 | 2.63 |
| 2016-17 | FLA | 29 | 299:41 | 0.20 | 1.00 | 1.20 | 0.51 | -0.31 | 2.78 | 7.05 | -4.28 | 0.00 | 2.00 |
| 2017-18 | FLA | 68 | 769:45 | 0.55 | 1.33 | 1.87 | 0.60 | -0.05 | 6.09 | 6.64 | -0.56 | 3.73 | 6.72 |
| 2018-19 | FLA | 46 | 518:37 | 0.69 | 0.93 | 1.62 | 0.54 | 0.15 | 9.68 | 7.58 | 2.09 | 2.47 | 8.64 |
| 2018-19 | PIT | 32 | 405:08 | 0.44 | 0.89 | 1.33 | 0.63 | -0.19 | 5.26 | 7.47 | -2.21 | 1.39 | 5.56 |
| 2018-19 | FLA, PIT | 78 | 923:45 | 0.58 | 0.91 | 1.49 | 0.58 | 0.00 | 7.56 | 7.53 | 0.03 | 1.96 | 7.19 |
| 2019-20 | PIT | 66 | 807:29 | 0.82 | 0.97 | 1.78 | 0.76 | 0.06 | 8.80 | 8.20 | 0.60 | 4.85 | 4.85 |
| 2020-21 | PIT | 43 | 495:06 | 0.73 | 1.70 | 2.42 | 0.61 | 0.12 | 8.96 | 7.51 | 1.45 | 1.16 | 6.98 |
| 2021-22 | SEA | 74 | 915:42 | 1.11 | 0.72 | 1.83 | 0.80 | 0.31 | 14.53 | 10.43 | 4.10 | 2.40 | 2.40 |
| 2022-23 | SEA | 79 | 953:50 | 1.89 | 1.13 | 3.02 | 0.79 | 1.10 | 21.74 | 9.11 | 12.63 | 2.59 | 3.11 |
| 2023-24 | SEA | 80 | 946:07 | 1.01 | 1.08 | 2.09 | 0.76 | 0.26 | 12.21 | 9.11 | 3.10 | 5.15 | 4.64 |
| 2024-25 | SEA | 82 | 971:00 | 0.68 | 1.48 | 2.16 | 0.63 | 0.05 | 9.48 | 8.74 | 0.74 | 3.33 | 1.67 |
| 2025-26 | SEA | 52 | 650:58 | 0.74 | 1.20 | 1.94 | 0.65 | 0.09 | 12.70 | 11.14 | 1.55 | 0.99 | 6.93 |
5v5 On Ice Stats
| Season | Team(s) | GP | TOI | SAF/60 | GF/60 | xGF/60 | SAA/60 | GA/60 | xGA/60 | GF% | xGF% | xGF Rel | xGA Rel | xGF% Rel |
|---|---|---|---|---|---|---|---|---|---|---|---|---|---|---|
| 2015-16 | VAN | 69 | 745:34 | 38.06 | 1.93 | 1.84 | 45.07 | 2.09 | 2.69 | 48.00 | 40.57 | -0.19 | 0.23 | -4.61 |
| 2016-17 | FLA | 29 | 299:41 | 42.64 | 2.20 | 2.03 | 38.24 | 2.40 | 1.92 | 47.83 | 51.31 | 0.06 | -0.28 | 4.16 |
| 2017-18 | FLA | 68 | 769:45 | 43.49 | 2.18 | 2.13 | 43.34 | 1.48 | 2.09 | 59.57 | 50.51 | -0.38 | -0.53 | 1.49 |
| 2018-19 | FLA | 46 | 518:37 | 42.57 | 2.66 | 2.34 | 43.85 | 3.47 | 2.61 | 43.40 | 47.29 | -0.12 | 0.14 | -2.59 |
| 2018-19 | PIT | 32 | 405:08 | 42.21 | 1.93 | 2.39 | 40.58 | 1.93 | 2.17 | 50.00 | 52.49 | -0.39 | -0.40 | 0.50 |
| 2018-19 | FLA, PIT | 78 | 923:45 | 42.41 | 2.34 | 2.36 | 42.41 | 2.79 | 2.41 | 45.57 | 49.47 | -0.23 | -0.10 | -1.34 |
| 2019-20 | PIT | 66 | 807:29 | 38.79 | 2.97 | 2.17 | 37.67 | 2.38 | 2.15 | 55.56 | 50.20 | -0.34 | -0.15 | -1.89 |
| 2020-21 | PIT | 43 | 495:06 | 41.93 | 4.36 | 2.55 | 36.60 | 1.94 | 2.18 | 69.23 | 53.91 | 0.27 | -0.17 | 4.69 |
| 2021-22 | SEA | 74 | 915:42 | 42.85 | 2.36 | 2.55 | 39.90 | 3.28 | 2.45 | 41.86 | 51.04 | 0.44 | 0.06 | 4.16 |
| 2022-23 | SEA | 79 | 953:50 | 45.23 | 4.15 | 2.79 | 38.25 | 2.70 | 2.28 | 60.55 | 55.07 | 0.18 | -0.17 | 3.38 |
| 2023-24 | SEA | 80 | 946:07 | 42.74 | 2.73 | 2.44 | 43.00 | 2.54 | 2.33 | 51.81 | 51.17 | 0.13 | 0.17 | -0.54 |
| 2024-25 | SEA | 82 | 971:00 | 40.60 | 3.15 | 2.30 | 45.17 | 2.47 | 2.52 | 56.04 | 47.77 | 0.10 | 0.01 | 1.08 |
| 2025-26 | SEA | 52 | 650:58 | 43.60 | 2.58 | 2.74 | 43.87 | 2.77 | 2.54 | 48.28 | 51.90 | 0.54 | -0.07 | 6.19 |
NHL Edge Stats
| Skating | Shooting | Zone Time | |||||||||||
|---|---|---|---|---|---|---|---|---|---|---|---|---|---|
| Season | GP | Top Speed | Bursts>20/mi | Avg. Speed | Top Speed | Avg. Speed | %Long Range | %Mid Range | %High Danger | ES DZ% | ES NZ% | ES OZ% | |
| This table is for Basic and Premium subscribers only. To view please login to and/or subscribe to one of our subscription plans. | |||||||||||||
Legend
| Percentile 0-25 | Percentile 25-50 | Percentile 50-75 | Percentile 75-100 |
5v5 Lines
| Season | Teammate | Teammate | Team | TOI | GF/60 | GA/60 | GF% | xGF/60 | xGA/60 | xGF% | xGF Rel | xGA Rel | xGF% Rel |
|---|
Glossary
| Type | Statistic | Definition |
|---|---|---|
| Individual | G/60 | Goals Against per 60 minutes. |
| Individual | A/60 | Assists per 60 minutes. |
| Individual | Pts/60 | Points per 60 minutes. |
| Individual | xG/60 | Expected Goals per 60 minutes. |
| Individual | GAE/60 | Goals Above Expected (G/60 - xG/60). |
| Individual | Sh% | Shooting Percentage. |
| Individual | xSh% | Expected Shooting Percentage. |
| Individual | Sh%AE | Shooting percentage above expected (Sh% - xSh%). |
| Individual | %SA Rush | Percentage of shot attempts determined to be on the rush. |
| Individual | %SA Reb. | Percentage of shot attempts determined to be from rebounds. |
| On Ice | SAF/60 | Shot Attempts For per 60 minutes. |
| On Ice | GF/60 | Goals For per 60 minutes. |
| On Ice | xGF/60 | Expected Goals For per 60 minutes. |
| On Ice | SAA/60 | Shot Attempts Against per 60 minutes (lower is better). |
| On Ice | GA/60 | Goals Against per 60 minutes (lower is better). |
| On Ice | xGA/60 | Expected Goals Against per 60 minutes (lower is better). |
| On Ice | GF% | Goals For Percentage = Goals For / (Goals For + Goals Against) |
| On Ice | xGF% | Expected Goals For Percentage = Expected Goals For / (Expected Goals For + Expected Goals Against) |
| On Ice | xGF Rel | xGF/60 when On Ice - xGF/60 when not On Ice. |
| On Ice | xGA Rel | xGA/60 when On Ice - xGA/60 when not On Ice (lower is better). |
| On Ice | xGF% Rel | xGF% when On Ice - xGF% when not On Ice. |
News and Opinions
-
Jared McCann de retour le marché des échanges : une cible idéale pour le Canadien ? at HABSolument Fan (Tue Jul 28, 2026)
-
Le Kraken évalue le marché pour Jared McCann (qui cadrerait bien à Montréal) at Dans Les Coulisses (Tue Jul 28, 2026)
-
How Murky Is The Future For Kraken’s Jared McCann at Seattle Hockey Insider (Sat Jul 18, 2026)
-
Jared McCann should be the Ottawa Senators' top trade target at SenShot (Sat Jul 11, 2026)
-
Potential Sabres Trade Or Free Agent Acquisitions - Jared McCann at Yahoo Sports NHL (Tue Jul 7, 2026)
-
Trade tree: Re-examining the Canucks’ Erik Gudbranson for Jared McCann deal a decade later at Canucks Army (Thu Jun 11, 2026)
-
Canucks History of Selecting 24th Overall in the NHL Draft at The Hockey Writers (Fri Jun 5, 2026)
-
2 Forwards the Bruins Need to Pursue This Offseason at The Hockey Writers (Sun May 17, 2026)
-
McCann to miss Kraken's last 3 games with injury at ESPN (Mon Apr 13, 2026)
-
Seattle Kraken forward Jared McCann to miss remainder of 2025-26 season with lower-body injury at Yahoo Sports NHL (Mon Apr 13, 2026)
-
Kraken News & Rumors: Winterton, McCann, Molgaard & More at The Hockey Writers (Thu Mar 26, 2026)
-
Jared McCann stings Canucks again in Vancouver at Canucks Daily (Sun Mar 15, 2026)
-
NHL Department of Player Safety Makes Ruling On Senators Defenseman Tyler Kleven at Yahoo Sports NHL (Sun Mar 8, 2026)
-
Bloodied, Beaten: Seattle Kraken Show Little Fight In Blowout Loss To Senators at Davy Jones Locker Room (Sun Mar 8, 2026)
-
Can McCann Win His 5th Straight Kraken Scoring Title at Seattle Hockey Insider (Sun Feb 8, 2026)
-
Monday Musings: McCann-do at Sound of Hockey (Mon Feb 2, 2026)
-
Maple Leafs should try to acquire this Kraken forward who got away at Editor in Leaf (Thu Jan 29, 2026)
-
Three Takeaways – Jared McCann has four-point night, Kraken beat Capitals 5-1 at Sound of Hockey (Wed Jan 28, 2026)
-
Two (Looked Like Three Or Four) Jared McCann Goals Lead 5-1 Kraken Win Over Capitals at Davy Jones Locker Room (Wed Jan 28, 2026)
-
Three Takeaways – Sluggish Kraken fall 3-2 to Devils in overtime at Sound of Hockey (Thu Jan 15, 2026)
-
Three Takeaways – Berkly Catton scores first two NHL goals in 7-4 Kraken win over Bruins at Sound of Hockey (Wed Jan 7, 2026)
-
Penguins’ Best & Worst Moves Under GM Ron Hextall at The Hockey Writers (Mon Jan 5, 2026)
-
Fantasy Hockey Waiver Wire: Jared McCann, Connor Ingram among top pickups going into the weekend at Yahoo Sports NHL (Fri Jan 2, 2026)
-
Three Takeaways – Kraken lose 3-2 in shootout to Canucks at Sound of Hockey (Tue Dec 30, 2025)
-
Kraken Fire 39 Shots But Get ‘Goalied’ By Canucks’ Lankinen In Shootout Loss at Davy Jones Locker Room (Tue Dec 30, 2025)
-
Kraken’s Jared McCann Activated Off IR at The Hockey Writers (Sun Dec 28, 2025)
-
Kraken Gameday Preview: Back From Break to Host the Flyers at The Hockey Writers (Sun Dec 28, 2025)
-
Sabres Trade Target: Jared McCann at The Hockey Writers (Sat Dec 27, 2025)
-
Jared McCann resurfaces as a potential offensive fit for the Canadiens, but there's a catch at Habs Fanatics (Fri Dec 26, 2025)
-
Oilers Acquire Jared McCann in Suggested Deadline Blockbuster With Kraken at The Hockey Writers (Fri Dec 26, 2025)
-
Un analyste propose au Canadien de transiger pour Jared McCann at HABSolument Fan (Thu Dec 18, 2025)
-
CH : « Jared McCann cadrerait vraiment bien à Montréal » at Dans Les Coulisses (Wed Dec 17, 2025)
-
Kraken Week Ahead: Schedule & Storylines – McCann, Marchment and More at The Hockey Writers (Sun Dec 14, 2025)
-
Kraken Gameday Preview: Traveling to Utah to Take on the Mammoth at The Hockey Writers (Fri Dec 12, 2025)
-
Kraken’s Jared McCann Out 3 Weeks with a Lower-Body Injury at The Hockey Writers (Fri Dec 12, 2025)
-
3 Takeaways From the Kraken’s 3-2 OT Win Over Kings at The Hockey Writers (Thu Dec 11, 2025)
-
Three Takeaways – Kraken end six-game slide with miraculous 3-2 OT win against Kings at Sound of Hockey (Thu Dec 11, 2025)
-
Three Takeaways – McCann returns, Schwartz exits as Kraken lose 3-2 to Stars at Sound of Hockey (Thu Nov 27, 2025)
-
Expect Kraken’s Jared McCann To Return Tonight at Seattle Hockey Insider (Wed Nov 26, 2025)
-
Kraken Notebook – Daccord dialed in, seeking scoring solutions, McCann return imminent at Sound of Hockey (Wed Nov 26, 2025)
-
Kraken Notebook: McCann, Gaudreau trending up; Catton’s NHL status solidifies at Sound of Hockey (Sat Nov 15, 2025)
-
Kraken Notebook: Limiting odd-man rushes, Kakko and McCann injury updates at Sound of Hockey (Mon Oct 27, 2025)
-
Kraken put McCann on IR, welcome back Montour at ESPN (Sat Oct 25, 2025)
-
Berkly Catton projected to make NHL Debut, Jared McCann out day-to-day at Davy Jones Locker Room (Mon Oct 20, 2025)
-
Kraken Gameday Preview: Searching for a Win vs. Senators in Canada’s Capital at The Hockey Writers (Thu Oct 16, 2025)
-
Kraken’s Jared McCann Records 400th NHL Point at The Hockey Writers (Sun Oct 12, 2025)
-
McCann Scores in OT Thriller to Lift Kraken Over the Golden Knights at The Hockey Writers (Sun Oct 12, 2025)
-
More Late Seattle Magic! Jared McCann Scores In Last 4 Seconds Of OT To Beat Vegas at Davy Jones Locker Room (Sun Oct 12, 2025)
-
Three Takeaways: Kraken rebound from ugly 1st period to snag 3-1 Opening Night win over Ducks at Sound of Hockey (Fri Oct 10, 2025)
-
Seattle Kraken Bios: Jared McCann at Davy Jones Locker Room (Wed Oct 8, 2025)
-
Injury woes starting to pile up for Seattle Kraken in training camp at Sound of Hockey (Wed Sep 24, 2025)
-
Kraken Notebook: Lane Lambert pushing hard, storyline and injury updates at Sound of Hockey (Sun Sep 21, 2025)
-
Jared McCann : le Canadien a l’espace sous le plafond pour aller le chercher at Dans Les Coulisses (Sun Sep 7, 2025)
-
“Holdouts Now, Sellers Soon: Teams the Devils Can Still Target” at New Jersey Hockey Now (Thu Sep 4, 2025)
-
Kraken’s McCann Led Team Despite Surgery Need at Seattle Hockey Insider (Wed Sep 3, 2025)
-
Blockbuster Trade Proposal Brings Former Vancouver Canucks 1st-Round Pick Back to the Organization at Canucks Daily (Sun Aug 31, 2025)
-
Trade Proposal Sends Jared McCann to Montreal Canadiens in Multi-Player Deal at Habs Fanatics (Sat Aug 30, 2025)
-
NHL Rumor Roundup: Are The Devils Interested in Jared McCann? Could The Kings Trade Brandt Clarke? at The Hockey News (Tue Aug 26, 2025)
-
Stanley Cup Favorites, Jared McCann, and this Weeks Roster Moves at NHL Rumors (Tue Aug 26, 2025)
-
The benefits of acquiring Jared McCann for the Montreal Canadiens at A Winning Habit (Sun Aug 24, 2025)
-
King’s Ransom for McCann, Updates on Extensions & More NHL Rumours at The Hockey Writers (Sat Aug 23, 2025)
-
5 Worst Penguins Trades of the Sidney Crosby Era at Yahoo Sports (Sat Aug 23, 2025)
-
NHL Rumors: New Jersey Devils and Montreal Canadiens Were Interested in Jared McCann at NHL Rumors (Thu Aug 21, 2025)
-
3 top-six forwards the New Jersey Devils should still target late in the offseason at Pucks and Pitchforks (Tue Aug 19, 2025)
-
Kraken Exclusive: ‘We’re Not Trading McCann’ at Seattle Hockey Insider (Tue Aug 19, 2025)
-
Kraken Trade Rumor: Jared McCann To Montreal at Seattle Hockey Insider (Mon Aug 18, 2025)
-
Canadiens Eye 40-Goal Scorer Jared McCann in Potential Trade With Kraken at Habs Fanatics (Mon Aug 18, 2025)
-
Le Canadien serait intéressé par Jared McCann du Kraken at HABSolument Fan (Mon Aug 18, 2025)
-
Jared McCann intéresse le Canadien de Montréal (selon The Hockey News) at Dans Les Coulisses (Mon Aug 18, 2025)
-
4 Young Players the Canucks Gave Up on Too Soon at The Hockey Writers (Sun Aug 10, 2025)
-
Jared McCann Rumor Mill Working Double Shifts, Holidays & Weekends at Davy Jones Locker Room (Wed Jul 23, 2025)
-
Top 5 worst moves from the Jim Benning era at The Canuck Way (Wed Jul 23, 2025)
-
NHL Rumors: Jared McCann and Mason McTavish at NHL Rumors (Thu Jul 17, 2025)
-
NHL Rumor Roundup: The Latest On Nazem Kadri And Jared McCann at The Hockey News (Thu Jul 17, 2025)
-
3 emerging New Jersey Devils trade targets for ahead of the NHL Draft at Pucks and Pitchforks (Thu Jun 26, 2025)
Current Contract
Jared McCann signed a $25,000,000 5-year contract with the Seattle Kraken and General Manager Ron Francis on March 8, 2022 with an AAV of $5,000,000. This contract will start in 2022-23 and end after the 2026-27 season. In the first season of the contract the cap hit was equivalent to 6.06% of the salary cap.
Standard Contract (UFA) ( ) (0 ratings)
Jared McCann signed a $5,880,000 2-year contract with the Pittsburgh Penguins and General Manager Jim Rutherford on September 18, 2020 with an AAV of $2,940,000. This contract will start in 2020-21 and end after the 2021-22 season. In the first season of the contract the cap hit was equivalent to 3.61% of the salary cap.
Standard Contract (RFA) ( ) (0 ratings)
| Season | Age* | Clause | Cap Hit | AAV | Perf. Bonus | Sign. Bonus | Salary | Compensation | Minors Salary | Status | |
|---|---|---|---|---|---|---|---|---|---|---|---|
| 2020-21 | 24 | $2,940,000 | $2,940,000 | - | - | $2,500,000 | $2,500,000 | $2,500,000 | RFA-arb | ||
| 2021-22 | 25 | $2,940,000 | $2,940,000 | - | - | $3,380,000 | $3,380,000 | $3,380,000 | RFA-arb | ||
| Total | - | - | $5,880,000 | $5,880,000 | $5,880,000 |
Jared McCann signed a $2,500,000 2-year contract with the Florida Panthers and General Manager Dale Tallon on July 1, 2018 with an AAV of $1,250,000. This contract will start in 2018-19 and end after the 2019-20 season. In the first season of the contract the cap hit was equivalent to 1.57% of the salary cap.
Standard Contract (RFA) ( ) (0 ratings)
| Season | Age* | Clause | Cap Hit | AAV | Perf. Bonus | Sign. Bonus | Salary | Compensation | Minors Salary | Status | |
|---|---|---|---|---|---|---|---|---|---|---|---|
| 2018-19 | 22 | $1,250,000 | $1,250,000 | - | $125,000 | $1,125,000 | $1,250,000 | $1,250,000 | RFA | ||
| 2019-20 | 23 | $1,250,000 | $1,250,000 | - | - | $1,250,000 | $1,250,000 | $1,250,000 | RFA-arb | ||
| Total | - | $125,000 | $2,375,000 | $2,500,000 | $2,500,000 |
Jared McCann signed a $2,775,000 3-year contract with the Vancouver Canucks and General Manager Jim Benning on July 26, 2014 with an AAV of $925,000. This contract will start in 2014-15 and end after the 2017-18 season. In the first season of the contract the cap hit was equivalent to 1.34% of the salary cap.
Entry Level Contract ( ) (0 ratings)
| Season | Age* | Clause | Cap Hit | AAV | Perf. Bonus | Sign. Bonus | Salary | Compensation | Minors Salary | Status | |
|---|---|---|---|---|---|---|---|---|---|---|---|
| 2014-15 | 18 | $925,000 | $1,137,500 | - | $92,500 | - | $92,500 | - | ELC | ||
| 2015-16 | 19 | $894,167 | $1,106,667 | $212,500 | $92,500 | $832,500 | $925,000 | $70,000 | ELC | ||
| 2016-17 | 20 | $894,167 | $1,106,667 | $212,500 | $92,500 | $832,500 | $925,000 | $70,000 | ELC | ||
| 2017-18 | 21 | $894,167 | $1,106,667 | $212,500 | - | $832,500 | $832,500 | $70,000 | ELC | ||
| Total | $637,500 | $277,500 | $2,497,500 | $2,775,000 | $210,000 |
Career Statistics
| Regular Season | Playoffs | |||||||||||||||||||
|---|---|---|---|---|---|---|---|---|---|---|---|---|---|---|---|---|---|---|---|---|
| Season | League | Team | GP | G | A | Pts | +/- | PIM | Shots | Sh% | TOI/G | GP | G | A | Pts | +/- | PIM | Shots | Sh% | TOI/G |
| 2009-10 | Minor-ON | Elgin-Middl. Bm | 62 | 61 | 69 | 130 | 91 | |||||||||||||
| 2010-11 | Minor-ON | Elgin-Middl. Bm | 78 | 81 | 98 | 179 | 84 | |||||||||||||
| 2010-11 | Minor-ON | Elgin-Middl. MM | 3 | 0 | 0 | 0 | 3 | 3 | 3 | |||||||||||
| 2011-12 | Exhib. | Lon. Knights MM | 27 | 19 | 33 | 52 | 6 | |||||||||||||
| 2011-12 | Minor-ON | Lon. Knights MM | 29 | 33 | 26 | 59 | 22 | 11 | 9 | 11 | 20 | 4 | ||||||||
| 2011-12 | ON-Jr.B | London | 4 | 1 | 0 | 1 | 2 | 4 | 2 | 1 | 3 | |||||||||
| 2012-13 | OHL | Sault Ste. Marie | 64 | 21 | 23 | 44 | -6 | 35 | 1 | |||||||||||
| 2013-14 | WJ18-A | Canada | 7 | 1 | 2 | 3 | +2 | 6 | 17 | |||||||||||
| 2013-14 | OHL | Sault Ste. Marie | 64 | 27 | 35 | 62 | +9 | 51 | 9 | 2 | 5 | 7 | -1 | 4 | ||||||
| 2014-15 | OHL | Sault Ste. Marie | 56 | 34 | 47 | 81 | +30 | 27 | 14 | 6 | 10 | 16 | +2 | 12 | ||||||
| 2015-16 | NHL | Vancouver Canucks | 69 | 9 | 9 | 18 | -6 | 32 | 106 | 8.5 | 12:31 | |||||||||
| 2016-17 | AHL | Springfield Thunderbirds | 42 | 11 | 14 | 25 | +5 | 55 | ||||||||||||
| 2016-17 | NHL | Florida Panthers | 29 | 1 | 6 | 7 | -1 | 4 | 44 | 2.3 | 11:38 | |||||||||
| 2017-18 | NHL | Florida Panthers | 68 | 9 | 19 | 28 | +11 | 30 | 143 | 6.3 | 13:15 | |||||||||
| 2018-19 | NHL | Florida Panthers | 46 | 8 | 10 | 18 | -9 | 18 | 78 | 10.3 | 14:04 | |||||||||
| 2018-19 | WC | Canada | 10 | 2 | 3 | 5 | +6 | 8 | ||||||||||||
| 2018-19 | NHL | Pittsburgh Penguins | 32 | 11 | 6 | 17 | +8 | 13 | 72 | 15.3 | 15:11 | 3 | 1 | 1 | +1 | 8 | 0.0 | 16:16 | ||
| 2019-20 | NHL | Pittsburgh Penguins | 66 | 14 | 21 | 35 | +6 | 17 | 150 | 9.3 | 15:14 | 3 | 1 | 1 | -1 | 2 | 1 | 0.0 | 12:53 | |
| 2020-21 | NHL | Pittsburgh Penguins | 43 | 14 | 18 | 32 | +17 | 8 | 93 | 15.1 | 14:07 | 6 | 1 | 1 | +1 | 2 | 14 | 0.0 | 14:01 | |
| 2021-22 | NHL | Seattle Kraken | 74 | 27 | 23 | 50 | -26 | 33 | 199 | 13.6 | 16:08 | |||||||||
| 2022-23 | NHL | Seattle Kraken | 79 | 40 | 30 | 70 | +18 | 14 | 210 | 19.0 | 16:20 | 8 | 1 | 2 | 3 | -1 | 6 | 22 | 4.5 | 14:32 |
| 2023-24 | NHL | Seattle Kraken | 80 | 29 | 33 | 62 | -10 | 31 | 216 | 13.4 | 16:46 | |||||||||
| 2024-25 | NHL | Seattle Kraken | 82 | 22 | 39 | 61 | +8 | 18 | 202 | 10.9 | 17:13 | |||||||||
| 2025-26 | NHL | Seattle Kraken | 52 | 20 | 20 | 40 | -7 | 11 | 117 | 17.1 | 16:26 | |||||||||
| NHL Career | 720 | 204 | 234 | 438 | +9 | 229 | 1630 | 12.5 | 15:12 | 20 | 1 | 5 | 6 | 10 | 45 | 2.2 | 14:23 | |||