
 Jake Middleton
| Position | Left Defense | Current Team | Calgary Flames |
| Shoots | Left | Current Contract | 4 years ($4.4M CapHit) |
| Height | 6'3" | Expires | 2028-29 |
| Weight (lbs) | 219 | Expiry Age (Jun 30) | 33 |
| Age (DOB) | 30 (Jan 2, 1996) | Expiry Status | UFA |
| Drafted | 2014, Round 7, Overall 210 (LAK) |
| Date | Team | Transaction | |
|---|---|---|---|
| Jul 2, 2026 | Calgary Flames | Acquired from Minnesota Wild | |
| Jul 2, 2026 | Minnesota Wild | Traded to Calgary Flames | |
| Dec 20, 2025 | Minnesota Wild | Activated from IR | |
| Dec 11, 2025 | Minnesota Wild | Placed on IR | |
| Jan 7, 2025 | Minnesota Wild | Activated from LTIR | |
| Dec 13, 2024 | Minnesota Wild | Placed on LTIR | |
| Jul 1, 2024 | Minnesota Wild | Signed 4 years @ $4.350M AAV starting in 2025-26 | |
| Jul 6, 2022 | Minnesota Wild | Signed 3 years @ $2.450M AAV starting in 2022-23 | |
| Oct 5, 2020 | San Jose Sharks | Signed 2 years @ $725K AAV starting in 2020-21 | |
| Sep 7, 2017 | San Jose Sharks | Signed to an entry level contract. |
Player Card(s)
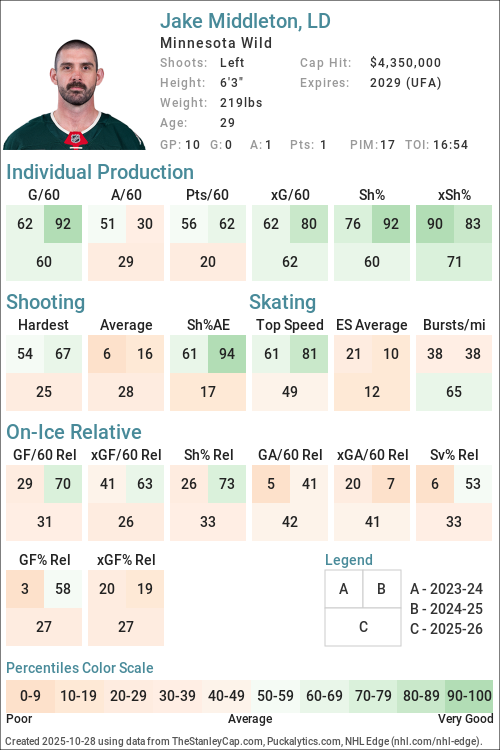
URL: https://thestanleycap.com/cdn/player_cards/20252026/jake-middleton-8478136.png
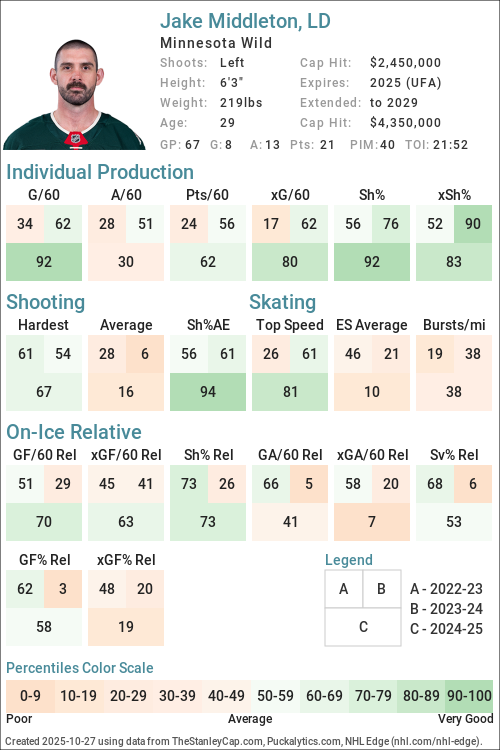
URL: https://thestanleycap.com/cdn/player_cards/20242025/jake-middleton-8478136.png
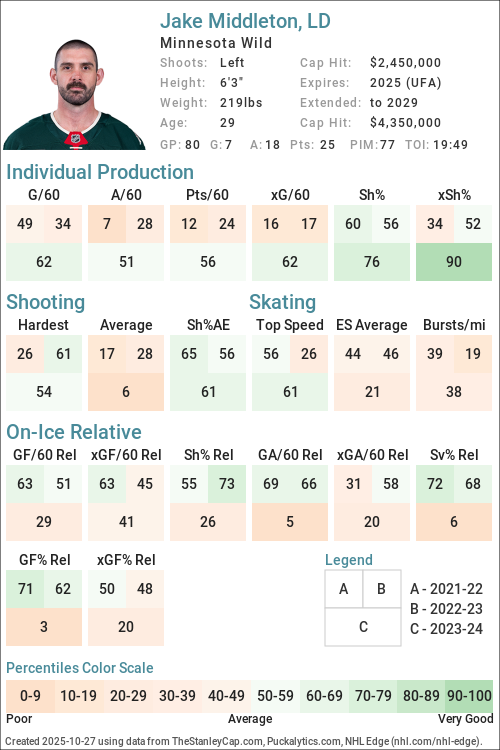
URL: https://thestanleycap.com/cdn/player_cards/20232024/jake-middleton-8478136.png
About Player Cards
Player cards present an infographic of a players performance using a series of Player Archetypes developed for Puckalytics.com and TheStanleyCap.com. The boxes in the rink image show the archetype ratings for the season specified in the card while the graphs to the right show the five-year trends for those archetypes.
Except for Faceoffs, the values shown are the players z-score (standard deviation from the mean) for the specific metric used to calculate the archetype values. When calculating z-scores forwards were compared to forwards and defensemen were compared to defensemen. Positive values indicate the player is above average and shaded in blue, while negative values indicate the player is below average and shaded in pink. The five year trend charts show a range of -4.0 to 4.0.
The value shown for Faceoffs is the faceoff winning percentage rather than their z-score with winning percentages below 50 in pink shades and above 50 in blue shades.
All archetypes are 5v5 except 5v4 TOI, 4v5 TOI, Skating (even strength) and Faceoffs (all situations). Archetypes use regular season data only.
Archetypes Summary
- Sniper - Measures the to score above the expected goal rate.
- Rebound - Measures the percent of a players shot attempts that come from rebounds (forwards only).
- 5v4 TOI - Powerplay ice time, calculated as the percentage of his teams 5v4 ice time that the player was on the ice for.
- Shooter - Measures whether a players points come from shots (goals or assists on rebounds from his shots).
- Producer - Measures a players ability to produce goals and assists, adjusted for quality of teammates.
- Playmaker - Measures whether a players points come from passes.
- Drive - Measures a players ability to drive puck possession and generate shot attempts for his team.
- Rush - Measures the percent of a players shot attempts that come from rush plays
- Possession - An indicator of a players ability to improve his teams puck possession game.
- Faceoffs - Faceoff Winning Percentage (min. 75 faceoffs taken).
- 5v5 TOI - The percentage of his teams 5v5 TOI that the player was on the ice for.
- Suppress - Measures a players ability to suppress opponent puck possession and shot attempts against.
- Skating - An indicator of a players skating ability, or speed bursts above 20mph per mile skated.
- Defend - An indicator of a players ability to suppress shot quality against.
- 4v5 TOI - Penalty Kill ice time, calculated as the percentage of his teams 4v5 ice time that the player was on the ice for.
Data Sources
- Salary data is from TheStanleyCap.com
- Skating data is from NHL Edge
- Other statistics are from Puckalytics.com and derived from data from NHL.com
Terms of Use
You are free to use include player cards in written articles, share on social media, or on other public websites under the following conditions:
- You credit TheStanleyCap.com as the source and provide a link back to TheStanleyCap.com or this player page.
- You do not mass copy/duplicate/publish dozens or hundreds of player cards. A few, or a handful for a written article is fine. Be reasonable. Fair use rules apply.
- If you are a high-traffic website you must download and host the image(s) on your site rather than overload TheStanleyCap servers with traffic.
Note: Player cards will update daily throughout the season so if you want to include snapshot then you must download the image.
If you have any questions, send an e-mail to the e-mail address at the top of this page.
Read Introducing Player Archetypes on HockeyAnalysis.com for more details on archetype calculations.
Core Archetypes
| Season | Team(s) | GP | TOI | Producer | Playmaker | Shooter | Sniper | Rebound | Rush | Skating | Defend |
|---|---|---|---|---|---|---|---|---|---|---|---|
| 2018-19 | SJS | 3 | 4.39 | 9.65 | -0.96 | - | - | -1.03 | - | -11.47 | |
| 2019-20 | SJS | 10 | 2.75 | 2.43 | -0.85 | -1.33 | - | -0.88 | - | -1.52 | |
| 2020-21 | SJS | 1 | -1.63 | -1.40 | -0.83 | -1.60 | - | -0.81 | - | -40.06 | |
| 2021-22 | MIN, SJS | 66 | -1.22 | -1.55 | -0.21 | 0.36 | - | 1.54 | -0.53 | 0.63 | |
| 2022-23 | MIN | 79 | -0.58 | -0.47 | -0.53 | -0.14 | - | 0.81 | -0.86 | 0.48 | |
| 2023-24 | MIN | 80 | 0.15 | -0.12 | 0.25 | 0.23 | - | 0.71 | -0.47 | -1.42 | |
| 2024-25 | MIN | 67 | 0.25 | -0.56 | 1.57 | 1.34 | - | -0.68 | -0.49 | 0.12 | |
| 2025-26 | MIN | 75 | -0.36 | -0.15 | -0.59 | -0.78 | - | -0.70 | -0.16 | 0.49 |
Situational and Secondary Archetypes
| Season | Team(s) | GP | TOI | 5v5 TOI | 5v4 TOI | 4v5 TOI | Possession | Drive | Suppress | Faceoffs |
|---|---|---|---|---|---|---|---|---|---|---|
| 2018-19 | SJS | 3 | -3.78 | -1.74 | -1.76 | 1.33 | 3.06 | -0.74 | - | |
| 2019-20 | SJS | 10 | -3.16 | -1.78 | -1.44 | 1.05 | 0.49 | 1.01 | - | |
| 2020-21 | SJS | 1 | -3.99 | -1.66 | -2.07 | -1.58 | 0.26 | -3.56 | - | |
| 2021-22 | MIN, SJS | 66 | 0.05 | -1.37 | -0.14 | 0.30 | 0.58 | -0.26 | - | |
| 2022-23 | MIN | 79 | 0.18 | -1.32 | 0.19 | -0.74 | -0.65 | -0.45 | - | |
| 2023-24 | MIN | 80 | 0.58 | -1.45 | 0.30 | -1.32 | -0.52 | -1.37 | - | |
| 2024-25 | MIN | 67 | 1.20 | -1.42 | 0.80 | -1.14 | -0.40 | -1.45 | - | |
| 2025-26 | MIN | 75 | -0.71 | -1.50 | 0.50 | -0.71 | -0.73 | -0.39 | - |
5v5 Individual Stats
| Season | Team(s) | GP | TOI | G/60 | A/60 | Pts/60 | xG/60 | GAE/60 | Sh% | xSh% | Sh%AE | %SA Rush | %SA Reb. |
|---|---|---|---|---|---|---|---|---|---|---|---|---|---|
| 2018-19 | SJS | 3 | 28:36 | 0.00 | 2.10 | 2.10 | 0.04 | -0.04 | - | - | - | 0.00 | 0.00 |
| 2019-20 | SJS | 10 | 98:03 | 0.00 | 1.22 | 1.22 | 0.15 | -0.15 | 0.00 | 3.05 | -3.05 | 0.00 | 8.33 |
| 2020-21 | SJS | 1 | 6:10 | 0.00 | 0.00 | 0.00 | 0.39 | -0.39 | 0.00 | 4.00 | -4.00 | 0.00 | 0.00 |
| 2021-22 | MIN | 21 | 333:40 | 0.18 | 0.54 | 0.72 | 0.17 | 0.01 | 5.26 | 5.04 | 0.22 | 0.00 | 3.70 |
| 2021-22 | SJS | 45 | 729:02 | 0.16 | 0.25 | 0.41 | 0.13 | 0.03 | 4.65 | 3.74 | 0.91 | 3.70 | 3.70 |
| 2021-22 | MIN, SJS | 66 | 1062:42 | 0.17 | 0.34 | 0.51 | 0.14 | 0.02 | 4.84 | 4.14 | 0.70 | 2.47 | 3.70 |
| 2022-23 | MIN | 79 | 1269:40 | 0.14 | 0.52 | 0.66 | 0.16 | -0.02 | 4.48 | 5.04 | -0.56 | 1.89 | 4.72 |
| 2023-24 | MIN | 80 | 1339:03 | 0.22 | 0.67 | 0.90 | 0.19 | 0.03 | 6.33 | 5.40 | 0.93 | 1.80 | 8.11 |
| 2024-25 | MIN | 67 | 1278:42 | 0.38 | 0.52 | 0.89 | 0.24 | 0.13 | 8.60 | 5.58 | 3.02 | 0.00 | 6.02 |
| 2025-26 | MIN | 75 | 1126:46 | 0.11 | 0.64 | 0.75 | 0.17 | -0.06 | 3.39 | 5.46 | -2.07 | 0.00 | 5.56 |
5v5 On Ice Stats
| Season | Team(s) | GP | TOI | SAF/60 | GF/60 | xGF/60 | SAA/60 | GA/60 | xGA/60 | GF% | xGF% | xGF Rel | xGA Rel | xGF% Rel |
|---|---|---|---|---|---|---|---|---|---|---|---|---|---|---|
| 2018-19 | SJS | 3 | 28:36 | 54.55 | 4.20 | 3.84 | 35.66 | 6.29 | 4.65 | 40.00 | 45.20 | 1.09 | 2.40 | -9.74 |
| 2019-20 | SJS | 10 | 98:03 | 47.12 | 1.84 | 3.12 | 35.49 | 3.06 | 2.52 | 37.50 | 55.30 | 0.51 | 0.11 | 3.37 |
| 2020-21 | SJS | 1 | 6:10 | 48.65 | 9.73 | 2.41 | 68.11 | 29.19 | 5.48 | 25.00 | 30.55 | -0.41 | 2.86 | -21.28 |
| 2021-22 | MIN | 21 | 333:40 | 37.40 | 3.42 | 2.24 | 42.08 | 2.52 | 2.30 | 57.58 | 49.40 | -0.44 | 0.35 | -8.52 |
| 2021-22 | SJS | 45 | 729:02 | 40.00 | 2.14 | 2.44 | 43.78 | 2.22 | 2.53 | 49.06 | 49.12 | 0.38 | -0.06 | 4.85 |
| 2021-22 | MIN, SJS | 66 | 1062:42 | 39.18 | 2.54 | 2.38 | 43.25 | 2.31 | 2.46 | 52.33 | 49.20 | 0.12 | 0.07 | 0.62 |
| 2022-23 | MIN | 79 | 1269:40 | 39.84 | 2.17 | 2.35 | 42.06 | 1.98 | 2.46 | 52.27 | 48.84 | -0.15 | -0.01 | -1.45 |
| 2023-24 | MIN | 80 | 1339:03 | 38.49 | 2.24 | 2.19 | 43.60 | 3.09 | 2.35 | 42.02 | 48.18 | -0.12 | 0.29 | -4.55 |
| 2024-25 | MIN | 67 | 1278:42 | 37.91 | 2.21 | 2.11 | 45.23 | 2.11 | 2.44 | 51.09 | 46.45 | 0.02 | 0.31 | -3.16 |
| 2025-26 | MIN | 75 | 1126:46 | 39.19 | 2.02 | 2.45 | 43.93 | 2.29 | 2.56 | 46.91 | 48.93 | -0.19 | -0.13 | -0.61 |
NHL Edge Stats
| Skating | Shooting | Zone Time | |||||||||||
|---|---|---|---|---|---|---|---|---|---|---|---|---|---|
| Season | GP | Top Speed | Bursts>20/mi | Avg. Speed | Top Speed | Avg. Speed | %Long Range | %Mid Range | %High Danger | ES DZ% | ES NZ% | ES OZ% | |
| This table is for Basic and Premium subscribers only. To view please login to and/or subscribe to one of our subscription plans. | |||||||||||||
Legend
| Percentile 0-25 | Percentile 25-50 | Percentile 50-75 | Percentile 75-100 |
5v5 Defense Pairs
| Season | Teammate | Team | TOI | GF/60 | GA/60 | GF% | xGF/60 | xGA/60 | xGF% | xGF Rel | xGA Rel | xGF% Rel |
|---|
Glossary
| Type | Statistic | Definition |
|---|---|---|
| Individual | G/60 | Goals Against per 60 minutes. |
| Individual | A/60 | Assists per 60 minutes. |
| Individual | Pts/60 | Points per 60 minutes. |
| Individual | xG/60 | Expected Goals per 60 minutes. |
| Individual | GAE/60 | Goals Above Expected (G/60 - xG/60). |
| Individual | Sh% | Shooting Percentage. |
| Individual | xSh% | Expected Shooting Percentage. |
| Individual | Sh%AE | Shooting percentage above expected (Sh% - xSh%). |
| Individual | %SA Rush | Percentage of shot attempts determined to be on the rush. |
| Individual | %SA Reb. | Percentage of shot attempts determined to be from rebounds. |
| On Ice | SAF/60 | Shot Attempts For per 60 minutes. |
| On Ice | GF/60 | Goals For per 60 minutes. |
| On Ice | xGF/60 | Expected Goals For per 60 minutes. |
| On Ice | SAA/60 | Shot Attempts Against per 60 minutes (lower is better). |
| On Ice | GA/60 | Goals Against per 60 minutes (lower is better). |
| On Ice | xGA/60 | Expected Goals Against per 60 minutes (lower is better). |
| On Ice | GF% | Goals For Percentage = Goals For / (Goals For + Goals Against) |
| On Ice | xGF% | Expected Goals For Percentage = Expected Goals For / (Expected Goals For + Expected Goals Against) |
| On Ice | xGF Rel | xGF/60 when On Ice - xGF/60 when not On Ice. |
| On Ice | xGA Rel | xGA/60 when On Ice - xGA/60 when not On Ice (lower is better). |
| On Ice | xGF% Rel | xGF% when On Ice - xGF% when not On Ice. |
News and Opinions
-
Recapping the Minnesota Wild’s Early Free Agency Moves at The Hockey Writers (Fri Jul 3, 2026)
-
How Does the Acquisition of Jake Middleton Change the Calgary Flames Blue Line? at Flame for Thought (Fri Jul 3, 2026)
-
6 thoughts on the Calgary Flames’ Blake Coleman trade at Flames Nation (Thu Jul 2, 2026)
-
NHL Trade: The Minnesota Wild Get Blake Coleman and Olli Maatta from the Calgary Flames at NHL Rumors (Thu Jul 2, 2026)
-
Wild Acquire Blake Coleman, Olli Maatta From Calgary at Yahoo Sports NHL (Thu Jul 2, 2026)
-
Flames Trade Blake Coleman and Olli Määttä to Wild for Jake Middleton at The Hockey Writers (Thu Jul 2, 2026)
-
Flames trade Coleman and Maatta to Wild for Jake Middleton and draft picks at Flames Nation (Thu Jul 2, 2026)
-
Rugged defenseman Jake Middleton traded in a deal involving three players at Habs Fanatics (Thu Jul 2, 2026)
-
Calgary Flames Officially Trade Veteran Blake Coleman at Flame for Thought (Thu Jul 2, 2026)
-
Wild 2025-26 Report Cards: Jake Middleton at The Hockey Writers (Thu Jun 18, 2026)
-
Jake Middleton Has Gone From Mr. Irrelevant To A Top-4 Defender at Hockey Wilderness (Tue May 19, 2026)
-
Jake Middleton can't come back next season after terrible playoff performance at Gone Puck Wild (Fri May 15, 2026)
-
Jake Middleton Has To Recover From A Slow Start at Hockey Wilderness (Thu Oct 23, 2025)
-
Wild 2024-25 Report Cards: Jake Middleton & Jared Spurgeon at The Hockey Writers (Mon Aug 18, 2025)
-
How Does Jake Middleton Fit In the Wild's Evolving D-Core? at Hockey Wilderness (Thu Jul 31, 2025)
-
The State of Hockey... In the State of Hockey (Week Ten/Eleven Edition) at Gone Puck Wild (Fri Dec 27, 2024)
-
The State of Hockey... In the State of Hockey (Week Four Edition) at Gone Puck Wild (Wed Nov 6, 2024)
Current Contract
Jake Middleton signed a $17,400,000 4-year contract with the Minnesota Wild and General Manager Bill Guerin on July 1, 2024 with an AAV of $4,350,000. This contract will start in 2025-26 and end after the 2028-29 season. In the first season of the contract the cap hit was equivalent to 4.55% of the salary cap.
Standard Contract (UFA) ( ) (0 ratings)
Jake Middleton signed a $7,350,000 3-year contract with the Minnesota Wild and General Manager Bill Guerin on July 6, 2022 with an AAV of $2,450,000. This contract will start in 2022-23 and end after the 2024-25 season. In the first season of the contract the cap hit was equivalent to 2.97% of the salary cap.
Standard Contract (RFA) ( ) (0 ratings)
| Season | Age* | Clause | Cap Hit | AAV | Perf. Bonus | Sign. Bonus | Salary | Compensation | Minors Salary | Status | |
|---|---|---|---|---|---|---|---|---|---|---|---|
| 2022-23 | 26 | $2,450,000 | $2,450,000 | - | - | $2,800,000 | $2,800,000 | $2,800,000 | RFA-arb | ||
| 2023-24 | 27 | $2,450,000 | $2,450,000 | - | - | $2,500,000 | $2,500,000 | $2,500,000 | UFA | ||
| 2024-25 | 28 | $2,450,000 | $2,450,000 | - | - | $2,050,000 | $2,050,000 | $2,050,000 | UFA | ||
| Total | - | - | $7,350,000 | $7,350,000 | $7,350,000 |
Jake Middleton signed a $1,450,000 2-year contract with the San Jose Sharks and General Manager Doug Wilson on October 5, 2020 with an AAV of $725,000. This contract will start in 2020-21 and end after the 2021-22 season. In the first season of the contract the cap hit was equivalent to 0.89% of the salary cap.
Standard Contract (RFA) ( ) (0 ratings)
| Season | Age* | Clause | Cap Hit | AAV | Perf. Bonus | Sign. Bonus | Salary | Compensation | Minors Salary | Status | |
|---|---|---|---|---|---|---|---|---|---|---|---|
| 2020-21 | 24 | $725,000 | $725,000 | - | - | $700,000 | $700,000 | $225,000 | RFA-arb | ||
| 2021-22 | 25 | $725,000 | $725,000 | - | - | $750,000 | $750,000 | $225,000 | RFA-arb | ||
| Total | - | - | $1,450,000 | $1,450,000 | $450,000 |
Jake Middleton signed a $2,205,000 3-year contract with the San Jose Sharks and General Manager Doug Wilson on September 7, 2017 with an AAV of $735,000. This contract will start in 2017-18 and end after the 2019-20 season. In the first season of the contract the cap hit was equivalent to 0.98% of the salary cap.
Entry Level Contract ( ) (0 ratings)
| Season | Age* | Clause | Cap Hit | AAV | Perf. Bonus | Sign. Bonus | Salary | Compensation | Minors Salary | Status | |
|---|---|---|---|---|---|---|---|---|---|---|---|
| 2017-18 | 21 | $735,000 | $735,000 | - | $65,000 | $650,000 | $715,000 | $70,000 | ELC | ||
| 2018-19 | 22 | $735,000 | $735,000 | - | $70,000 | $650,000 | $720,000 | $70,000 | ELC | ||
| 2019-20 | 23 | $735,000 | $735,000 | - | $70,000 | $700,000 | $770,000 | $70,000 | ELC | ||
| Total | - | $205,000 | $2,000,000 | $2,205,000 | $210,000 |
Career Statistics
| Regular Season | Playoffs | |||||||||||||||||||
|---|---|---|---|---|---|---|---|---|---|---|---|---|---|---|---|---|---|---|---|---|
| Season | League | Team | GP | G | A | Pts | +/- | PIM | Shots | Sh% | TOI/G | GP | G | A | Pts | +/- | PIM | Shots | Sh% | TOI/G |
| 2010-11 | Minor-ON | Huron-Perth MM | 4 | 0 | 0 | 0 | 1 | |||||||||||||
| 2011-12 | ON-Jr.B | Stratford | 4 | 0 | 3 | 3 | ||||||||||||||
| 2011-12 | Minor-ON | Huron-Perth Mid. | 2 | 1 | 0 | 1 | 4 | |||||||||||||
| 2011-12 | Minor-ON | Huron-Perth MM | 25 | 7 | 16 | 23 | 26 | 8 | 1 | 7 | 8 | 16 | ||||||||
| 2012-13 | OHL | Ottawa | 15 | 1 | 3 | 4 | -16 | 18 | ||||||||||||
| 2012-13 | OHL | Owen Sound | 14 | 0 | 1 | 1 | +3 | 7 | ||||||||||||
| 2013-14 | OHL | Ottawa | 65 | 2 | 21 | 23 | -21 | 64 | ||||||||||||
| 2014-15 | OHL | Ottawa | 64 | 4 | 23 | 27 | +11 | 62 | 6 | 1 | 1 | 2 | -5 | 4 | ||||||
| 2015-16 | OHL | Ottawa | 68 | 7 | 24 | 31 | +11 | 68 | 130 | 540.0 | 5 | 2 | 2 | -3 | 2 | 8 | 0.0 | |||
| 2015-16 | ECHL | Manchester | 2 | 0 | 1 | 1 | +1 | 5 | -2 | |||||||||||
| 2016-17 | AHL | San Jose Barracuda | 50 | 1 | 8 | 9 | +11 | 56 | 13 | 4 | 4 | +2 | 10 | |||||||
| 2017-18 | AHL | San Jose Barracuda | 67 | 6 | 22 | 28 | -1 | 80 | 4 | 1 | 1 | -4 | ||||||||
| 2018-19 | NHL | San Jose Sharks | 3 | 0 | 1 | 1 | -1 | 2 | 0.0 | 9:56 | ||||||||||
| 2018-19 | AHL | San Jose Barracuda | 57 | 5 | 14 | 19 | +16 | 67 | 4 | -5 | ||||||||||
| 2019-20 | AHL | San Jose Barracuda | 32 | 1 | 5 | 6 | -13 | 52 | ||||||||||||
| 2019-20 | NHL | San Jose Sharks | 10 | 0 | 2 | 2 | -2 | 9 | 9 | 0.0 | 10:46 | |||||||||
| 2020-21 | NHL | San Jose Sharks | 1 | 0 | 0 | 0 | -2 | 2 | 1 | 0.0 | 8:44 | |||||||||
| 2020-21 | AHL | San Jose Barracuda | 22 | 3 | 4 | 7 | +4 | 18 | 4 | 2 | 2 | +1 | ||||||||
| 2021-22 | NHL | San Jose Sharks | 45 | 3 | 6 | 9 | +3 | 69 | 51 | 5.9 | 19:03 | |||||||||
| 2021-22 | NHL | Minnesota Wild | 21 | 1 | 4 | 5 | +7 | 13 | 22 | 4.5 | 17:55 | 6 | 1 | 1 | +6 | 2 | 9 | 0.0 | 16:54 | |
| 2022-23 | NHL | Minnesota Wild | 79 | 3 | 12 | 15 | +15 | 72 | 79 | 3.8 | 19:02 | 6 | 2 | 2 | -2 | 8 | 7 | 0.0 | 20:31 | |
| 2023-24 | NHL | Minnesota Wild | 80 | 7 | 18 | 25 | -15 | 77 | 85 | 8.2 | 19:49 | |||||||||
| 2024-25 | NHL | Minnesota Wild | 67 | 8 | 13 | 21 | +11 | 40 | 97 | 8.2 | 21:52 | 6 | 2 | 2 | +3 | 2 | 7 | 0.0 | 21:59 | |
| 2025-26 | NHL | Minnesota Wild | 75 | 2 | 14 | 16 | +2 | 76 | 62 | 3.2 | 17:30 | 11 | 1 | 1 | -2 | 2 | 5 | 0.0 | 16:31 | |
| NHL Career | 381 | 24 | 70 | 94 | +18 | 360 | 406 | 5.9 | 19:01 | 29 | 6 | 6 | +5 | 14 | 28 | 0.0 | 18:33 | |||