
Jack Johnson
| Position | Left Defense | Current Team | |
| Shoots | Left | Current Contract | |
| Height | 6'2" | Expires | |
| Weight (lbs) | 225 | Expiry Age (Jun 30) | |
| Age (DOB) | 39 (Jan 13, 1987) | Expiry Status | |
| Drafted | 2005, Round 1, Overall 3 (CAR) |
| Date | Team | Transaction | |
|---|---|---|---|
| Jul 2, 2024 | Columbus Blue Jackets | Signed 1 year @ $775K AAV starting in 2024-25 | |
| Jul 2, 2023 | Colorado Avalanche | Signed 1 year @ $775K AAV starting in 2023-24 | |
| Aug 17, 2022 | Chicago Blackhawks | Signed 1 year @ $950K AAV starting in 2022-23 | |
| Oct 10, 2021 | Colorado Avalanche | Signed 1 year @ $750K AAV starting in 2021-22 | |
| Oct 9, 2020 | New York Rangers | Signed 1 year @ $1.150M AAV starting in 2020-21 | |
| Oct 5, 2020 | Pittsburgh Penguins | Contract bought out | |
| Jul 1, 2018 | Pittsburgh Penguins | Signed 5 years @ $3.250M AAV starting in 2018-19 | |
| Jan 9, 2011 | Los Angeles Kings | Signed 7 years @ $4.357M AAV starting in 2011-12 | |
| Jul 17, 2009 | Los Angeles Kings | Signed 2 years @ $1.425M AAV starting in 2009-10 | |
| Mar 27, 2007 | Los Angeles Kings | Signed to an entry level contract. |
Player Card(s)
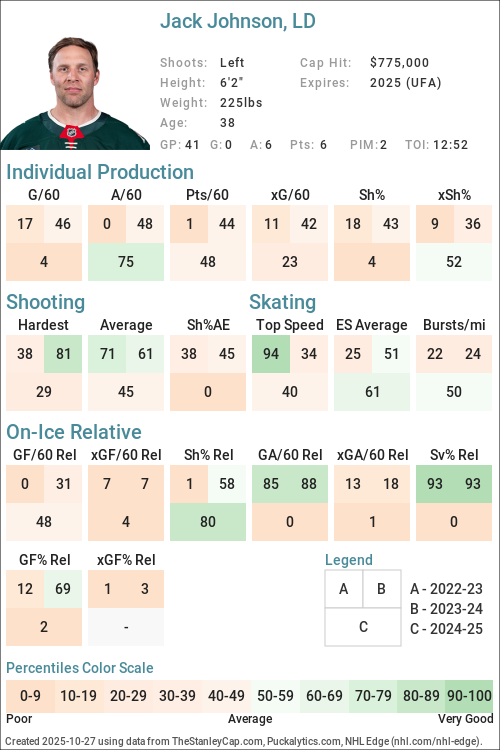
URL: https://thestanleycap.com/cdn/player_cards/20242025/jack-johnson-8471677.png
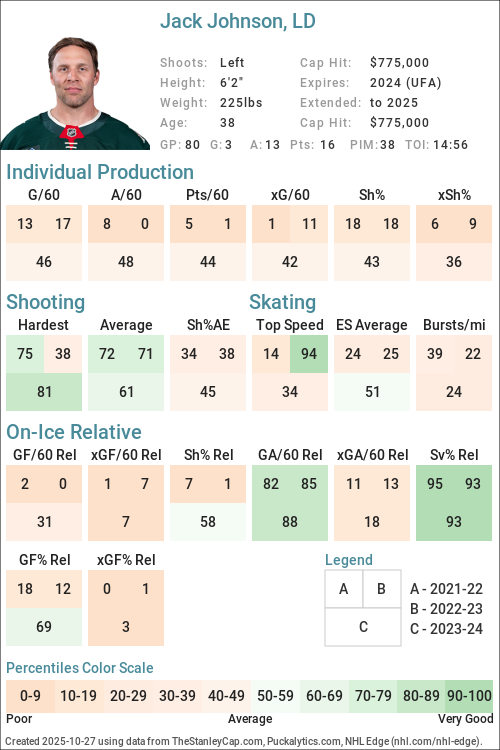
URL: https://thestanleycap.com/cdn/player_cards/20232024/jack-johnson-8471677.png
About Player Cards
Player cards present an infographic of a players performance using a series of Player Archetypes developed for Puckalytics.com and TheStanleyCap.com. The boxes in the rink image show the archetype ratings for the season specified in the card while the graphs to the right show the five-year trends for those archetypes.
Except for Faceoffs, the values shown are the players z-score (standard deviation from the mean) for the specific metric used to calculate the archetype values. When calculating z-scores forwards were compared to forwards and defensemen were compared to defensemen. Positive values indicate the player is above average and shaded in blue, while negative values indicate the player is below average and shaded in pink. The five year trend charts show a range of -4.0 to 4.0.
The value shown for Faceoffs is the faceoff winning percentage rather than their z-score with winning percentages below 50 in pink shades and above 50 in blue shades.
All archetypes are 5v5 except 5v4 TOI, 4v5 TOI, Skating (even strength) and Faceoffs (all situations). Archetypes use regular season data only.
Archetypes Summary
- Sniper - Measures the to score above the expected goal rate.
- Rebound - Measures the percent of a players shot attempts that come from rebounds (forwards only).
- 5v4 TOI - Powerplay ice time, calculated as the percentage of his teams 5v4 ice time that the player was on the ice for.
- Shooter - Measures whether a players points come from shots (goals or assists on rebounds from his shots).
- Producer - Measures a players ability to produce goals and assists, adjusted for quality of teammates.
- Playmaker - Measures whether a players points come from passes.
- Drive - Measures a players ability to drive puck possession and generate shot attempts for his team.
- Rush - Measures the percent of a players shot attempts that come from rush plays
- Possession - An indicator of a players ability to improve his teams puck possession game.
- Faceoffs - Faceoff Winning Percentage (min. 75 faceoffs taken).
- 5v5 TOI - The percentage of his teams 5v5 TOI that the player was on the ice for.
- Suppress - Measures a players ability to suppress opponent puck possession and shot attempts against.
- Skating - An indicator of a players skating ability, or speed bursts above 20mph per mile skated.
- Defend - An indicator of a players ability to suppress shot quality against.
- 4v5 TOI - Penalty Kill ice time, calculated as the percentage of his teams 4v5 ice time that the player was on the ice for.
Data Sources
- Salary data is from TheStanleyCap.com
- Skating data is from NHL Edge
- Other statistics are from Puckalytics.com and derived from data from NHL.com
Terms of Use
You are free to use include player cards in written articles, share on social media, or on other public websites under the following conditions:
- You credit TheStanleyCap.com as the source and provide a link back to TheStanleyCap.com or this player page.
- You do not mass copy/duplicate/publish dozens or hundreds of player cards. A few, or a handful for a written article is fine. Be reasonable. Fair use rules apply.
- If you are a high-traffic website you must download and host the image(s) on your site rather than overload TheStanleyCap servers with traffic.
Note: Player cards will update daily throughout the season so if you want to include snapshot then you must download the image.
If you have any questions, send an e-mail to the e-mail address at the top of this page.
Read Introducing Player Archetypes on HockeyAnalysis.com for more details on archetype calculations.
Core Archetypes
| Season | Team(s) | GP | TOI | Producer | Playmaker | Shooter | Sniper | Rebound | Rush | Skating | Defend |
|---|---|---|---|---|---|---|---|---|---|---|---|
| 2015-16 | CBJ | 60 | -1.07 | -1.32 | -0.07 | 0.50 | - | 1.13 | - | 0.66 | |
| 2016-17 | CBJ | 82 | -0.32 | -0.07 | -0.46 | 0.22 | - | -0.27 | - | 0.56 | |
| 2017-18 | CBJ | 77 | -1.07 | -0.97 | -0.59 | -0.22 | - | -0.25 | - | -0.94 | |
| 2018-19 | PIT | 82 | -1.50 | -1.40 | -0.96 | -1.36 | - | -0.17 | - | -0.98 | |
| 2019-20 | PIT | 67 | -1.00 | -0.75 | -0.77 | -0.59 | - | -0.88 | - | 0.43 | |
| 2020-21 | NYR | 13 | -0.73 | -1.40 | 4.14 | 2.32 | - | -0.81 | - | 0.34 | |
| 2021-22 | COL | 74 | -1.34 | -1.14 | -0.94 | -0.47 | - | 1.71 | -0.53 | 1.44 | |
| 2022-23 | CHI, COL | 83 | -1.43 | -1.47 | -0.71 | -0.37 | - | -0.06 | -0.78 | 1.44 | |
| 2023-24 | COL | 80 | -0.50 | -0.33 | -0.56 | -0.12 | - | 1.75 | -0.77 | 1.52 | |
| 2024-25 | CBJ | 41 | -0.27 | 0.55 | -0.94 | -1.83 | - | -0.68 | -0.19 | -2.73 |
Situational and Secondary Archetypes
| Season | Team(s) | GP | TOI | 5v5 TOI | 5v4 TOI | 4v5 TOI | Possession | Drive | Suppress | Faceoffs |
|---|---|---|---|---|---|---|---|---|---|---|
| 2015-16 | CBJ | 60 | 0.92 | 0.73 | 0.88 | -0.99 | -0.28 | -1.19 | - | |
| 2016-17 | CBJ | 82 | 0.96 | -1.41 | 0.80 | -0.05 | 0.50 | -0.59 | - | |
| 2017-18 | CBJ | 77 | 0.03 | -1.38 | 0.68 | -1.87 | -1.90 | -0.98 | - | |
| 2018-19 | PIT | 82 | -0.23 | -1.39 | 0.62 | -2.11 | -1.51 | -1.69 | - | |
| 2019-20 | PIT | 67 | 0.30 | -1.71 | 0.67 | -2.47 | -1.58 | -1.93 | - | |
| 2020-21 | NYR | 13 | -0.51 | -1.62 | -0.29 | -1.84 | -1.19 | -1.26 | - | |
| 2021-22 | COL | 74 | -0.92 | -1.51 | 0.32 | -2.50 | -1.96 | -1.96 | - | |
| 2022-23 | CHI, COL | 83 | 0.12 | -1.37 | 0.46 | -1.46 | -1.08 | -1.08 | - | |
| 2023-24 | COL | 80 | -1.19 | -1.46 | -1.07 | -1.76 | -1.10 | -1.50 | - | |
| 2024-25 | CBJ | 41 | -3.18 | -1.49 | 0.40 | -2.02 | -1.46 | -1.65 | - |
5v5 Individual Stats
| Season | Team(s) | GP | TOI | G/60 | A/60 | Pts/60 | xG/60 | GAE/60 | Sh% | xSh% | Sh%AE | %SA Rush | %SA Reb. |
|---|---|---|---|---|---|---|---|---|---|---|---|---|---|
| 2015-16 | CBJ | 60 | 1056:01 | 0.17 | 0.17 | 0.34 | 0.13 | 0.04 | 4.69 | 3.63 | 1.05 | 2.08 | 2.08 |
| 2016-17 | CBJ | 82 | 1458:55 | 0.16 | 0.58 | 0.74 | 0.15 | 0.02 | 4.17 | 3.75 | 0.41 | 0.79 | 2.36 |
| 2017-18 | CBJ | 77 | 1264:23 | 0.14 | 0.33 | 0.47 | 0.15 | -0.01 | 3.95 | 4.22 | -0.27 | 0.92 | 0.92 |
| 2018-19 | PIT | 82 | 1290:31 | 0.00 | 0.28 | 0.28 | 0.10 | -0.10 | 0.00 | 3.18 | -3.18 | 0.95 | 2.86 |
| 2019-20 | PIT | 67 | 1121:30 | 0.05 | 0.43 | 0.48 | 0.10 | -0.04 | 1.69 | 3.07 | -1.38 | 0.00 | 0.00 |
| 2020-21 | NYR | 13 | 184:39 | 0.32 | 0.00 | 0.32 | 0.11 | 0.21 | 8.33 | 2.87 | 5.46 | 0.00 | 0.00 |
| 2021-22 | COL | 74 | 1040:44 | 0.06 | 0.35 | 0.40 | 0.10 | -0.04 | 1.92 | 3.31 | -1.38 | 2.63 | 2.63 |
| 2022-23 | COL | 25 | 369:34 | 0.32 | 0.00 | 0.32 | 0.13 | 0.20 | 7.14 | 2.82 | 4.33 | 0.00 | 0.00 |
| 2022-23 | CHI | 58 | 984:25 | 0.00 | 0.18 | 0.18 | 0.13 | -0.13 | 0.00 | 3.81 | -3.81 | 1.28 | 2.56 |
| 2022-23 | CHI, COL | 83 | 1353:59 | 0.09 | 0.13 | 0.22 | 0.13 | -0.04 | 2.35 | 3.48 | -1.13 | 0.92 | 1.83 |
| 2023-24 | COL | 80 | 1092:35 | 0.16 | 0.66 | 0.82 | 0.16 | 0.00 | 4.05 | 3.99 | 0.07 | 2.83 | 1.89 |
| 2024-25 | CBJ | 41 | 449:41 | 0.00 | 0.80 | 0.80 | 0.13 | -0.13 | 0.00 | 4.26 | -4.26 | 0.00 | 0.00 |
5v5 On Ice Stats
| Season | Team(s) | GP | TOI | SAF/60 | GF/60 | xGF/60 | SAA/60 | GA/60 | xGA/60 | GF% | xGF% | xGF Rel | xGA Rel | xGF% Rel |
|---|---|---|---|---|---|---|---|---|---|---|---|---|---|---|
| 2015-16 | CBJ | 60 | 1056:01 | 38.35 | 1.76 | 2.32 | 43.75 | 2.27 | 2.32 | 43.66 | 49.98 | -0.13 | 0.04 | -1.79 |
| 2016-17 | CBJ | 82 | 1458:55 | 42.73 | 2.59 | 2.56 | 42.20 | 1.97 | 2.37 | 56.76 | 51.90 | 0.22 | -0.01 | 2.42 |
| 2017-18 | CBJ | 77 | 1264:23 | 41.33 | 2.18 | 2.36 | 43.23 | 2.61 | 2.66 | 45.54 | 46.98 | -0.35 | 0.30 | -6.38 |
| 2018-19 | PIT | 82 | 1290:31 | 39.89 | 2.14 | 2.39 | 47.79 | 2.74 | 2.80 | 43.81 | 46.03 | -0.46 | 0.40 | -8.19 |
| 2019-20 | PIT | 67 | 1121:30 | 37.50 | 2.14 | 2.19 | 43.39 | 2.62 | 2.54 | 44.94 | 46.28 | -0.34 | 0.44 | -8.32 |
| 2020-21 | NYR | 13 | 184:39 | 35.09 | 0.65 | 2.16 | 45.17 | 2.27 | 2.28 | 22.22 | 48.62 | -0.35 | -0.18 | -1.85 |
| 2021-22 | COL | 74 | 1040:44 | 39.20 | 2.02 | 2.26 | 45.66 | 2.08 | 2.60 | 49.30 | 46.46 | -0.43 | 0.35 | -8.02 |
| 2022-23 | COL | 25 | 369:34 | 39.29 | 2.44 | 2.69 | 40.91 | 1.46 | 2.29 | 62.50 | 53.96 | -0.28 | 0.03 | -2.78 |
| 2022-23 | CHI | 58 | 984:25 | 32.79 | 1.34 | 1.80 | 48.03 | 2.99 | 3.28 | 30.99 | 35.41 | -0.43 | 0.39 | -8.07 |
| 2022-23 | CHI, COL | 83 | 1353:59 | 34.56 | 1.64 | 2.04 | 46.09 | 2.57 | 3.01 | 38.95 | 40.41 | -0.41 | 0.31 | -7.16 |
| 2023-24 | COL | 80 | 1092:35 | 41.96 | 2.86 | 2.31 | 44.76 | 2.14 | 2.55 | 57.14 | 47.52 | -0.46 | 0.29 | -7.53 |
| 2024-25 | CBJ | 41 | 449:41 | 36.43 | 2.40 | 1.96 | 46.83 | 4.27 | 2.84 | 36.00 | 40.76 | -0.55 | 0.35 | -9.41 |
NHL Edge Stats
| Skating | Shooting | Zone Time | |||||||||||
|---|---|---|---|---|---|---|---|---|---|---|---|---|---|
| Season | GP | Top Speed | Bursts>20/mi | Avg. Speed | Top Speed | Avg. Speed | %Long Range | %Mid Range | %High Danger | ES DZ% | ES NZ% | ES OZ% | |
| This table is for Basic and Premium subscribers only. To view please login to and/or subscribe to one of our subscription plans. | |||||||||||||
Legend
| Percentile 0-25 | Percentile 25-50 | Percentile 50-75 | Percentile 75-100 |
5v5 Defense Pairs
| Season | Teammate | Team | TOI | GF/60 | GA/60 | GF% | xGF/60 | xGA/60 | xGF% | xGF Rel | xGA Rel | xGF% Rel |
|---|
Glossary
| Type | Statistic | Definition |
|---|---|---|
| Individual | G/60 | Goals Against per 60 minutes. |
| Individual | A/60 | Assists per 60 minutes. |
| Individual | Pts/60 | Points per 60 minutes. |
| Individual | xG/60 | Expected Goals per 60 minutes. |
| Individual | GAE/60 | Goals Above Expected (G/60 - xG/60). |
| Individual | Sh% | Shooting Percentage. |
| Individual | xSh% | Expected Shooting Percentage. |
| Individual | Sh%AE | Shooting percentage above expected (Sh% - xSh%). |
| Individual | %SA Rush | Percentage of shot attempts determined to be on the rush. |
| Individual | %SA Reb. | Percentage of shot attempts determined to be from rebounds. |
| On Ice | SAF/60 | Shot Attempts For per 60 minutes. |
| On Ice | GF/60 | Goals For per 60 minutes. |
| On Ice | xGF/60 | Expected Goals For per 60 minutes. |
| On Ice | SAA/60 | Shot Attempts Against per 60 minutes (lower is better). |
| On Ice | GA/60 | Goals Against per 60 minutes (lower is better). |
| On Ice | xGA/60 | Expected Goals Against per 60 minutes (lower is better). |
| On Ice | GF% | Goals For Percentage = Goals For / (Goals For + Goals Against) |
| On Ice | xGF% | Expected Goals For Percentage = Expected Goals For / (Expected Goals For + Expected Goals Against) |
| On Ice | xGF Rel | xGF/60 when On Ice - xGF/60 when not On Ice. |
| On Ice | xGA Rel | xGA/60 when On Ice - xGA/60 when not On Ice (lower is better). |
| On Ice | xGF% Rel | xGF% when On Ice - xGF% when not On Ice. |
News and Opinions
-
Former LA Kings defenseman announces retirement from NHL at Rink Royalty (Mon Jan 12, 2026)
-
Deen’s Daily: Landeskog Update Coming Today?; Jack Johnson’s New Role; Zamula Drama at Colorado Hockey Now (Tue Jan 6, 2026)
-
Jack Johnson retires, hired by Canucks as a professional scout at Pens Burgh (Tue Jan 6, 2026)
-
Canucks’ Newest Hire Has A Surprising Connection To Vancouver’s Management Team at Yahoo Sports NHL (Mon Jan 5, 2026)
-
Canucks hire former NHL defenceman Jack Johnson as pro scout at Canucks Army (Mon Jan 5, 2026)
-
7 Days Left Until Opening Night At NWA: The History Of Jersey #7 at Yahoo Sports NHL (Mon Oct 6, 2025)
-
Minnesota Wild Release Defenseman Jack Johnson From His Professional Tryout at Yahoo Sports NHL (Sat Oct 4, 2025)
-
Jack Johnson Released From PTO With Minnesota at Colorado Hockey Now (Fri Oct 3, 2025)
-
Ex-LA Kings defenseman signs with the Wild on a PTO at Rink Royalty (Fri Aug 15, 2025)
-
Why The Minnesota Wild Signed Jack Johnson To A PTO at Yahoo Sports NHL (Tue Aug 12, 2025)
-
Even On A Tryout, The Jack Johnson Signing Misses the Mark at Hockey Wilderness (Tue Aug 12, 2025)
-
Deen’s Daily: Another PTO For Jack Johnson; Datsyuk Assesses the Yzerplan: Rust on Team USA? at Colorado Hockey Now (Tue Aug 12, 2025)
-
Former Avalanche Defenseman Jack Johnson Lands PTO with Minnesota at Colorado Hockey Now (Tue Aug 12, 2025)
-
Wild Sign Jack Johnson to PTO at Hockey Wilderness (Tue Aug 12, 2025)
-
A Trade a Day: Trading a Stanley Cup champion and a top prospect brings a future assistant coach to Raleigh at Cardiac Cane (Sat Aug 9, 2025)
-
Jack Johnson's season in review, he filled a niche on the back end for the Blue Jackets at Union Blue (Mon May 5, 2025)
Current Contract
Player does not currently have a contract.Jack Johnson signed a $775,000 1-year contract with the Columbus Blue Jackets and General Manager Don Waddell on July 2, 2024 with an AAV of $775,000. This contract will start in 2024-25 and end after the 2024-25 season. In the first season of the contract the cap hit was equivalent to 0.88% of the salary cap.
35+ Contract ( ) (0 ratings)
| Season | Age* | Clause | Cap Hit | AAV | Perf. Bonus | Sign. Bonus | Salary | Compensation | Minors Salary | Status | |
|---|---|---|---|---|---|---|---|---|---|---|---|
| 2024-25 | 37 | $775,000 | $775,000 | - | - | $775,000 | $775,000 | $775,000 | UFA | ||
| Total | - | - | $775,000 | $775,000 | $775,000 |
Jack Johnson signed a $775,000 1-year contract with the Colorado Avalanche and General Manager Chris MacFarland on July 2, 2023 with an AAV of $775,000. This contract will start in 2023-24 and end after the 2023-24 season. In the first season of the contract the cap hit was equivalent to 0.93% of the salary cap.
35+ Contract ( ) (0 ratings)
| Season | Age* | Clause | Cap Hit | AAV | Perf. Bonus | Sign. Bonus | Salary | Compensation | Minors Salary | Status | |
|---|---|---|---|---|---|---|---|---|---|---|---|
| 2023-24 | 36 | $775,000 | $775,000 | - | - | $775,000 | $775,000 | $775,000 | UFA | ||
| Total | - | - | $775,000 | $775,000 | $775,000 |
Jack Johnson signed a $950,000 1-year contract with the Chicago Blackhawks and General Manager Kyle Davidson on August 17, 2022 with an AAV of $950,000. This contract will start in 2022-23 and end after the 2022-23 season. In the first season of the contract the cap hit was equivalent to 1.15% of the salary cap.
35+ Contract ( ) (0 ratings)
| Season | Age* | Clause | Cap Hit | AAV | Perf. Bonus | Sign. Bonus | Salary | Compensation | Minors Salary | Status | |
|---|---|---|---|---|---|---|---|---|---|---|---|
| 2022-23 | 35 | $950,000 | $950,000 | - | - | $950,000 | $950,000 | $950,000 | UFA | ||
| Total | - | - | $950,000 | $950,000 | $950,000 |
Jack Johnson signed a $750,000 1-year contract with the Colorado Avalanche and General Manager Joe Sakic on October 10, 2021 with an AAV of $750,000. This contract will start in 2021-22 and end after the 2021-22 season. In the first season of the contract the cap hit was equivalent to 0.92% of the salary cap.
Standard Contract (UFA) ( ) (0 ratings)
| Season | Age* | Clause | Cap Hit | AAV | Perf. Bonus | Sign. Bonus | Salary | Compensation | Minors Salary | Status | |
|---|---|---|---|---|---|---|---|---|---|---|---|
| 2021-22 | 34 | $750,000 | $750,000 | - | - | $750,000 | $750,000 | $750,000 | UFA | ||
| Total | - | - | $750,000 | $750,000 | $750,000 |
Jack Johnson signed a $1,150,000 1-year contract with the New York Rangers and General Manager Jeff Gorton on October 9, 2020 with an AAV of $1,150,000. This contract will start in 2020-21 and end after the 2020-21 season. In the first season of the contract the cap hit was equivalent to 1.41% of the salary cap.
Standard Contract (UFA) ( ) (0 ratings)
| Season | Age* | Clause | Cap Hit | AAV | Perf. Bonus | Sign. Bonus | Salary | Compensation | Minors Salary | Status | |
|---|---|---|---|---|---|---|---|---|---|---|---|
| 2020-21 | 33 | $1,150,000 | $1,150,000 | - | - | $1,150,000 | $1,150,000 | $1,150,000 | UFA | ||
| Total | - | - | $1,150,000 | $1,150,000 | $1,150,000 |
Jack Johnson signed a $16,250,000 5-year contract with the Pittsburgh Penguins and General Manager Jim Rutherford on July 1, 2018 with an AAV of $3,250,000. This contract will start in 2018-19 and end after the 2022-23 season. In the first season of the contract the cap hit was equivalent to 4.09% of the salary cap. The Pittsburgh Penguins bought out this contract on October 5, 2020.
Standard Contract (UFA) ( ) (0 ratings)
| Season | Age* | Clause | Cap Hit | AAV | Perf. Bonus | Sign. Bonus | Salary | Compensation | Minors Salary | Status | |
|---|---|---|---|---|---|---|---|---|---|---|---|
| 2018-19 | 31 | $3,250,000 | $3,250,000 | - | $2,250,000 | $1,750,000 | $4,000,000 | $4,000,000 | UFA | ||
| 2019-20 | 32 | $3,250,000 | $3,250,000 | - | - | $4,000,000 | $4,000,000 | $4,000,000 | UFA | ||
| 2020-21 | 33 | $3,250,000 | $3,250,000 | - | - | $3,000,000 | $3,000,000 | $3,000,000 | UFA | ||
| 2021-22 | 34 | $3,250,000 | $3,250,000 | - | - | $3,000,000 | $3,000,000 | $3,000,000 | UFA | ||
| 2022-23 | 35 | $3,250,000 | $3,250,000 | - | - | $2,250,000 | $2,250,000 | $2,250,000 | UFA | ||
| Total | - | $2,250,000 | $14,000,000 | $16,250,000 | $16,250,000 |
Jack Johnson signed a $30,500,000 7-year contract with the Los Angeles Kings and General Manager Dean Lombardi on January 9, 2011 with an AAV of $4,357,143. This contract will start in 2011-12 and end after the 2017-18 season. In the first season of the contract the cap hit was equivalent to 6.78% of the salary cap.
Standard Contract (RFA) ( ) (0 ratings)
| Season | Age* | Clause | Cap Hit | AAV | Perf. Bonus | Sign. Bonus | Salary | Compensation | Minors Salary | Status | |
|---|---|---|---|---|---|---|---|---|---|---|---|
| 2011-12 | 24 | $4,357,143 | $4,357,143 | - | $1,000,000 | $2,500,000 | $3,500,000 | $3,500,000 | RFA-arb | ||
| 2012-13 | 25 | $4,357,143 | $4,357,143 | - | - | $3,500,000 | $3,500,000 | $3,500,000 | RFA-arb | ||
| 2013-14 | 26 | $4,357,143 | $4,357,143 | - | - | $3,500,000 | $3,500,000 | $3,500,000 | UFA | ||
| 2014-15 | 27 | $4,357,143 | $4,357,143 | - | - | $5,000,000 | $5,000,000 | $5,000,000 | UFA | ||
| 2015-16 | 28 | $4,357,143 | $4,357,143 | - | - | $5,000,000 | $5,000,000 | $5,000,000 | UFA | ||
| 2016-17 | 29 | $4,357,143 | $4,357,143 | - | - | $5,000,000 | $5,000,000 | $5,000,000 | UFA | ||
| 2017-18 | 30 | $4,357,143 | $4,357,143 | - | - | $5,000,000 | $5,000,000 | $5,000,000 | UFA | ||
| Total | - | $1,000,000 | $29,500,000 | $30,500,000 | $30,500,000 |
Jack Johnson signed a $2,850,000 2-year contract with the Los Angeles Kings and General Manager Dean Lombardi on July 17, 2009 with an AAV of $1,425,000. This contract will start in 2009-10 and end after the 2010-11 season. In the first season of the contract the cap hit was equivalent to 2.51% of the salary cap.
Standard Contract (RFA) ( ) (0 ratings)
| Season | Age* | Clause | Cap Hit | AAV | Perf. Bonus | Sign. Bonus | Salary | Compensation | Minors Salary | Status | |
|---|---|---|---|---|---|---|---|---|---|---|---|
| 2009-10 | 22 | $1,425,000 | $1,425,000 | - | $200,000 | $1,000,000 | $1,200,000 | $1,200,000 | RFA | ||
| 2010-11 | 23 | $1,425,000 | $1,425,000 | - | - | $1,650,000 | $1,650,000 | $1,650,000 | RFA-arb | ||
| Total | - | $200,000 | $2,650,000 | $2,850,000 | $2,850,000 |
Jack Johnson signed a $2,550,000 3-year contract with the Los Angeles Kings and General Manager Dean Lombardi on March 27, 2007 with an AAV of $850,000. This contract will start in 2006-07 and end after the 2008-09 season. In the first season of the contract the cap hit was equivalent to 1.93% of the salary cap.
Entry Level Contract ( ) (0 ratings)
| Season | Age* | Clause | Cap Hit | AAV | Perf. Bonus | Sign. Bonus | Salary | Compensation | Minors Salary | Status | |
|---|---|---|---|---|---|---|---|---|---|---|---|
| 2006-07 | 19 | $850,000 | $2,150,000 | - | $85,000 | $765,000 | $850,000 | $62,500 | ELC | ||
| 2007-08 | 20 | $850,000 | $2,150,000 | $1,950,000 | $85,000 | $765,000 | $850,000 | $62,500 | ELC | ||
| 2008-09 | 21 | $850,000 | $2,150,000 | $1,950,000 | $85,000 | $765,000 | $850,000 | $62,500 | ELC | ||
| Total | $3,900,000 | $255,000 | $2,295,000 | $2,550,000 | $187,500 |
Contract Buyout Details
Pittsburgh Penguins
| Season | Original Compensation | Buyout Compensation | Compensation Savings | Original Caphit | Buyout Caphit | Caphit Savings |
|---|---|---|---|---|---|---|
| 2021-22 | $3,000,000 | $916,667 | $2,083,333 | $3,250,000 | $1,166,667 | $2,083,333 |
| 2022-23 | $3,000,000 | $916,667 | $2,083,333 | $3,250,000 | $1,166,667 | $2,083,333 |
| 2023-24 | $2,250,000 | $916,667 | $1,333,333 | $3,250,000 | $1,916,667 | $1,333,333 |
| 2024-25 | - | $916,667 | $-916,667 | - | $916,667 | $-916,667 |
| 2025-26 | - | $916,667 | $-916,667 | - | $916,667 | $-916,667 |
| 2026-27 | - | $916,667 | $-916,667 | - | $916,667 | $-916,667 |
Career Statistics
| Regular Season | Playoffs | |||||||||||||||||||
|---|---|---|---|---|---|---|---|---|---|---|---|---|---|---|---|---|---|---|---|---|
| Season | League | Team | GP | G | A | Pts | +/- | PIM | Shots | Sh% | TOI/G | GP | G | A | Pts | +/- | PIM | Shots | Sh% | TOI/G |
| 2002-03 | High-MN | Shat.-St. Mary's | 48 | 15 | 27 | 42 | ||||||||||||||
| 2003-04 | U-17 | USNTDP | 31 | 12 | 9 | 21 | 78 | |||||||||||||
| 2003-04 | NAHL | USNTDP | 29 | 3 | 12 | 15 | 93 | |||||||||||||
| 2003-04 | WJ18-A | USA | 6 | 2 | 0 | 2 | 18 | |||||||||||||
| 2004-05 | U-18 | USNTDP | 26 | 5 | 9 | 14 | 86 | |||||||||||||
| 2004-05 | NAHL | USNTDP | 12 | 7 | 10 | 17 | 57 | |||||||||||||
| 2004-05 | WJ18-A | USA | 6 | 0 | 2 | 2 | 35 | |||||||||||||
| 2005-06 | CCHA | U. Of Michigan | 38 | 10 | 22 | 32 | 149 | |||||||||||||
| 2005-06 | WJC-A | USA | 7 | 1 | 5 | 6 | 45 | |||||||||||||
| 2006-07 | CCHA | U. Of Michigan | 36 | 16 | 23 | 39 | 87 | |||||||||||||
| 2006-07 | WC-A | USA | 7 | 1 | 0 | 1 | ||||||||||||||
| 2006-07 | WJC-A | USA | 7 | 3 | 0 | 3 | 14 | |||||||||||||
| 2006-07 | NHL | Los Angeles Kings | 5 | 0 | 0 | 0 | -5 | 18 | 5 | 0.0 | 21:23 | |||||||||
| 2007-08 | NHL | Los Angeles Kings | 74 | 3 | 8 | 11 | -19 | 76 | 81 | 3.7 | 21:42 | |||||||||
| 2008-09 | NHL | Los Angeles Kings | 41 | 6 | 5 | 11 | -18 | 46 | 50 | 12.0 | 20:17 | |||||||||
| 2008-09 | WC-A | USA | 9 | 5 | 2 | 7 | 10 | |||||||||||||
| 2009-10 | Olympics | USA | 6 | 0 | 1 | 1 | 2 | |||||||||||||
| 2009-10 | WC-A | USA | 6 | 0 | 3 | 3 | 4 | |||||||||||||
| 2009-10 | NHL | Los Angeles Kings | 80 | 8 | 28 | 36 | -15 | 48 | 130 | 6.2 | 22:37 | 6 | 7 | 7 | -5 | 6 | 15 | 0.0 | 23:42 | |
| 2010-11 | WC-A | USA | 7 | 1 | 2 | 3 | -4 | 8 | ||||||||||||
| 2010-11 | NHL | Los Angeles Kings | 82 | 5 | 37 | 42 | -21 | 44 | 153 | 3.3 | 23:12 | 6 | 1 | 4 | 5 | -2 | 16 | 6.2 | 22:49 | |
| 2011-12 | NHL | Los Angeles Kings | 61 | 8 | 16 | 24 | -12 | 24 | 120 | 6.7 | 22:31 | |||||||||
| 2011-12 | NHL | Columbus Blue Jackets | 21 | 4 | 10 | 14 | +5 | 15 | 56 | 7.1 | 27:25 | |||||||||
| 2011-12 | WC-A | USA | 8 | 3 | 1 | 4 | 16 | |||||||||||||
| 2012-13 | NHL | Columbus Blue Jackets | 44 | 5 | 14 | 19 | -5 | 12 | 96 | 5.2 | 25:58 | |||||||||
| 2013-14 | NHL | Columbus Blue Jackets | 82 | 5 | 28 | 33 | -7 | 48 | 147 | 3.4 | 24:41 | 6 | 3 | 4 | 7 | -1 | 4 | 14 | 21.4 | 29:21 |
| 2014-15 | NHL | Columbus Blue Jackets | 79 | 8 | 32 | 40 | -13 | 44 | 141 | 5.7 | 24:10 | |||||||||
| 2015-16 | NHL | Columbus Blue Jackets | 60 | 6 | 8 | 14 | -16 | 25 | 86 | 7.0 | 24:11 | |||||||||
| 2016-17 | WCup | USA | 2 | 0 | 0 | 0 | -1 | |||||||||||||
| 2016-17 | NHL | Columbus Blue Jackets | 82 | 5 | 18 | 23 | +23 | 32 | 116 | 4.3 | 21:49 | 5 | 1 | 1 | 2 | -3 | 15 | 6.7 | 25:52 | |
| 2017-18 | NHL | Columbus Blue Jackets | 77 | 3 | 8 | 11 | -6 | 22 | 88 | 3.4 | 19:33 | |||||||||
| 2018-19 | NHL | Pittsburgh Penguins | 82 | 1 | 12 | 13 | -4 | 41 | 86 | 1.2 | 19:17 | 3 | -3 | 6 | 2 | 0.0 | 15:21 | |||
| 2019-20 | NHL | Pittsburgh Penguins | 67 | 3 | 8 | 11 | -1 | 26 | 63 | 4.8 | 19:28 | 4 | -4 | 2 | 0.0 | 15:56 | ||||
| 2020-21 | NHL | New York Rangers | 13 | 1 | 0 | 1 | -5 | 8 | 13 | 7.7 | 16:58 | |||||||||
| 2021-22 | NHL | Colorado Avalanche | 74 | 1 | 8 | 9 | +5 | 42 | 57 | 1.8 | 16:45 | 13 | +1 | 10 | 3 | 0.0 | 11:06 | |||
| 2022-23 | NHL | Chicago Blackhawks | 58 | 0 | 4 | 4 | -25 | 16 | 63 | 0.0 | 19:50 | |||||||||
| 2022-23 | NHL | Colorado Avalanche | 25 | 2 | 2 | 4 | +10 | 12 | 29 | 6.9 | 17:33 | 3 | 2 | 0.0 | 13:54 | |||||
| 2023-24 | NHL | Colorado Avalanche | 80 | 3 | 13 | 16 | +15 | 38 | 76 | 3.9 | 14:56 | 11 | +4 | 2 | 4 | 0.0 | 13:57 | |||
| 2024-25 | NHL | Columbus Blue Jackets | 41 | 0 | 6 | 6 | -13 | 2 | 23 | 0.0 | 12:52 | |||||||||
| NHL Career | 1228 | 77 | 265 | 342 | -127 | 639 | 1679 | 4.6 | 20:55 | 57 | 5 | 16 | 21 | -13 | 30 | 71 | 7.0 | 18:08 | ||