
 Ian Cole
| Position | Left Defense / Right Defense | Current Team | Chicago Blackhawks |
| Shoots | Left | Current Contract | 1 year ($4.0M CapHit) |
| Height | 6'1" | Expires | 2026-27 |
| Weight (lbs) | 237 | Expiry Age (Jun 30) | 38 |
| Age (DOB) | 37 (Feb 21, 1989) | Expiry Status | UFA |
| Drafted | 2007, Round 1, Overall 18 (STL) |
| Date | Team | Transaction | |
|---|---|---|---|
| Jul 1, 2026 | Chicago Blackhawks | Signed 1 year @ $4.750M AAV starting in 2026-27 | |
| Mar 5, 2025 | Utah Hockey Club | Signed 1 year @ $3.000M AAV starting in 2025-26 | |
| Jul 1, 2024 | Utah Hockey Club | Signed 1 year @ $3.100M AAV starting in 2024-25 | |
| Jul 1, 2023 | Vancouver Canucks | Signed 1 year @ $3.000M AAV starting in 2023-24 | |
| Jul 13, 2022 | Tampa Bay Lightning | Signed 1 year @ $3.000M AAV starting in 2022-23 | |
| Jul 28, 2021 | Carolina Hurricanes | Signed 1 year @ $2.900M AAV starting in 2022-23 | |
| Jul 1, 2018 | Colorado Avalanche | Signed 3 years @ $4.250M AAV starting in 2018-19 | |
| Jun 29, 2015 | Pittsburgh Penguins | Signed 3 years @ $2.100M AAV starting in 2015-16 | |
| May 28, 2013 | St. Louis Blues | Signed 2 years @ $825K AAV starting in 2013-14 | |
| Mar 22, 2010 | St. Louis Blues | Signed to an entry level contract. |
Player Card(s)
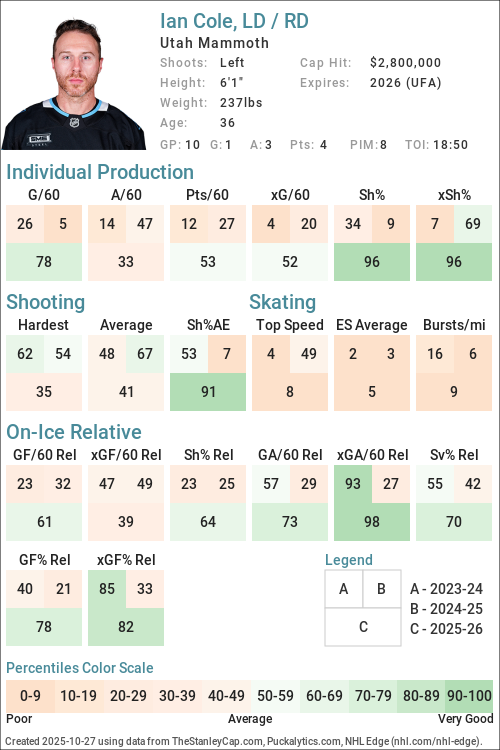
URL: https://thestanleycap.com/cdn/player_cards/20252026/ian-cole-8474013.png
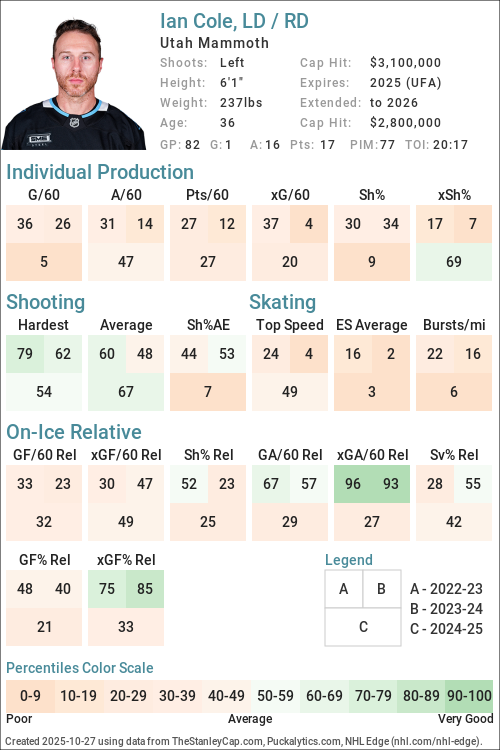
URL: https://thestanleycap.com/cdn/player_cards/20242025/ian-cole-8474013.png
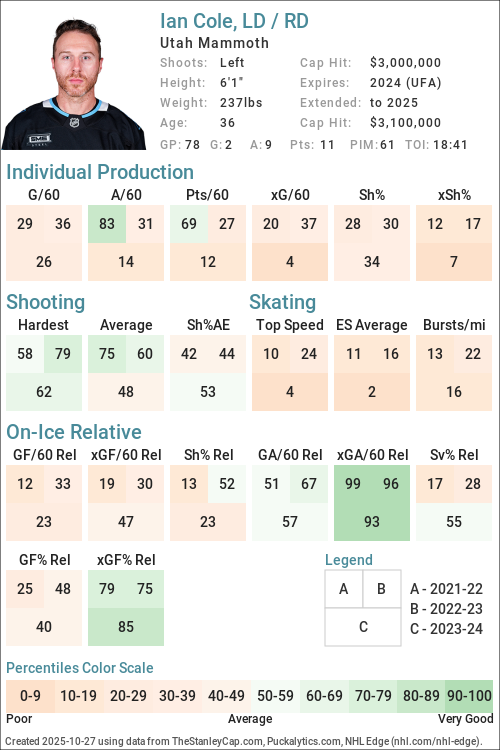
URL: https://thestanleycap.com/cdn/player_cards/20232024/ian-cole-8474013.png
About Player Cards
Player cards present an infographic of a players performance using a series of Player Archetypes developed for Puckalytics.com and TheStanleyCap.com. The boxes in the rink image show the archetype ratings for the season specified in the card while the graphs to the right show the five-year trends for those archetypes.
Except for Faceoffs, the values shown are the players z-score (standard deviation from the mean) for the specific metric used to calculate the archetype values. When calculating z-scores forwards were compared to forwards and defensemen were compared to defensemen. Positive values indicate the player is above average and shaded in blue, while negative values indicate the player is below average and shaded in pink. The five year trend charts show a range of -4.0 to 4.0.
The value shown for Faceoffs is the faceoff winning percentage rather than their z-score with winning percentages below 50 in pink shades and above 50 in blue shades.
All archetypes are 5v5 except 5v4 TOI, 4v5 TOI, Skating (even strength) and Faceoffs (all situations). Archetypes use regular season data only.
Archetypes Summary
- Sniper - Measures the to score above the expected goal rate.
- Rebound - Measures the percent of a players shot attempts that come from rebounds (forwards only).
- 5v4 TOI - Powerplay ice time, calculated as the percentage of his teams 5v4 ice time that the player was on the ice for.
- Shooter - Measures whether a players points come from shots (goals or assists on rebounds from his shots).
- Producer - Measures a players ability to produce goals and assists, adjusted for quality of teammates.
- Playmaker - Measures whether a players points come from passes.
- Drive - Measures a players ability to drive puck possession and generate shot attempts for his team.
- Rush - Measures the percent of a players shot attempts that come from rush plays
- Possession - An indicator of a players ability to improve his teams puck possession game.
- Faceoffs - Faceoff Winning Percentage (min. 75 faceoffs taken).
- 5v5 TOI - The percentage of his teams 5v5 TOI that the player was on the ice for.
- Suppress - Measures a players ability to suppress opponent puck possession and shot attempts against.
- Skating - An indicator of a players skating ability, or speed bursts above 20mph per mile skated.
- Defend - An indicator of a players ability to suppress shot quality against.
- 4v5 TOI - Penalty Kill ice time, calculated as the percentage of his teams 4v5 ice time that the player was on the ice for.
Data Sources
- Salary data is from TheStanleyCap.com
- Skating data is from NHL Edge
- Other statistics are from Puckalytics.com and derived from data from NHL.com
Terms of Use
You are free to use include player cards in written articles, share on social media, or on other public websites under the following conditions:
- You credit TheStanleyCap.com as the source and provide a link back to TheStanleyCap.com or this player page.
- You do not mass copy/duplicate/publish dozens or hundreds of player cards. A few, or a handful for a written article is fine. Be reasonable. Fair use rules apply.
- If you are a high-traffic website you must download and host the image(s) on your site rather than overload TheStanleyCap servers with traffic.
Note: Player cards will update daily throughout the season so if you want to include snapshot then you must download the image.
If you have any questions, send an e-mail to the e-mail address at the top of this page.
Read Introducing Player Archetypes on HockeyAnalysis.com for more details on archetype calculations.
Core Archetypes
| Season | Team(s) | GP | TOI | Producer | Playmaker | Shooter | Sniper | Rebound | Rush | Skating | Defend |
|---|---|---|---|---|---|---|---|---|---|---|---|
| 2015-16 | PIT | 70 | -0.47 | 0.58 | -0.82 | -1.40 | - | 0.14 | - | -0.81 | |
| 2016-17 | PIT | 81 | 0.21 | 0.30 | -0.21 | 0.06 | - | -0.96 | - | 0.27 | |
| 2017-18 | CBJ, PIT | 67 | 0.38 | -0.04 | 0.60 | 1.05 | - | -1.06 | - | -0.03 | |
| 2018-19 | COL | 71 | -0.40 | 0.01 | -0.78 | -0.91 | - | -1.03 | - | -1.72 | |
| 2019-20 | COL | 65 | 2.13 | 1.77 | 0.74 | 0.21 | - | -0.88 | - | -0.03 | |
| 2020-21 | COL, MIN | 54 | -1.09 | -0.98 | -0.65 | -0.05 | - | -0.81 | - | 1.47 | |
| 2021-22 | CAR | 75 | 0.57 | 0.95 | -0.46 | -0.39 | - | -1.07 | -1.04 | -0.88 | |
| 2022-23 | TBL | 78 | -0.65 | -0.56 | -0.57 | -0.26 | - | 0.47 | -0.78 | -0.50 | |
| 2023-24 | VAN | 78 | -1.12 | -0.91 | -0.87 | -0.05 | - | -1.10 | -0.99 | 0.09 | |
| 2024-25 | UTA | 82 | -0.65 | -0.19 | -0.85 | -1.66 | - | -0.68 | -1.23 | -0.23 | |
| 2025-26 | UTA | 82 | -0.38 | -0.02 | -0.68 | -0.46 | - | -0.70 | -0.82 | -0.55 |
Situational and Secondary Archetypes
| Season | Team(s) | GP | TOI | 5v5 TOI | 5v4 TOI | 4v5 TOI | Possession | Drive | Suppress | Faceoffs |
|---|---|---|---|---|---|---|---|---|---|---|
| 2015-16 | PIT | 70 | -0.98 | -1.26 | 0.47 | -0.83 | -0.38 | -0.84 | - | |
| 2016-17 | PIT | 81 | 0.35 | -1.54 | 0.54 | 0.01 | -0.62 | 0.63 | - | |
| 2017-18 | CBJ, PIT | 67 | -0.48 | -1.51 | 0.28 | 0.10 | -0.74 | 0.93 | - | |
| 2018-19 | COL | 71 | -0.00 | -1.70 | 1.28 | 0.78 | -0.03 | 1.22 | - | |
| 2019-20 | COL | 65 | -0.63 | -1.74 | 0.68 | 0.51 | 0.18 | 0.56 | - | |
| 2020-21 | COL, MIN | 54 | -1.01 | -1.59 | -0.62 | -1.21 | -0.87 | -0.67 | - | |
| 2021-22 | CAR | 75 | -0.92 | -1.50 | 0.36 | 1.21 | -0.36 | 2.14 | - | |
| 2022-23 | TBL | 78 | 0.03 | -1.37 | 1.16 | 0.16 | -1.05 | 1.42 | - | |
| 2023-24 | VAN | 78 | -0.28 | -1.40 | 0.77 | 0.22 | -0.28 | 0.62 | - | |
| 2024-25 | UTA | 82 | 0.20 | -1.47 | 1.06 | -0.04 | 0.41 | -0.50 | - | |
| 2025-26 | UTA | 82 | -0.83 | -1.49 | 1.33 | -0.47 | -0.69 | 0.00 | - |
5v5 Individual Stats
| Season | Team(s) | GP | TOI | G/60 | A/60 | Pts/60 | xG/60 | GAE/60 | Sh% | xSh% | Sh%AE | %SA Rush | %SA Reb. |
|---|---|---|---|---|---|---|---|---|---|---|---|---|---|
| 2015-16 | PIT | 70 | 981:24 | 0.00 | 0.55 | 0.55 | 0.14 | -0.14 | 0.00 | 3.52 | -3.52 | 1.06 | 1.06 |
| 2016-17 | PIT | 81 | 1343:14 | 0.18 | 0.76 | 0.94 | 0.18 | 0.00 | 4.71 | 4.66 | 0.04 | 0.00 | 2.00 |
| 2017-18 | CBJ | 20 | 314:59 | 0.38 | 0.57 | 0.95 | 0.11 | 0.27 | 9.52 | 2.66 | 6.86 | 0.00 | 0.00 |
| 2017-18 | PIT | 47 | 689:50 | 0.26 | 0.70 | 0.96 | 0.18 | 0.08 | 5.08 | 3.56 | 1.52 | 0.00 | 3.57 |
| 2017-18 | CBJ, PIT | 67 | 1004:49 | 0.30 | 0.66 | 0.96 | 0.16 | 0.14 | 6.25 | 3.33 | 2.92 | 0.00 | 2.70 |
| 2018-19 | COL | 71 | 1092:32 | 0.05 | 0.60 | 0.66 | 0.14 | -0.09 | 1.39 | 3.61 | -2.22 | 0.00 | 0.93 |
| 2019-20 | COL | 65 | 922:49 | 0.26 | 1.17 | 1.43 | 0.24 | 0.02 | 4.94 | 4.50 | 0.44 | 0.00 | 3.31 |
| 2020-21 | MIN | 52 | 737:06 | 0.08 | 0.49 | 0.57 | 0.09 | -0.00 | 3.85 | 4.04 | -0.20 | 0.00 | 2.56 |
| 2020-21 | COL | 2 | 22:43 | 0.00 | 0.00 | 0.00 | 0.05 | -0.05 | 0.00 | 1.79 | -1.79 | 0.00 | 0.00 |
| 2020-21 | COL, MIN | 54 | 759:49 | 0.08 | 0.47 | 0.55 | 0.08 | -0.01 | 3.70 | 3.96 | -0.26 | 0.00 | 2.50 |
| 2021-22 | CAR | 75 | 1062:41 | 0.11 | 0.90 | 1.02 | 0.16 | -0.05 | 2.67 | 3.86 | -1.19 | 0.00 | 6.84 |
| 2022-23 | TBL | 78 | 1239:45 | 0.15 | 0.53 | 0.68 | 0.19 | -0.04 | 3.09 | 3.95 | -0.86 | 1.52 | 3.03 |
| 2023-24 | VAN | 78 | 1184:38 | 0.10 | 0.46 | 0.56 | 0.09 | 0.01 | 3.57 | 3.32 | 0.25 | 0.00 | 5.62 |
| 2024-25 | UTA | 82 | 1363:50 | 0.04 | 0.62 | 0.66 | 0.15 | -0.11 | 1.61 | 5.48 | -3.87 | 0.00 | 2.75 |
| 2025-26 | UTA | 82 | 1205:28 | 0.15 | 0.70 | 0.85 | 0.18 | -0.03 | 5.17 | 6.27 | -1.09 | 0.00 | 3.74 |
5v5 On Ice Stats
| Season | Team(s) | GP | TOI | SAF/60 | GF/60 | xGF/60 | SAA/60 | GA/60 | xGA/60 | GF% | xGF% | xGF Rel | xGA Rel | xGF% Rel |
|---|---|---|---|---|---|---|---|---|---|---|---|---|---|---|
| 2015-16 | PIT | 70 | 981:24 | 42.43 | 1.90 | 2.41 | 40.60 | 2.20 | 2.18 | 46.27 | 52.55 | -0.15 | 0.21 | -4.03 |
| 2016-17 | PIT | 81 | 1343:14 | 42.43 | 2.95 | 2.65 | 40.20 | 2.10 | 2.31 | 58.41 | 53.36 | -0.18 | -0.14 | -0.17 |
| 2017-18 | CBJ | 20 | 314:59 | 43.05 | 2.48 | 2.59 | 37.91 | 1.52 | 2.19 | 61.90 | 54.21 | -0.08 | -0.48 | 4.20 |
| 2017-18 | PIT | 47 | 689:50 | 42.44 | 2.78 | 2.39 | 38.88 | 2.70 | 2.46 | 50.79 | 49.35 | -0.14 | 0.08 | -2.18 |
| 2017-18 | CBJ, PIT | 67 | 1004:49 | 42.63 | 2.69 | 2.46 | 38.57 | 2.33 | 2.37 | 53.57 | 50.86 | -0.12 | -0.09 | -0.19 |
| 2018-19 | COL | 71 | 1092:32 | 41.96 | 1.92 | 2.36 | 38.94 | 2.80 | 2.18 | 40.70 | 51.93 | -0.00 | -0.20 | 2.17 |
| 2019-20 | COL | 65 | 922:49 | 43.95 | 2.93 | 2.47 | 39.53 | 1.89 | 2.35 | 60.81 | 51.18 | 0.02 | 0.06 | -0.46 |
| 2020-21 | MIN | 52 | 737:06 | 34.84 | 3.17 | 2.23 | 43.30 | 1.79 | 2.22 | 63.93 | 50.22 | -0.02 | 0.08 | -1.11 |
| 2020-21 | COL | 2 | 22:43 | 36.98 | 2.64 | 2.28 | 29.05 | 2.64 | 2.23 | 50.00 | 50.60 | 0.88 | 0.48 | 6.13 |
| 2020-21 | COL, MIN | 54 | 759:49 | 34.90 | 3.16 | 2.24 | 42.88 | 1.82 | 2.22 | 63.49 | 50.23 | 0.02 | 0.10 | -0.92 |
| 2021-22 | CAR | 75 | 1062:41 | 47.31 | 2.48 | 2.94 | 33.71 | 2.03 | 2.19 | 55.00 | 57.36 | -0.19 | -0.43 | 2.92 |
| 2022-23 | TBL | 78 | 1239:45 | 40.56 | 2.47 | 2.71 | 37.99 | 2.37 | 2.35 | 51.00 | 53.59 | -0.20 | -0.40 | 2.10 |
| 2023-24 | VAN | 78 | 1184:38 | 39.46 | 2.58 | 2.42 | 37.23 | 1.98 | 2.04 | 56.67 | 54.30 | -0.02 | -0.30 | 3.18 |
| 2024-25 | UTA | 82 | 1363:50 | 44.87 | 2.20 | 2.72 | 39.55 | 2.46 | 2.41 | 47.17 | 52.96 | 0.03 | 0.16 | -1.39 |
| 2025-26 | UTA | 82 | 1205:28 | 39.77 | 2.64 | 2.51 | 37.53 | 2.49 | 2.32 | 51.46 | 52.00 | -0.28 | -0.20 | -0.60 |
NHL Edge Stats
| Skating | Shooting | Zone Time | |||||||||||
|---|---|---|---|---|---|---|---|---|---|---|---|---|---|
| Season | GP | Top Speed | Bursts>20/mi | Avg. Speed | Top Speed | Avg. Speed | %Long Range | %Mid Range | %High Danger | ES DZ% | ES NZ% | ES OZ% | |
| This table is for Basic and Premium subscribers only. To view please login to and/or subscribe to one of our subscription plans. | |||||||||||||
Legend
| Percentile 0-25 | Percentile 25-50 | Percentile 50-75 | Percentile 75-100 |
5v5 Defense Pairs
| Season | Teammate | Team | TOI | GF/60 | GA/60 | GF% | xGF/60 | xGA/60 | xGF% | xGF Rel | xGA Rel | xGF% Rel |
|---|
Glossary
| Type | Statistic | Definition |
|---|---|---|
| Individual | G/60 | Goals Against per 60 minutes. |
| Individual | A/60 | Assists per 60 minutes. |
| Individual | Pts/60 | Points per 60 minutes. |
| Individual | xG/60 | Expected Goals per 60 minutes. |
| Individual | GAE/60 | Goals Above Expected (G/60 - xG/60). |
| Individual | Sh% | Shooting Percentage. |
| Individual | xSh% | Expected Shooting Percentage. |
| Individual | Sh%AE | Shooting percentage above expected (Sh% - xSh%). |
| Individual | %SA Rush | Percentage of shot attempts determined to be on the rush. |
| Individual | %SA Reb. | Percentage of shot attempts determined to be from rebounds. |
| On Ice | SAF/60 | Shot Attempts For per 60 minutes. |
| On Ice | GF/60 | Goals For per 60 minutes. |
| On Ice | xGF/60 | Expected Goals For per 60 minutes. |
| On Ice | SAA/60 | Shot Attempts Against per 60 minutes (lower is better). |
| On Ice | GA/60 | Goals Against per 60 minutes (lower is better). |
| On Ice | xGA/60 | Expected Goals Against per 60 minutes (lower is better). |
| On Ice | GF% | Goals For Percentage = Goals For / (Goals For + Goals Against) |
| On Ice | xGF% | Expected Goals For Percentage = Expected Goals For / (Expected Goals For + Expected Goals Against) |
| On Ice | xGF Rel | xGF/60 when On Ice - xGF/60 when not On Ice. |
| On Ice | xGA Rel | xGA/60 when On Ice - xGA/60 when not On Ice (lower is better). |
| On Ice | xGF% Rel | xGF% when On Ice - xGF% when not On Ice. |
News and Opinions
-
Meet the New Chicago Blackhawks: Cole Smith at The Hockey Writers (Mon Jul 13, 2026)
-
Meet the New Chicago Blackhawks: Ian Cole at The Hockey Writers (Fri Jul 10, 2026)
-
Jack’s Daily: Bedard Update; Cole Speaks; Mammoth Match For Hayton at Chicago Hockey Now (Thu Jul 9, 2026)
-
Blackhawks Are Hoping That Ian Cole & Cole Smith Keep Penalty Kill Up To Standard at Yahoo Sports NHL (Fri Jul 3, 2026)
-
Blackhawks Opened 2026 Free Agency With No Surprises at The Hockey Writers (Wed Jul 1, 2026)
-
Blackhawks Sign 2 AHL Defensemen On Day 1 Of Free Agency at Yahoo Sports NHL (Wed Jul 1, 2026)
-
Blackhawks Add Veteran Defenseman Ian Cole On One-Year Contract at Chicago Hockey Now (Wed Jul 1, 2026)
-
Ian Cole Is Coming To Chicago Blackhawks On 1-Year Free-Agent Deal at Yahoo Sports NHL (Wed Jul 1, 2026)
-
Reports: Blackhawks signing D Ian Cole at Second City Hockey (Wed Jul 1, 2026)
-
Blackhawks Sign Cole Smith To 3 Year Free-Agent Contract at Yahoo Sports NHL (Wed Jul 1, 2026)
-
Utah Mammoth’s 2025-26 Report Cards: Ian Cole at The Hockey Writers (Wed Jun 3, 2026)
-
Utah Mammoth Players Share Thoughts on Clinching Franchise’s First Playoff Berth at The Hockey Writers (Tue Apr 14, 2026)
-
Schmaltz scores in OT to give the Mammoth a 4-3 victory over the Kings at Yahoo Sports NHL (Mon Mar 23, 2026)
-
3 Takeaways From Mammoth’s 7-0 Win Over Ducks at The Hockey Writers (Thu Dec 4, 2025)
-
3 Takeaways From Mammoth’s 4-2 Loss to Lightning at The Hockey Writers (Mon Nov 3, 2025)
-
Should the Mammoth Go Youth or Experience for 6th Defenseman? at The Hockey Writers (Tue Aug 5, 2025)
-
Ian Cole: Canucks Had ‘Tears in Their Eyes’ in Warmups at Vancouver Hockey Now (Mon Apr 22, 2024)
-
Examining The Left-Handed Defensemen Free Agent Market at Devils Army (Mon Jun 27, 2022)
Current Contract
Ian Cole signed a $4,000,000 1-year contract with the Chicago Blackhawks and General Manager Kyle Davidson on July 1, 2026 with an AAV of $4,000,000. This contract will start in 2026-27 and end after the 2026-27 season. In the first season of the contract the cap hit was equivalent to 3.85% of the salary cap.
Standard Contract (UFA) ( ) (0 ratings)
Ian Cole signed a $2,800,000 1-year contract with the Utah Hockey Club and General Manager Bill Armstrong on March 5, 2025 with an AAV of $2,800,000. This contract will start in 2025-26 and end after the 2025-26 season. In the first season of the contract the cap hit was equivalent to 2.93% of the salary cap.
Standard Contract (UFA) ( ) (0 ratings)
| Season | Age* | Clause | Cap Hit | AAV | Perf. Bonus | Sign. Bonus | Salary | Compensation | Minors Salary | Status | |
|---|---|---|---|---|---|---|---|---|---|---|---|
| 2025-26 | 36 | $2,800,000 | $3,000,000 | $200,000 | - | $2,800,000 | $2,800,000 | $2,800,000 | UFA | ||
| Total | $200,000 | - | $2,800,000 | $2,800,000 | $2,800,000 |
Ian Cole signed a $3,100,000 1-year contract with the Utah Hockey Club and General Manager Bill Armstrong on July 1, 2024 with an AAV of $3,100,000. This contract will start in 2024-25 and end after the 2024-25 season. In the first season of the contract the cap hit was equivalent to 3.52% of the salary cap.
35+ Contract ( ) (0 ratings)
| Season | Age* | Clause | Cap Hit | AAV | Perf. Bonus | Sign. Bonus | Salary | Compensation | Minors Salary | Status | |
|---|---|---|---|---|---|---|---|---|---|---|---|
| 2024-25 | 35 | $3,100,000 | $3,100,000 | - | - | $3,100,000 | $3,100,000 | $3,100,000 | UFA | ||
| Total | - | - | $3,100,000 | $3,100,000 | $3,100,000 |
Ian Cole signed a $3,000,000 1-year contract with the Vancouver Canucks and General Manager Patrik Alvin on July 1, 2023 with an AAV of $3,000,000. This contract will start in 2023-24 and end after the 2023-24 season. In the first season of the contract the cap hit was equivalent to 3.59% of the salary cap.
Standard Contract (UFA) ( ) (0 ratings)
| Season | Age* | Clause | Cap Hit | AAV | Perf. Bonus | Sign. Bonus | Salary | Compensation | Minors Salary | Status | |
|---|---|---|---|---|---|---|---|---|---|---|---|
| 2023-24 | 34 | $3,000,000 | $3,000,000 | - | - | $3,000,000 | $3,000,000 | $3,000,000 | UFA | ||
| Total | - | - | $3,000,000 | $3,000,000 | $3,000,000 |
Ian Cole signed a $3,000,000 1-year contract with the Tampa Bay Lightning and General Manager Julien Brisebois on July 13, 2022 with an AAV of $3,000,000. This contract will start in 2022-23 and end after the 2022-23 season. In the first season of the contract the cap hit was equivalent to 3.64% of the salary cap.
Standard Contract (UFA) ( ) (0 ratings)
| Season | Age* | Clause | Cap Hit | AAV | Perf. Bonus | Sign. Bonus | Salary | Compensation | Minors Salary | Status | |
|---|---|---|---|---|---|---|---|---|---|---|---|
| 2022-23 | 33 | $3,000,000 | $3,000,000 | - | - | $3,000,000 | $3,000,000 | $3,000,000 | UFA | ||
| Total | - | - | $3,000,000 | $3,000,000 | $3,000,000 |
Ian Cole signed a $2,900,000 1-year contract with the Carolina Hurricanes and General Manager Don Waddell on July 28, 2021 with an AAV of $2,900,000. This contract will start in 2022-23 and end after the 2022-23 season. In the first season of the contract the cap hit was equivalent to 3.52% of the salary cap.
Standard Contract (UFA) ( ) (0 ratings)
| Season | Age* | Clause | Cap Hit | AAV | Perf. Bonus | Sign. Bonus | Salary | Compensation | Minors Salary | Status | |
|---|---|---|---|---|---|---|---|---|---|---|---|
| 2022-23 | 33 | $2,900,000 | $2,900,000 | - | - | $2,900,000 | $2,900,000 | $2,900,000 | UFA | ||
| Total | - | - | $2,900,000 | $2,900,000 | $2,900,000 |
Ian Cole signed a $12,750,000 3-year contract with the Colorado Avalanche and General Manager Joe Sakic on July 1, 2018 with an AAV of $4,250,000. This contract will start in 2018-19 and end after the 2020-21 season. In the first season of the contract the cap hit was equivalent to 5.35% of the salary cap.
Standard Contract (UFA) ( ) (0 ratings)
| Season | Age* | Clause | Cap Hit | AAV | Perf. Bonus | Sign. Bonus | Salary | Compensation | Minors Salary | Status | |
|---|---|---|---|---|---|---|---|---|---|---|---|
| 2018-19 | 29 | $4,250,000 | $4,250,000 | - | - | $5,000,000 | $5,000,000 | $5,000,000 | UFA | ||
| 2019-20 | 30 | $4,250,000 | $4,250,000 | - | - | $4,750,000 | $4,750,000 | $4,750,000 | UFA | ||
| 2020-21 | 31 | $4,250,000 | $4,250,000 | - | - | $3,000,000 | $3,000,000 | $3,000,000 | UFA | ||
| Total | - | - | $12,750,000 | $12,750,000 | $12,750,000 |
Ian Cole signed a $6,300,000 3-year contract with the Pittsburgh Penguins and General Manager Jim Rutherford on June 29, 2015 with an AAV of $2,100,000. This contract will start in 2015-16 and end after the 2017-18 season. In the first season of the contract the cap hit was equivalent to 2.94% of the salary cap.
Standard Contract (RFA) ( ) (0 ratings)
| Season | Age* | Clause | Cap Hit | AAV | Perf. Bonus | Sign. Bonus | Salary | Compensation | Minors Salary | Status | |
|---|---|---|---|---|---|---|---|---|---|---|---|
| 2015-16 | 26 | $2,100,000 | $2,100,000 | - | - | $1,500,000 | $1,500,000 | $1,500,000 | RFA-arb | ||
| 2016-17 | 27 | $2,100,000 | $2,100,000 | - | - | $2,300,000 | $2,300,000 | $2,300,000 | UFA | ||
| 2017-18 | 28 | $2,100,000 | $2,100,000 | - | - | $2,500,000 | $2,500,000 | $2,500,000 | UFA | ||
| Total | - | - | $6,300,000 | $6,300,000 | $6,300,000 |
Ian Cole signed a $1,650,000 2-year contract with the St. Louis Blues and General Manager Doug Armstrong on May 28, 2013 with an AAV of $825,000. This contract will start in 2013-14 and end after the 2014-15 season. In the first season of the contract the cap hit was equivalent to 1.28% of the salary cap.
Standard Contract (RFA) ( ) (0 ratings)
| Season | Age* | Clause | Cap Hit | AAV | Perf. Bonus | Sign. Bonus | Salary | Compensation | Minors Salary | Status | |
|---|---|---|---|---|---|---|---|---|---|---|---|
| 2013-14 | 24 | $825,000 | $825,000 | - | - | $750,000 | $750,000 | $750,000 | RFA-arb | ||
| 2014-15 | 25 | $825,000 | $825,000 | - | - | $900,000 | $900,000 | $900,000 | RFA-arb | ||
| Total | - | - | $1,650,000 | $1,650,000 | $1,650,000 |
Ian Cole signed a $2,625,000 3-year contract with the St. Louis Blues and General Manager Larry Pleau on March 22, 2010 with an AAV of $875,000. This contract will start in 2010-11 and end after the 2012-13 season. In the first season of the contract the cap hit was equivalent to 1.47% of the salary cap.
Entry Level Contract ( ) (0 ratings)
| Season | Age* | Clause | Cap Hit | AAV | Perf. Bonus | Sign. Bonus | Salary | Compensation | Minors Salary | Status | |
|---|---|---|---|---|---|---|---|---|---|---|---|
| 2010-11 | 21 | $875,000 | $1,300,000 | $450,000 | $87,500 | $787,500 | $875,000 | $65,000 | ELC | ||
| 2011-12 | 22 | $875,000 | $1,300,000 | $425,000 | $87,500 | $787,500 | $875,000 | $65,000 | ELC | ||
| 2012-13 | 23 | $875,000 | $1,300,000 | $400,000 | $87,500 | $787,500 | $875,000 | $65,000 | ELC | ||
| Total | $1,275,000 | $262,500 | $2,362,500 | $2,625,000 | $195,000 |
Career Statistics
| Regular Season | Playoffs | |||||||||||||||||||
|---|---|---|---|---|---|---|---|---|---|---|---|---|---|---|---|---|---|---|---|---|
| Season | League | Team | GP | G | A | Pts | +/- | PIM | Shots | Sh% | TOI/G | GP | G | A | Pts | +/- | PIM | Shots | Sh% | TOI/G |
| 2004-05 | MWEHL | Det. Victory Honda | 60 | 15 | 25 | 40 | ||||||||||||||
| 2005-06 | U-17 | USNTDP | 18 | 2 | 1 | 3 | 14 | |||||||||||||
| 2005-06 | NAHL | USNTDP | 40 | 2 | 8 | 10 | 75 | 12 | 3 | 3 | 14 | |||||||||
| 2006-07 | U-18 | USNTDP | 42 | 6 | 11 | 17 | 36 | |||||||||||||
| 2006-07 | NAHL | USNTDP | 16 | 2 | 7 | 9 | 28 | |||||||||||||
| 2006-07 | WJ18-A | USA | 7 | 4 | 1 | 5 | 6 | |||||||||||||
| 2007-08 | CCHA | U. Of Notre Dame | 43 | 8 | 12 | 20 | 40 | |||||||||||||
| 2007-08 | WJC-A | USA | 6 | 0 | 0 | 0 | 6 | |||||||||||||
| 2008-09 | CCHA | U. Of Notre Dame | 38 | 6 | 20 | 26 | 58 | |||||||||||||
| 2008-09 | WJC-A | USA | 6 | 2 | 2 | 4 | 4 | |||||||||||||
| 2009-10 | CCHA | U. Of Notre Dame | 30 | 3 | 16 | 19 | 55 | |||||||||||||
| 2009-10 | AHL | Peoria | 9 | 1 | 4 | 5 | +2 | 4 | ||||||||||||
| 2010-11 | AHL | Peoria | 44 | 5 | 10 | 15 | +2 | 63 | 67 | 746.0 | ||||||||||
| 2010-11 | NHL | St. Louis Blues | 26 | 1 | 3 | 4 | +6 | 35 | 22 | 4.6 | 17:36 | |||||||||
| 2011-12 | AHL | Peoria | 22 | 1 | 3 | 4 | -8 | 26 | 23 | 435.0 | ||||||||||
| 2011-12 | NHL | St. Louis Blues | 26 | 1 | 5 | 6 | +7 | 22 | 18 | 5.6 | 15:55 | 2 | -1 | 1 | 0.0 | 10:26 | ||||
| 2012-13 | AHL | Peoria | 34 | 3 | 11 | 14 | -9 | 43 | 46 | 652.0 | ||||||||||
| 2012-13 | NHL | St. Louis Blues | 15 | 0 | 1 | 1 | -4 | 10 | 10 | 0.0 | 17:45 | |||||||||
| 2013-14 | NHL | St. Louis Blues | 46 | 3 | 8 | 11 | +15 | 31 | 45 | 6.7 | 15:05 | |||||||||
| 2014-15 | NHL | St. Louis Blues | 54 | 4 | 5 | 9 | +16 | 44 | 52 | 7.7 | 15:03 | |||||||||
| 2014-15 | NHL | Pittsburgh Penguins | 20 | 1 | 7 | 8 | -2 | 7 | 31 | 3.2 | 18:29 | 5 | 2 | 2 | 8 | 9 | 0.0 | 23:00 | ||
| 2015-16 | NHL | Pittsburgh Penguins | 70 | 0 | 12 | 12 | -3 | 59 | 72 | 0.0 | 17:14 | 24 | 1 | 2 | 3 | +6 | 14 | 16 | 6.2 | 16:13 |
| 2016-17 | NHL | Pittsburgh Penguins | 81 | 5 | 21 | 26 | +26 | 72 | 89 | 5.6 | 19:49 | 25 | 9 | 9 | +2 | 22 | 23 | 0.0 | 18:50 | |
| 2017-18 | NHL | Pittsburgh Penguins | 47 | 3 | 10 | 13 | +3 | 52 | 63 | 4.8 | 17:37 | |||||||||
| 2017-18 | NHL | Columbus Blue Jackets | 20 | 2 | 5 | 7 | +11 | 24 | 21 | 9.5 | 18:08 | 6 | 3 | 3 | -1 | 2 | 10 | 0.0 | 19:23 | |
| 2018-19 | NHL | Colorado Avalanche | 71 | 2 | 13 | 15 | -1 | 115 | 82 | 2.4 | 19:45 | 12 | 5 | 5 | +6 | 16 | 11 | 0.0 | 18:59 | |
| 2019-20 | NHL | Colorado Avalanche | 65 | 4 | 22 | 26 | +21 | 36 | 92 | 4.3 | 17:42 | 15 | 2 | 2 | +2 | 10 | 21 | 0.0 | 17:50 | |
| 2020-21 | NHL | Colorado Avalanche | 2 | 0 | 0 | 0 | 2 | 0.0 | 14:41 | |||||||||||
| 2020-21 | NHL | Minnesota Wild | 52 | 1 | 7 | 8 | +21 | 32 | 28 | 3.6 | 15:55 | 7 | -1 | 6 | 7 | 0.0 | 16:13 | |||
| 2021-22 | NHL | Carolina Hurricanes | 75 | 2 | 17 | 19 | +15 | 83 | 77 | 2.6 | 17:09 | 14 | 1 | 1 | 2 | +2 | 10 | 9 | 11.1 | 14:38 |
| 2022-23 | NHL | Tampa Bay Lightning | 78 | 3 | 14 | 17 | +13 | 61 | 109 | 2.8 | 19:23 | 6 | 1 | 2 | 3 | -2 | 4 | 1 | 100.0 | 18:48 |
| 2023-24 | NHL | Vancouver Canucks | 78 | 2 | 9 | 11 | +10 | 61 | 61 | 3.3 | 18:41 | 13 | 2 | 2 | -3 | 6 | 4 | 0.0 | 16:49 | |
| 2024-25 | NHL | Utah Hockey Club | 82 | 1 | 16 | 17 | -2 | 77 | 66 | 1.5 | 20:17 | |||||||||
| 2025-26 | NHL | Utah Mammoth | 82 | 3 | 20 | 23 | +16 | 50 | 62 | 4.8 | 18:16 | 6 | 1 | 1 | 2 | -2 | 4 | 5 | 20.0 | 18:49 |
| NHL Career | 990 | 38 | 195 | 233 | +168 | 871 | 1002 | 3.8 | 18:02 | 135 | 4 | 29 | 33 | +8 | 102 | 117 | 3.4 | 17:33 | ||