
Gustav Nyquist
| Position | Left Wing / Right Wing | Current Team | |
| Shoots | Left | Current Contract | |
| Height | 5'11" | Expires | |
| Weight (lbs) | 180 | Expiry Age (Jun 30) | |
| Age (DOB) | 36 (Sep 1, 1989) | Expiry Status | |
| Drafted | 2008, Round 4, Overall 121 (DET) |
| Date | Team | Transaction | |
|---|---|---|---|
| Nov 13, 2025 | Winnipeg Jets | Activated from IR | |
| Nov 4, 2025 | Winnipeg Jets | Placed on IR | |
| Jul 2, 2025 | Winnipeg Jets | Signed 1 year @ $3.250M AAV starting in 2025-26 | |
| Mar 1, 2025 | Minnesota Wild | Acquired from Nashville Predators | |
| Mar 1, 2025 | Nashville Predators | Traded to Minnesota Wild | |
| Jul 1, 2023 | Nashville Predators | Signed 2 years @ $3.185M AAV starting in 2023-24 | |
| Jul 1, 2019 | Columbus Blue Jackets | Signed 4 years @ $5.500M AAV starting in 2019-20 | |
| Jul 10, 2015 | Detroit Red Wings | Signed 4 years @ $4.750M AAV starting in 2015-16 | |
| Aug 21, 2013 | Detroit Red Wings | Signed 2 years @ $950K AAV starting in 2013-14 | |
| Mar 25, 2011 | Detroit Red Wings | Signed to an entry level contract. |
Player Card(s)
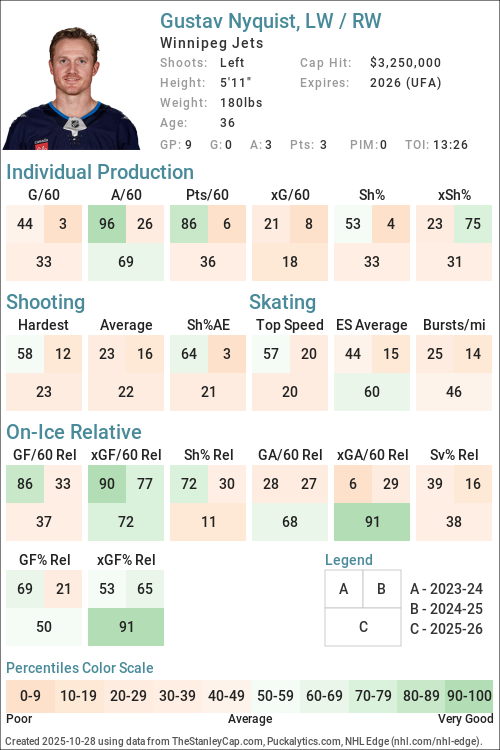
URL: https://thestanleycap.com/cdn/player_cards/20252026/gustav-nyquist-8474679.png
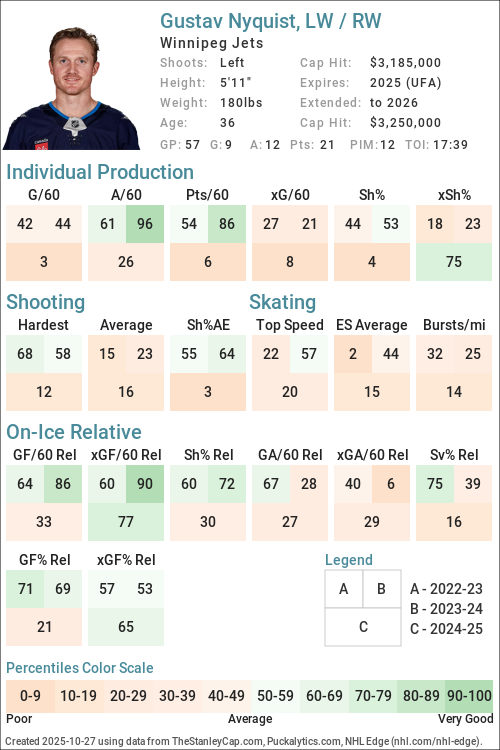
URL: https://thestanleycap.com/cdn/player_cards/20242025/gustav-nyquist-8474679.png
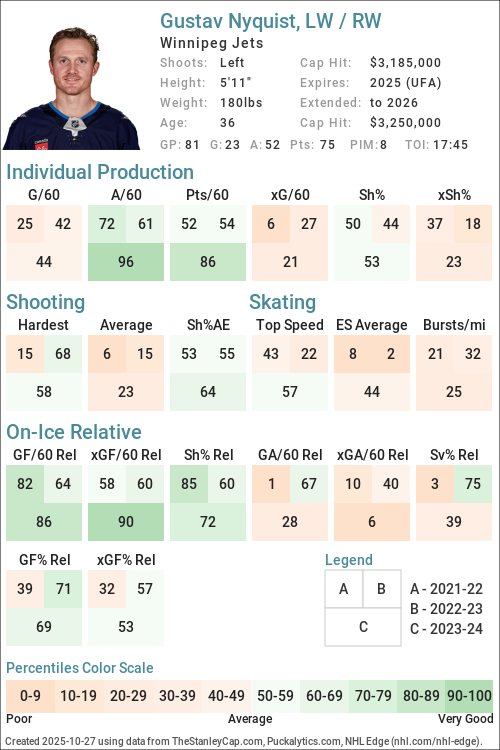
URL: https://thestanleycap.com/cdn/player_cards/20232024/gustav-nyquist-8474679.png
About Player Cards
Player cards present an infographic of a players performance using a series of Player Archetypes developed for Puckalytics.com and TheStanleyCap.com. The boxes in the rink image show the archetype ratings for the season specified in the card while the graphs to the right show the five-year trends for those archetypes.
Except for Faceoffs, the values shown are the players z-score (standard deviation from the mean) for the specific metric used to calculate the archetype values. When calculating z-scores forwards were compared to forwards and defensemen were compared to defensemen. Positive values indicate the player is above average and shaded in blue, while negative values indicate the player is below average and shaded in pink. The five year trend charts show a range of -4.0 to 4.0.
The value shown for Faceoffs is the faceoff winning percentage rather than their z-score with winning percentages below 50 in pink shades and above 50 in blue shades.
All archetypes are 5v5 except 5v4 TOI, 4v5 TOI, Skating (even strength) and Faceoffs (all situations). Archetypes use regular season data only.
Archetypes Summary
- Sniper - Measures the to score above the expected goal rate.
- Rebound - Measures the percent of a players shot attempts that come from rebounds (forwards only).
- 5v4 TOI - Powerplay ice time, calculated as the percentage of his teams 5v4 ice time that the player was on the ice for.
- Shooter - Measures whether a players points come from shots (goals or assists on rebounds from his shots).
- Producer - Measures a players ability to produce goals and assists, adjusted for quality of teammates.
- Playmaker - Measures whether a players points come from passes.
- Drive - Measures a players ability to drive puck possession and generate shot attempts for his team.
- Rush - Measures the percent of a players shot attempts that come from rush plays
- Possession - An indicator of a players ability to improve his teams puck possession game.
- Faceoffs - Faceoff Winning Percentage (min. 75 faceoffs taken).
- 5v5 TOI - The percentage of his teams 5v5 TOI that the player was on the ice for.
- Suppress - Measures a players ability to suppress opponent puck possession and shot attempts against.
- Skating - An indicator of a players skating ability, or speed bursts above 20mph per mile skated.
- Defend - An indicator of a players ability to suppress shot quality against.
- 4v5 TOI - Penalty Kill ice time, calculated as the percentage of his teams 4v5 ice time that the player was on the ice for.
Data Sources
- Salary data is from TheStanleyCap.com
- Skating data is from NHL Edge
- Other statistics are from Puckalytics.com and derived from data from NHL.com
Terms of Use
You are free to use include player cards in written articles, share on social media, or on other public websites under the following conditions:
- You credit TheStanleyCap.com as the source and provide a link back to TheStanleyCap.com or this player page.
- You do not mass copy/duplicate/publish dozens or hundreds of player cards. A few, or a handful for a written article is fine. Be reasonable. Fair use rules apply.
- If you are a high-traffic website you must download and host the image(s) on your site rather than overload TheStanleyCap servers with traffic.
Note: Player cards will update daily throughout the season so if you want to include snapshot then you must download the image.
If you have any questions, send an e-mail to the e-mail address at the top of this page.
Read Introducing Player Archetypes on HockeyAnalysis.com for more details on archetype calculations.
Core Archetypes
| Season | Team(s) | GP | TOI | Producer | Playmaker | Shooter | Sniper | Rebound | Rush | Skating | Defend |
|---|---|---|---|---|---|---|---|---|---|---|---|
| 2015-16 | DET | 82 | 0.62 | 0.93 | -0.31 | -0.04 | -0.58 | 0.91 | - | -0.74 | |
| 2016-17 | DET | 76 | 1.21 | 1.88 | -0.43 | -0.45 | -0.20 | -0.55 | - | 0.43 | |
| 2017-18 | DET | 82 | 0.08 | -0.98 | 1.46 | 0.20 | -1.06 | 1.27 | - | 1.00 | |
| 2018-19 | DET, SJS | 81 | 0.74 | 0.87 | -0.05 | 0.27 | -0.64 | -0.64 | - | -1.00 | |
| 2019-20 | CBJ | 70 | -0.25 | 1.53 | -1.26 | -1.05 | -0.71 | 1.24 | - | -0.14 | |
| 2021-22 | CBJ | 82 | -0.55 | 0.24 | -0.99 | 0.08 | -0.74 | -0.75 | -0.76 | -1.82 | |
| 2022-23 | CBJ, MIN | 51 | 0.23 | 0.40 | -0.26 | -0.30 | -0.99 | -0.35 | -0.59 | 0.73 | |
| 2023-24 | NSH | 81 | 1.00 | 1.26 | -0.17 | 0.35 | 1.00 | -0.19 | -0.68 | -0.24 | |
| 2024-25 | MIN, NSH | 79 | -1.38 | -0.31 | -1.40 | -1.72 | -0.72 | -1.00 | -0.99 | -0.90 | |
| 2025-26 | WPG | 51 | -1.18 | 0.30 | -1.42 | -1.78 | -0.05 | -0.67 | -0.74 | 0.92 |
Situational and Secondary Archetypes
| Season | Team(s) | GP | TOI | 5v5 TOI | 5v4 TOI | 4v5 TOI | Possession | Drive | Suppress | Faceoffs |
|---|---|---|---|---|---|---|---|---|---|---|
| 2015-16 | DET | 82 | -0.15 | 0.74 | -1.97 | 1.00 | 0.31 | 1.45 | - | |
| 2016-17 | DET | 76 | 0.85 | 0.94 | -2.01 | 0.38 | 0.69 | -0.40 | - | |
| 2017-18 | DET | 82 | 1.32 | 0.71 | -2.02 | 0.63 | 0.27 | 0.69 | - | |
| 2018-19 | DET, SJS | 81 | 1.14 | 0.34 | -1.96 | 1.31 | 1.54 | -0.07 | - | |
| 2019-20 | CBJ | 70 | 0.66 | 0.76 | -0.80 | -0.39 | 0.24 | -1.10 | - | |
| 2021-22 | CBJ | 82 | 0.56 | -0.06 | 0.80 | -0.43 | 0.12 | -1.21 | - | |
| 2022-23 | CBJ, MIN | 51 | 0.53 | -0.08 | 0.50 | 0.25 | 0.64 | -0.71 | - | |
| 2023-24 | NSH | 81 | 0.56 | 0.79 | -1.09 | 0.25 | 1.17 | -1.35 | - | |
| 2024-25 | MIN, NSH | 79 | 0.27 | -0.25 | 0.04 | 0.41 | 0.52 | -0.09 | - | |
| 2025-26 | WPG | 51 | -1.30 | -0.20 | -1.20 | -0.50 | 0.08 | -0.94 | - |
5v5 Individual Stats
| Season | Team(s) | GP | TOI | G/60 | A/60 | Pts/60 | xG/60 | GAE/60 | Sh% | xSh% | Sh%AE | %SA Rush | %SA Reb. |
|---|---|---|---|---|---|---|---|---|---|---|---|---|---|
| 2015-16 | DET | 82 | 933:17 | 0.51 | 1.22 | 1.74 | 0.55 | -0.04 | 7.48 | 8.00 | -0.53 | 5.84 | 3.65 |
| 2016-17 | DET | 76 | 1042:51 | 0.58 | 1.55 | 2.13 | 0.70 | -0.13 | 7.81 | 9.51 | -1.70 | 2.89 | 4.62 |
| 2017-18 | DET | 82 | 1198:44 | 0.90 | 0.70 | 1.60 | 0.84 | 0.06 | 10.29 | 9.64 | 0.65 | 6.49 | 2.60 |
| 2018-19 | SJS | 19 | 241:59 | 0.99 | 1.24 | 2.23 | 0.88 | 0.11 | 12.90 | 11.48 | 1.43 | 2.04 | 2.04 |
| 2018-19 | DET | 62 | 913:55 | 0.79 | 1.31 | 2.10 | 0.74 | 0.05 | 9.52 | 8.94 | 0.59 | 3.03 | 4.24 |
| 2018-19 | DET, SJS | 81 | 1155:54 | 0.83 | 1.30 | 2.13 | 0.77 | 0.06 | 10.19 | 9.44 | 0.75 | 2.80 | 3.74 |
| 2019-20 | CBJ | 70 | 935:11 | 0.26 | 1.22 | 1.48 | 0.50 | -0.24 | 4.12 | 8.03 | -3.90 | 6.50 | 4.06 |
| 2021-22 | CBJ | 82 | 1087:22 | 0.50 | 1.16 | 1.66 | 0.49 | 0.01 | 10.11 | 9.90 | 0.21 | 2.54 | 4.24 |
| 2022-23 | MIN | 3 | 38:35 | 0.00 | 4.67 | 4.67 | 0.60 | -0.60 | 0.00 | 12.85 | -12.85 | 0.00 | 0.00 |
| 2022-23 | CBJ | 48 | 629:54 | 0.67 | 0.86 | 1.52 | 0.75 | -0.08 | 9.86 | 11.03 | -1.17 | 3.30 | 4.40 |
| 2022-23 | CBJ, MIN | 51 | 668:29 | 0.63 | 1.08 | 1.71 | 0.74 | -0.11 | 9.46 | 11.10 | -1.65 | 3.09 | 4.12 |
| 2023-24 | NSH | 81 | 1045:28 | 0.63 | 1.61 | 2.24 | 0.54 | 0.09 | 10.28 | 8.87 | 1.41 | 3.47 | 11.11 |
| 2024-25 | MIN | 22 | 256:40 | 0.00 | 0.70 | 0.70 | 0.55 | -0.55 | 0.00 | 9.80 | -9.80 | 0.00 | 4.88 |
| 2024-25 | NSH | 57 | 756:35 | 0.24 | 0.63 | 0.87 | 0.40 | -0.16 | 6.98 | 11.73 | -4.75 | 1.41 | 5.63 |
| 2024-25 | MIN, NSH | 79 | 1013:15 | 0.18 | 0.65 | 0.83 | 0.44 | -0.26 | 4.48 | 11.04 | -6.56 | 0.89 | 5.36 |
| 2025-26 | WPG | 51 | 508:35 | 0.12 | 0.71 | 0.83 | 0.56 | -0.44 | 2.13 | 10.15 | -8.02 | 1.59 | 7.94 |
5v5 On Ice Stats
| Season | Team(s) | GP | TOI | SAF/60 | GF/60 | xGF/60 | SAA/60 | GA/60 | xGA/60 | GF% | xGF% | xGF Rel | xGA Rel | xGF% Rel |
|---|---|---|---|---|---|---|---|---|---|---|---|---|---|---|
| 2015-16 | DET | 82 | 933:17 | 41.02 | 2.44 | 2.33 | 36.45 | 2.31 | 2.08 | 51.35 | 52.84 | 0.07 | -0.23 | 3.43 |
| 2016-17 | DET | 76 | 1042:51 | 40.79 | 2.99 | 2.44 | 42.35 | 2.42 | 2.32 | 55.32 | 51.33 | 0.45 | 0.08 | 4.22 |
| 2017-18 | DET | 82 | 1198:44 | 41.99 | 2.30 | 2.46 | 40.74 | 2.05 | 2.11 | 52.87 | 53.87 | 0.28 | -0.37 | 6.98 |
| 2018-19 | SJS | 19 | 241:59 | 45.87 | 3.72 | 2.88 | 37.44 | 3.47 | 2.26 | 51.72 | 56.04 | 0.37 | -0.16 | 5.12 |
| 2018-19 | DET | 62 | 913:55 | 45.23 | 2.95 | 2.85 | 43.86 | 2.82 | 2.63 | 51.14 | 51.93 | 0.70 | -0.11 | 8.07 |
| 2018-19 | DET, SJS | 81 | 1155:54 | 45.37 | 3.11 | 2.85 | 42.51 | 2.96 | 2.56 | 51.28 | 52.75 | 0.62 | -0.11 | 7.16 |
| 2019-20 | CBJ | 70 | 935:11 | 42.60 | 2.25 | 2.39 | 42.79 | 2.25 | 2.33 | 50.00 | 50.62 | 0.08 | 0.19 | -1.30 |
| 2021-22 | CBJ | 82 | 1087:22 | 41.11 | 3.20 | 2.46 | 49.33 | 4.14 | 3.27 | 43.61 | 42.95 | 0.08 | 0.30 | -1.61 |
| 2022-23 | MIN | 3 | 38:35 | 34.21 | 4.67 | 1.71 | 41.99 | 3.11 | 3.26 | 60.00 | 34.41 | -0.54 | -0.26 | -4.56 |
| 2022-23 | CBJ | 48 | 629:54 | 40.86 | 2.19 | 2.63 | 49.06 | 3.05 | 3.04 | 41.82 | 46.37 | 0.27 | 0.14 | 1.58 |
| 2022-23 | CBJ, MIN | 51 | 668:29 | 40.48 | 2.33 | 2.58 | 48.65 | 3.05 | 3.06 | 43.33 | 45.76 | 0.23 | 0.11 | 1.36 |
| 2023-24 | NSH | 81 | 1045:28 | 49.07 | 3.21 | 2.99 | 44.82 | 2.64 | 2.72 | 54.90 | 52.37 | 0.51 | 0.42 | 0.44 |
| 2024-25 | MIN | 22 | 256:40 | 39.97 | 0.94 | 1.87 | 41.61 | 2.34 | 2.01 | 28.57 | 48.26 | -0.32 | -0.18 | -1.73 |
| 2024-25 | NSH | 57 | 756:35 | 44.33 | 1.74 | 2.72 | 41.16 | 2.93 | 2.56 | 37.29 | 51.43 | 0.36 | 0.14 | 2.11 |
| 2024-25 | MIN, NSH | 79 | 1013:15 | 43.23 | 1.54 | 2.50 | 41.27 | 2.78 | 2.42 | 35.62 | 50.79 | 0.20 | 0.07 | 1.28 |
| 2025-26 | WPG | 51 | 508:35 | 37.99 | 1.30 | 2.11 | 42.59 | 2.24 | 2.76 | 36.67 | 43.36 | -0.19 | 0.35 | -5.57 |
NHL Edge Stats
| Skating | Shooting | Zone Time | |||||||||||
|---|---|---|---|---|---|---|---|---|---|---|---|---|---|
| Season | GP | Top Speed | Bursts>20/mi | Avg. Speed | Top Speed | Avg. Speed | %Long Range | %Mid Range | %High Danger | ES DZ% | ES NZ% | ES OZ% | |
| This table is for Basic and Premium subscribers only. To view please login to and/or subscribe to one of our subscription plans. | |||||||||||||
Legend
| Percentile 0-25 | Percentile 25-50 | Percentile 50-75 | Percentile 75-100 |
5v5 Lines
| Season | Teammate | Teammate | Team | TOI | GF/60 | GA/60 | GF% | xGF/60 | xGA/60 | xGF% | xGF Rel | xGA Rel | xGF% Rel |
|---|
Glossary
| Type | Statistic | Definition |
|---|---|---|
| Individual | G/60 | Goals Against per 60 minutes. |
| Individual | A/60 | Assists per 60 minutes. |
| Individual | Pts/60 | Points per 60 minutes. |
| Individual | xG/60 | Expected Goals per 60 minutes. |
| Individual | GAE/60 | Goals Above Expected (G/60 - xG/60). |
| Individual | Sh% | Shooting Percentage. |
| Individual | xSh% | Expected Shooting Percentage. |
| Individual | Sh%AE | Shooting percentage above expected (Sh% - xSh%). |
| Individual | %SA Rush | Percentage of shot attempts determined to be on the rush. |
| Individual | %SA Reb. | Percentage of shot attempts determined to be from rebounds. |
| On Ice | SAF/60 | Shot Attempts For per 60 minutes. |
| On Ice | GF/60 | Goals For per 60 minutes. |
| On Ice | xGF/60 | Expected Goals For per 60 minutes. |
| On Ice | SAA/60 | Shot Attempts Against per 60 minutes (lower is better). |
| On Ice | GA/60 | Goals Against per 60 minutes (lower is better). |
| On Ice | xGA/60 | Expected Goals Against per 60 minutes (lower is better). |
| On Ice | GF% | Goals For Percentage = Goals For / (Goals For + Goals Against) |
| On Ice | xGF% | Expected Goals For Percentage = Expected Goals For / (Expected Goals For + Expected Goals Against) |
| On Ice | xGF Rel | xGF/60 when On Ice - xGF/60 when not On Ice. |
| On Ice | xGA Rel | xGA/60 when On Ice - xGA/60 when not On Ice (lower is better). |
| On Ice | xGF% Rel | xGF% when On Ice - xGF% when not On Ice. |
News and Opinions
-
Jets’ Veteran Free-Agent Additions Have Been Busts at The Hockey Writers (Thu Dec 18, 2025)
-
Gustav Nyquist set to return to lineup against Boston at Jets Nation (Thu Dec 11, 2025)
-
Jets’ Samberg, Nyquist set to return tonight vs. Kraken at Jets Nation (Thu Nov 13, 2025)
-
Winnipeg Jets head coach Scott Arniel says Gustav Nyquist remains day-to-day at Illegal Curve Hockey (Mon Nov 3, 2025)
-
Jets Nyquist Out Day-to-Day With Undisclosed Injury at The Hockey Writers (Fri Oct 31, 2025)
-
Winnipeg Jets head coach Scott Arniel said no timeline on Gustav Nyquist but he won’t play vs Pens at Illegal Curve Hockey (Fri Oct 31, 2025)
-
Day 2 of Winnipeg Jets training camp: Gustav Nyquist at Illegal Curve Hockey (Fri Sep 19, 2025)
-
Goals and expectations for the veteran Swedish winger Gustav Nyquist at Jets Nation (Thu Aug 7, 2025)
-
DAB Trade Profile: Gustav Nyquist, Offense-First Depth Winger at Devils Army (Mon Feb 6, 2023)
-
Free Agent Profile: Gustav Nyquist at Devils Army (Mon Jun 3, 2019)
Current Contract
Player does not currently have a contract.Gustav Nyquist signed a $3,250,000 1-year contract with the Winnipeg Jets and General Manager Kevin Cheveldayoff on July 2, 2025 with an AAV of $3,250,000. This contract will start in 2025-26 and end after the 2025-26 season. In the first season of the contract the cap hit was equivalent to 3.40% of the salary cap.
Standard Contract (UFA) ( ) (0 ratings)
| Season | Age* | Clause | Cap Hit | AAV | Perf. Bonus | Sign. Bonus | Salary | Compensation | Minors Salary | Status | |
|---|---|---|---|---|---|---|---|---|---|---|---|
| 2025-26 | 36 | $3,250,000 | $3,250,000 | - | - | $3,250,000 | $3,250,000 | $3,250,000 | UFA | ||
| Total | - | - | $3,250,000 | $3,250,000 | $3,250,000 |
Gustav Nyquist signed a $6,370,000 2-year contract with the Nashville Predators and General Manager Barry Trotz on July 1, 2023 with an AAV of $3,185,000. This contract will start in 2023-24 and end after the 2024-25 season. In the first season of the contract the cap hit was equivalent to 3.81% of the salary cap.
Standard Contract (UFA) ( ) (0 ratings)
| Season | Age* | Clause | Cap Hit | AAV | Perf. Bonus | Sign. Bonus | Salary | Compensation | Minors Salary | Status | |
|---|---|---|---|---|---|---|---|---|---|---|---|
| 2023-24 | 34 | $3,185,000 | $3,185,000 | - | - | $3,185,000 | $3,185,000 | $3,185,000 | UFA | ||
| 2024-25 | 35 | $3,185,000 | $3,185,000 | - | - | $3,185,000 | $3,185,000 | $3,185,000 | UFA | ||
| Total | - | - | $6,370,000 | $6,370,000 | $6,370,000 |
Gustav Nyquist signed a $22,000,000 4-year contract with the Columbus Blue Jackets and General Manager Jarmo Kekalainen on July 1, 2019 with an AAV of $5,500,000. This contract will start in 2019-20 and end after the 2022-23 season. In the first season of the contract the cap hit was equivalent to 6.75% of the salary cap.
Standard Contract (RFA) ( ) (0 ratings)
| Season | Age* | Clause | Cap Hit | AAV | Perf. Bonus | Sign. Bonus | Salary | Compensation | Minors Salary | Status | |
|---|---|---|---|---|---|---|---|---|---|---|---|
| 2019-20 | 30 | $5,500,000 | $5,500,000 | - | - | $6,000,000 | $6,000,000 | $6,000,000 | UFA | ||
| 2020-21 | 31 | $5,500,000 | $5,500,000 | - | - | $5,000,000 | $5,000,000 | $5,000,000 | UFA | ||
| 2021-22 | 32 | $5,500,000 | $5,500,000 | - | - | $6,000,000 | $6,000,000 | $6,000,000 | UFA | ||
| 2022-23 | 33 | $5,500,000 | $5,500,000 | - | - | $5,000,000 | $5,000,000 | $5,000,000 | UFA | ||
| Total | - | - | $22,000,000 | $22,000,000 | $22,000,000 |
Gustav Nyquist signed a $19,000,000 4-year contract with the Detroit Red Wings and General Manager Ken Holland on July 10, 2015 with an AAV of $4,750,000. This contract will start in 2015-16 and end after the 2018-19 season. In the first season of the contract the cap hit was equivalent to 6.65% of the salary cap.
Standard Contract (RFA) ( ) (0 ratings)
| Season | Age* | Clause | Cap Hit | AAV | Perf. Bonus | Sign. Bonus | Salary | Compensation | Minors Salary | Status | |
|---|---|---|---|---|---|---|---|---|---|---|---|
| 2015-16 | 26 | $4,750,000 | $4,750,000 | - | $1,000,000 | $3,000,000 | $4,000,000 | $4,000,000 | RFA-arb | ||
| 2016-17 | 27 | $4,750,000 | $4,750,000 | - | - | $4,250,000 | $4,250,000 | $4,250,000 | RFA-arb | ||
| 2017-18 | 28 | NTC | $4,750,000 | $4,750,000 | - | - | $5,250,000 | $5,250,000 | $5,250,000 | UFA | |
| 2018-19 | 29 | NTC | $4,750,000 | $4,750,000 | - | - | $5,500,000 | $5,500,000 | $5,500,000 | UFA | |
| Total | - | $1,000,000 | $18,000,000 | $19,000,000 | $19,000,000 |
Gustav Nyquist signed a $1,900,000 2-year contract with the Detroit Red Wings and General Manager Ken Holland on August 21, 2013 with an AAV of $950,000. This contract will start in 2013-14 and end after the 2014-15 season. In the first season of the contract the cap hit was equivalent to 1.48% of the salary cap.
Standard Contract (RFA) ( ) (0 ratings)
| Season | Age* | Clause | Cap Hit | AAV | Perf. Bonus | Sign. Bonus | Salary | Compensation | Minors Salary | Status | |
|---|---|---|---|---|---|---|---|---|---|---|---|
| 2013-14 | 24 | $950,000 | $950,000 | - | - | $850,000 | $850,000 | $850,000 | RFA-arb | ||
| 2014-15 | 25 | $950,000 | $950,000 | - | - | $1,050,000 | $1,050,000 | $1,050,000 | RFA-arb | ||
| Total | - | - | $1,900,000 | $1,900,000 | $1,900,000 |
Gustav Nyquist signed a $1,525,000 2-year contract with the Detroit Red Wings and General Manager Ken Holland on March 25, 2011 with an AAV of $762,500. This contract will start in 2011-12 and end after the 2012-13 season. In the first season of the contract the cap hit was equivalent to 1.19% of the salary cap.
Entry Level Contract ( ) (0 ratings)
| Season | Age* | Clause | Cap Hit | AAV | Perf. Bonus | Sign. Bonus | Salary | Compensation | Minors Salary | Status | |
|---|---|---|---|---|---|---|---|---|---|---|---|
| 2011-12 | 22 | $762,500 | $875,000 | $187,500 | $87,500 | $600,000 | $687,500 | $65,000 | ELC | ||
| 2012-13 | 23 | $762,500 | $875,000 | $37,500 | $87,500 | $750,000 | $837,500 | $65,000 | ELC | ||
| Total | $225,000 | $175,000 | $1,350,000 | $1,525,000 | $130,000 |
Career Statistics
| Regular Season | Playoffs | |||||||||||||||||||
|---|---|---|---|---|---|---|---|---|---|---|---|---|---|---|---|---|---|---|---|---|
| Season | League | Team | GP | G | A | Pts | +/- | PIM | Shots | Sh% | TOI/G | GP | G | A | Pts | +/- | PIM | Shots | Sh% | TOI/G |
| 2004-05 | U16 SM | Malmö Redhawks U16 | 3 | 3 | 2 | 5 | ||||||||||||||
| 2005-06 | Swe-U18 | Malmo U18 | 14 | 9 | 3 | 12 | 10 | 6 | 1 | 3 | 4 | 0.0 | ||||||||
| 2006-07 | Swe-Jr. | Malmo Jr. | 42 | 21 | 23 | 44 | 57 | 4 | 2 | 2 | 4 | 6 | 0.0 | |||||||
| 2007-08 | Swe-Jr. | Malmo Jr. | 24 | 11 | 20 | 31 | 20 | 7 | 5 | 5 | 10 | 6 | 0.0 | |||||||
| 2008-09 | H-East | U. Of Maine | 38 | 13 | 19 | 32 | 28 | |||||||||||||
| 2009-10 | H-East | U. Of Maine | 39 | 19 | 42 | 61 | 20 | |||||||||||||
| 2010-11 | H-East | U. of Maine | 36 | 18 | 33 | 51 | 20 | |||||||||||||
| 2010-11 | AHL | Grand Rapids | 8 | 1 | 3 | 4 | +1 | 2 | 14 | 714.0 | ||||||||||
| 2011-12 | AHL | Grand Rapids | 56 | 22 | 36 | 58 | +7 | 18 | 152 | 1,447.0 | ||||||||||
| 2011-12 | NHL | Detroit Red Wings | 18 | 1 | 6 | 7 | +2 | 2 | 19 | 5.3 | 10:36 | 4 | +1 | 1 | 0.0 | 8:52 | ||||
| 2012-13 | NHL | Detroit Red Wings | 22 | 3 | 3 | 6 | 6 | 46 | 6.5 | 13:02 | 14 | 2 | 3 | 5 | +3 | 2 | 26 | 7.7 | 12:36 | |
| 2012-13 | AHL | Grand Rapids | 58 | 23 | 37 | 60 | +10 | 34 | 169 | 1,361.0 | 10 | 2 | 5 | 7 | -4 | 19 | 27 | 741.0 | ||
| 2013-14 | AHL | Grand Rapids | 15 | 7 | 14 | 21 | +6 | 6 | 36 | 1,940.0 | ||||||||||
| 2013-14 | WC-A | Sweden | 10 | 4 | 2 | 6 | +2 | 2 | 19 | |||||||||||
| 2013-14 | Olympics | Sweden | 6 | 0 | 0 | 0 | +1 | 2 | ||||||||||||
| 2013-14 | NHL | Detroit Red Wings | 57 | 28 | 20 | 48 | +16 | 10 | 153 | 18.3 | 16:51 | 5 | -1 | 13 | 0.0 | 15:23 | ||||
| 2014-15 | NHL | Detroit Red Wings | 82 | 27 | 27 | 54 | -11 | 26 | 195 | 13.8 | 16:39 | 7 | 1 | 1 | 2 | -2 | 2 | 15 | 6.7 | 15:39 |
| 2015-16 | WC-A | Sweden | 8 | 7 | 1 | 8 | -1 | 4 | 19 | |||||||||||
| 2015-16 | NHL | Detroit Red Wings | 82 | 17 | 26 | 43 | -2 | 34 | 161 | 10.6 | 15:10 | 5 | 1 | 1 | +2 | 6 | 11 | 9.1 | 16:51 | |
| 2016-17 | NHL | Detroit Red Wings | 76 | 12 | 36 | 48 | 18 | 165 | 7.3 | 17:26 | ||||||||||
| 2017-18 | NHL | Detroit Red Wings | 82 | 21 | 19 | 40 | -2 | 20 | 213 | 9.9 | 17:51 | |||||||||
| 2017-18 | WC | Sweden | 9 | 4 | 1 | 5 | +3 | 8 | ||||||||||||
| 2018-19 | NHL | Detroit Red Wings | 62 | 16 | 33 | 49 | 8 | 163 | 9.8 | 18:07 | ||||||||||
| 2018-19 | NHL | San Jose Sharks | 19 | 6 | 5 | 11 | +1 | 4 | 41 | 14.6 | 15:34 | 20 | 1 | 10 | 11 | +1 | 23 | 4.4 | 15:33 | |
| 2019-20 | NHL | Columbus Blue Jackets | 70 | 15 | 27 | 42 | +4 | 16 | 151 | 9.9 | 18:02 | 10 | 2 | 2 | 4 | 20 | 0.0 | 21:32 | ||
| 2021-22 | NHL | Columbus Blue Jackets | 82 | 18 | 35 | 53 | -12 | 26 | 122 | 14.8 | 17:50 | |||||||||
| 2022-23 | NHL | Columbus Blue Jackets | 48 | 10 | 12 | 22 | -11 | 16 | 97 | 10.3 | 17:48 | |||||||||
| 2022-23 | NHL | Minnesota Wild | 3 | 1 | 4 | 5 | +2 | 5 | 20.0 | 14:41 | 6 | 5 | 5 | +4 | 2 | 9 | 0.0 | 16:01 | ||
| 2023-24 | NHL | Nashville Predators | 81 | 23 | 52 | 75 | +7 | 8 | 153 | 15.0 | 17:45 | 6 | 1 | 3 | 4 | -3 | 2 | 5 | 20.0 | 20:05 |
| 2024-25 | NHL | Nashville Predators | 57 | 9 | 12 | 21 | -20 | 12 | 71 | 12.7 | 17:39 | |||||||||
| 2024-25 | 4 Nations | Sweden | 3 | 1 | 0 | 1 | 2 | 50.0 | 9:41 | |||||||||||
| 2024-25 | NHL | Minnesota Wild | 22 | 2 | 5 | 7 | -4 | 4 | 32 | 6.2 | 14:46 | 6 | 2 | 0.0 | 11:09 | |||||
| 2025-26 | NHL | Winnipeg Jets | 51 | 1 | 11 | 12 | -8 | 10 | 62 | 1.6 | 12:41 | |||||||||
| NHL Career | 914 | 210 | 333 | 543 | -38 | 220 | 1849 | 11.4 | 16:44 | 83 | 6 | 24 | 30 | +5 | 18 | 125 | 4.8 | 15:34 | ||