
 Erik Karlsson
| Position | Right Defense | Current Team | Pittsburgh Penguins |
| Shoots | Right | Current Contract | 8 years ($11.5M CapHit) |
| Height | 6'0" | Expires | 2026-27 |
| Weight (lbs) | 185 | Expiry Age (Jun 30) | 37 |
| Age (DOB) | 36 (May 31, 1990) | Expiry Status | UFA |
| Drafted | 2008, Round 1, Overall 15 (OTT) |
| Date | Team | Transaction | |
|---|---|---|---|
| Jun 17, 2019 | San Jose Sharks | Signed 8 years @ $11.500M AAV starting in 2019-20 | |
| Jun 19, 2012 | Ottawa Senators | Signed 7 years @ $6.500M AAV starting in 2012-13 | |
| May 7, 2009 | Ottawa Senators | Signed to an entry level contract. |
Player Card(s)
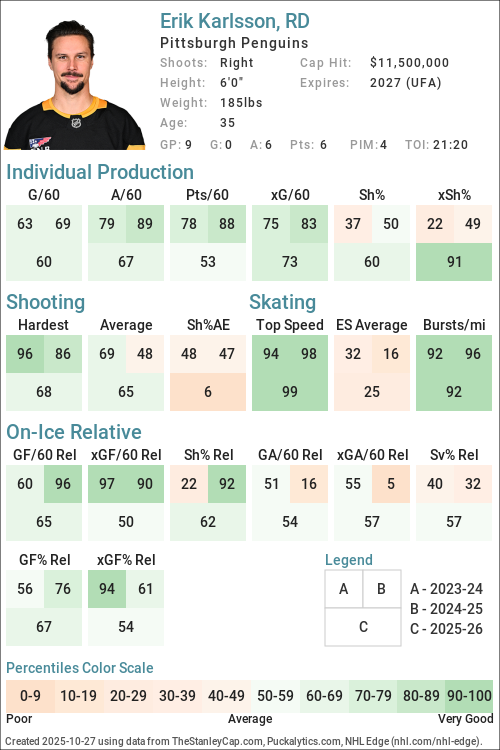
URL: https://thestanleycap.com/cdn/player_cards/20252026/erik-karlsson-8474578.png
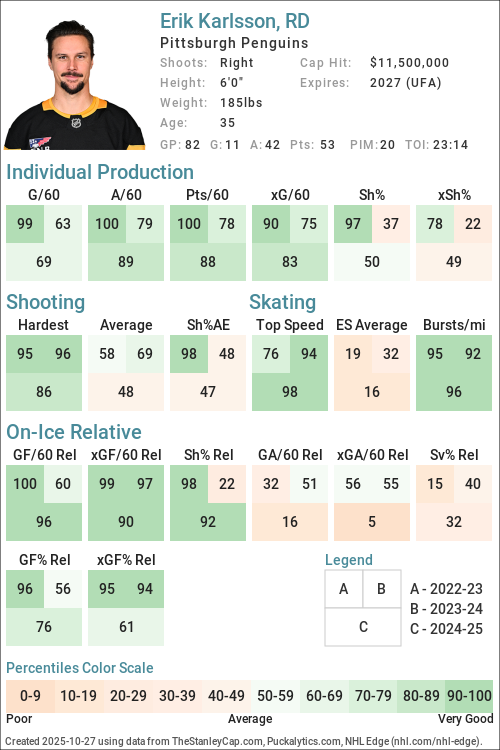
URL: https://thestanleycap.com/cdn/player_cards/20242025/erik-karlsson-8474578.png
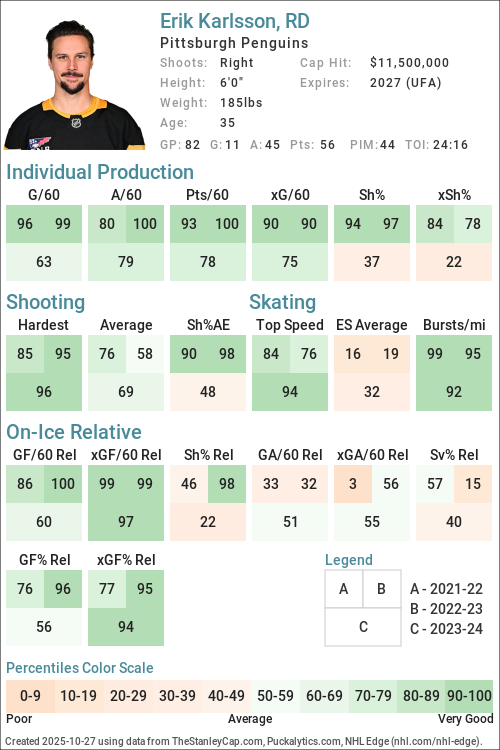
URL: https://thestanleycap.com/cdn/player_cards/20232024/erik-karlsson-8474578.png
About Player Cards
Player cards present an infographic of a players performance using a series of Player Archetypes developed for Puckalytics.com and TheStanleyCap.com. The boxes in the rink image show the archetype ratings for the season specified in the card while the graphs to the right show the five-year trends for those archetypes.
Except for Faceoffs, the values shown are the players z-score (standard deviation from the mean) for the specific metric used to calculate the archetype values. When calculating z-scores forwards were compared to forwards and defensemen were compared to defensemen. Positive values indicate the player is above average and shaded in blue, while negative values indicate the player is below average and shaded in pink. The five year trend charts show a range of -4.0 to 4.0.
The value shown for Faceoffs is the faceoff winning percentage rather than their z-score with winning percentages below 50 in pink shades and above 50 in blue shades.
All archetypes are 5v5 except 5v4 TOI, 4v5 TOI, Skating (even strength) and Faceoffs (all situations). Archetypes use regular season data only.
Archetypes Summary
- Sniper - Measures the to score above the expected goal rate.
- Rebound - Measures the percent of a players shot attempts that come from rebounds (forwards only).
- 5v4 TOI - Powerplay ice time, calculated as the percentage of his teams 5v4 ice time that the player was on the ice for.
- Shooter - Measures whether a players points come from shots (goals or assists on rebounds from his shots).
- Producer - Measures a players ability to produce goals and assists, adjusted for quality of teammates.
- Playmaker - Measures whether a players points come from passes.
- Drive - Measures a players ability to drive puck possession and generate shot attempts for his team.
- Rush - Measures the percent of a players shot attempts that come from rush plays
- Possession - An indicator of a players ability to improve his teams puck possession game.
- Faceoffs - Faceoff Winning Percentage (min. 75 faceoffs taken).
- 5v5 TOI - The percentage of his teams 5v5 TOI that the player was on the ice for.
- Suppress - Measures a players ability to suppress opponent puck possession and shot attempts against.
- Skating - An indicator of a players skating ability, or speed bursts above 20mph per mile skated.
- Defend - An indicator of a players ability to suppress shot quality against.
- 4v5 TOI - Penalty Kill ice time, calculated as the percentage of his teams 4v5 ice time that the player was on the ice for.
Data Sources
- Salary data is from TheStanleyCap.com
- Skating data is from NHL Edge
- Other statistics are from Puckalytics.com and derived from data from NHL.com
Terms of Use
You are free to use include player cards in written articles, share on social media, or on other public websites under the following conditions:
- You credit TheStanleyCap.com as the source and provide a link back to TheStanleyCap.com or this player page.
- You do not mass copy/duplicate/publish dozens or hundreds of player cards. A few, or a handful for a written article is fine. Be reasonable. Fair use rules apply.
- If you are a high-traffic website you must download and host the image(s) on your site rather than overload TheStanleyCap servers with traffic.
Note: Player cards will update daily throughout the season so if you want to include snapshot then you must download the image.
If you have any questions, send an e-mail to the e-mail address at the top of this page.
Read Introducing Player Archetypes on HockeyAnalysis.com for more details on archetype calculations.
Core Archetypes
| Season | Team(s) | GP | TOI | Producer | Playmaker | Shooter | Sniper | Rebound | Rush | Skating | Defend |
|---|---|---|---|---|---|---|---|---|---|---|---|
| 2015-16 | OTT | 82 | 4.12 | 3.08 | 2.96 | 1.48 | - | 0.64 | - | -2.65 | |
| 2016-17 | OTT | 77 | 3.41 | 1.23 | 3.64 | 1.54 | - | 0.22 | - | -0.19 | |
| 2017-18 | OTT | 71 | 3.56 | 4.35 | -0.04 | -0.53 | - | 1.05 | - | -2.42 | |
| 2018-19 | SJS | 53 | 1.89 | 3.06 | -0.69 | -1.17 | - | 0.41 | - | -0.55 | |
| 2019-20 | SJS | 56 | 3.08 | 3.20 | 0.64 | 0.52 | - | 0.73 | - | 0.23 | |
| 2020-21 | SJS | 52 | -0.60 | -0.59 | -0.32 | -0.42 | - | -0.07 | - | 0.07 | |
| 2021-22 | SJS | 50 | 2.41 | 0.88 | 3.49 | 1.29 | - | 1.49 | 3.35 | 0.34 | |
| 2022-23 | SJS | 82 | 6.02 | 5.39 | 3.60 | 2.22 | - | -0.89 | 2.06 | -0.92 | |
| 2023-24 | PIT | 82 | 0.44 | 0.57 | -0.12 | -0.21 | - | -0.65 | 1.53 | -0.22 | |
| 2024-25 | PIT | 82 | 1.09 | 0.85 | 0.40 | -0.17 | - | 0.03 | 2.41 | -0.43 | |
| 2025-26 | PIT | 75 | 1.52 | 0.87 | 1.52 | 0.89 | - | -0.70 | 2.18 | -0.30 |
Situational and Secondary Archetypes
| Season | Team(s) | GP | TOI | 5v5 TOI | 5v4 TOI | 4v5 TOI | Possession | Drive | Suppress | Faceoffs |
|---|---|---|---|---|---|---|---|---|---|---|
| 2015-16 | OTT | 82 | 2.72 | 2.70 | -0.62 | 2.23 | 1.87 | 1.48 | - | |
| 2016-17 | OTT | 77 | 1.93 | 1.88 | 0.34 | 1.05 | 1.48 | 0.03 | - | |
| 2017-18 | OTT | 71 | 2.30 | 1.52 | -0.41 | 1.68 | 1.43 | 1.12 | - | |
| 2018-19 | SJS | 53 | 1.05 | 1.41 | 0.16 | 2.14 | 2.56 | 0.70 | - | |
| 2019-20 | SJS | 56 | 0.89 | 1.46 | 0.49 | 1.40 | 1.31 | 0.64 | - | |
| 2020-21 | SJS | 52 | 1.09 | 1.13 | -0.97 | -0.44 | 0.51 | -1.17 | - | |
| 2021-22 | SJS | 50 | 0.69 | 1.15 | -0.24 | 1.46 | 2.90 | -1.15 | - | |
| 2022-23 | SJS | 82 | 2.04 | 1.73 | -1.76 | 2.32 | 2.47 | 0.95 | - | |
| 2023-24 | PIT | 82 | 1.76 | 1.35 | -2.00 | 1.30 | 1.71 | 0.21 | - | |
| 2024-25 | PIT | 82 | 1.16 | 0.82 | -1.02 | 0.34 | 1.41 | -1.16 | - | |
| 2025-26 | PIT | 75 | 0.29 | 1.57 | 0.19 | 1.12 | 1.14 | 0.58 | - |
5v5 Individual Stats
| Season | Team(s) | GP | TOI | G/60 | A/60 | Pts/60 | xG/60 | GAE/60 | Sh% | xSh% | Sh%AE | %SA Rush | %SA Reb. |
|---|---|---|---|---|---|---|---|---|---|---|---|---|---|
| 2015-16 | OTT | 82 | 1708:15 | 0.46 | 1.05 | 1.51 | 0.26 | 0.20 | 7.83 | 4.43 | 3.40 | 1.58 | 1.98 |
| 2016-17 | OTT | 77 | 1480:15 | 0.45 | 0.97 | 1.42 | 0.25 | 0.19 | 7.69 | 4.35 | 3.34 | 1.35 | 2.70 |
| 2017-18 | OTT | 71 | 1423:05 | 0.17 | 1.31 | 1.48 | 0.23 | -0.06 | 2.90 | 3.97 | -1.07 | 2.39 | 0.96 |
| 2018-19 | SJS | 53 | 950:08 | 0.06 | 1.39 | 1.45 | 0.28 | -0.22 | 0.80 | 3.56 | -2.76 | 1.60 | 0.53 |
| 2019-20 | SJS | 56 | 960:10 | 0.25 | 1.25 | 1.50 | 0.19 | 0.06 | 4.82 | 3.66 | 1.16 | 1.79 | 2.68 |
| 2020-21 | SJS | 52 | 930:13 | 0.19 | 0.45 | 0.64 | 0.25 | -0.06 | 3.95 | 5.11 | -1.16 | 0.89 | 2.68 |
| 2021-22 | SJS | 50 | 878:58 | 0.48 | 0.89 | 1.37 | 0.30 | 0.18 | 8.33 | 5.28 | 3.05 | 2.42 | 2.42 |
| 2022-23 | SJS | 82 | 1647:34 | 0.58 | 1.71 | 2.29 | 0.30 | 0.29 | 10.60 | 5.38 | 5.22 | 0.00 | 3.94 |
| 2023-24 | PIT | 82 | 1582:52 | 0.23 | 0.83 | 1.06 | 0.24 | -0.01 | 3.82 | 3.99 | -0.17 | 0.45 | 2.68 |
| 2024-25 | PIT | 82 | 1523:28 | 0.24 | 0.98 | 1.22 | 0.26 | -0.02 | 4.35 | 4.79 | -0.45 | 0.46 | 3.23 |
| 2025-26 | PIT | 75 | 1260:32 | 0.48 | 1.05 | 1.52 | 0.32 | 0.16 | 8.85 | 5.86 | 2.99 | 0.00 | 2.14 |
5v5 On Ice Stats
| Season | Team(s) | GP | TOI | SAF/60 | GF/60 | xGF/60 | SAA/60 | GA/60 | xGA/60 | GF% | xGF% | xGF Rel | xGA Rel | xGF% Rel |
|---|---|---|---|---|---|---|---|---|---|---|---|---|---|---|
| 2015-16 | OTT | 82 | 1708:15 | 41.38 | 2.60 | 2.22 | 40.78 | 2.70 | 2.30 | 49.01 | 49.18 | 0.37 | -0.03 | 4.94 |
| 2016-17 | OTT | 77 | 1480:15 | 42.97 | 2.43 | 2.28 | 42.11 | 2.19 | 2.20 | 52.63 | 50.88 | 0.40 | 0.03 | 4.46 |
| 2017-18 | OTT | 71 | 1423:05 | 43.68 | 2.53 | 2.18 | 42.92 | 3.42 | 2.37 | 42.55 | 47.84 | 0.21 | -0.16 | 4.11 |
| 2018-19 | SJS | 53 | 950:08 | 52.79 | 3.41 | 3.26 | 36.18 | 2.72 | 2.23 | 55.67 | 59.33 | 0.75 | -0.14 | 8.02 |
| 2019-20 | SJS | 56 | 960:10 | 42.81 | 2.56 | 2.61 | 38.06 | 2.69 | 2.54 | 48.81 | 50.70 | 0.34 | 0.13 | 2.16 |
| 2020-21 | SJS | 52 | 930:13 | 40.89 | 2.26 | 2.50 | 45.34 | 3.03 | 2.98 | 42.68 | 45.67 | 0.06 | 0.63 | -5.35 |
| 2021-22 | SJS | 50 | 878:58 | 45.74 | 2.53 | 2.79 | 44.58 | 2.53 | 2.72 | 50.00 | 50.65 | 0.66 | 0.33 | 3.50 |
| 2022-23 | SJS | 82 | 1647:34 | 46.03 | 3.46 | 3.07 | 41.48 | 3.42 | 2.80 | 50.26 | 52.26 | 0.66 | 0.04 | 5.78 |
| 2023-24 | PIT | 82 | 1582:52 | 48.97 | 2.73 | 3.02 | 43.52 | 2.62 | 2.56 | 51.06 | 54.11 | 0.54 | -0.06 | 5.54 |
| 2024-25 | PIT | 82 | 1523:28 | 45.02 | 2.91 | 2.75 | 44.54 | 3.15 | 2.83 | 48.05 | 49.25 | 0.47 | 0.44 | 0.52 |
| 2025-26 | PIT | 75 | 1260:32 | 44.36 | 3.47 | 2.91 | 39.03 | 2.52 | 2.63 | 57.94 | 52.59 | 0.19 | 0.08 | 0.92 |
NHL Edge Stats
| Skating | Shooting | Zone Time | |||||||||||
|---|---|---|---|---|---|---|---|---|---|---|---|---|---|
| Season | GP | Top Speed | Bursts>20/mi | Avg. Speed | Top Speed | Avg. Speed | %Long Range | %Mid Range | %High Danger | ES DZ% | ES NZ% | ES OZ% | |
| This table is for Basic and Premium subscribers only. To view please login to and/or subscribe to one of our subscription plans. | |||||||||||||
Legend
| Percentile 0-25 | Percentile 25-50 | Percentile 50-75 | Percentile 75-100 |
5v5 Defense Pairs
| Season | Teammate | Team | TOI | GF/60 | GA/60 | GF% | xGF/60 | xGA/60 | xGF% | xGF Rel | xGA Rel | xGF% Rel |
|---|
Glossary
| Type | Statistic | Definition |
|---|---|---|
| Individual | G/60 | Goals Against per 60 minutes. |
| Individual | A/60 | Assists per 60 minutes. |
| Individual | Pts/60 | Points per 60 minutes. |
| Individual | xG/60 | Expected Goals per 60 minutes. |
| Individual | GAE/60 | Goals Above Expected (G/60 - xG/60). |
| Individual | Sh% | Shooting Percentage. |
| Individual | xSh% | Expected Shooting Percentage. |
| Individual | Sh%AE | Shooting percentage above expected (Sh% - xSh%). |
| Individual | %SA Rush | Percentage of shot attempts determined to be on the rush. |
| Individual | %SA Reb. | Percentage of shot attempts determined to be from rebounds. |
| On Ice | SAF/60 | Shot Attempts For per 60 minutes. |
| On Ice | GF/60 | Goals For per 60 minutes. |
| On Ice | xGF/60 | Expected Goals For per 60 minutes. |
| On Ice | SAA/60 | Shot Attempts Against per 60 minutes (lower is better). |
| On Ice | GA/60 | Goals Against per 60 minutes (lower is better). |
| On Ice | xGA/60 | Expected Goals Against per 60 minutes (lower is better). |
| On Ice | GF% | Goals For Percentage = Goals For / (Goals For + Goals Against) |
| On Ice | xGF% | Expected Goals For Percentage = Expected Goals For / (Expected Goals For + Expected Goals Against) |
| On Ice | xGF Rel | xGF/60 when On Ice - xGF/60 when not On Ice. |
| On Ice | xGA Rel | xGA/60 when On Ice - xGA/60 when not On Ice (lower is better). |
| On Ice | xGF% Rel | xGF% when On Ice - xGF% when not On Ice. |
News and Opinions
-
Pittsburgh Penguins' 2026-27 Lineup Projections: Defensemen at Yahoo Sports NHL (Fri Jul 24, 2026)
-
Jason Robertson signs with Dallas, appears to end saga at Pens Burgh (Wed Jul 22, 2026)
-
Penguins’ 3 Trade Candidates Entering 2026-27 at The Hockey Writers (Wed Jul 15, 2026)
-
Penguins’ 3 Worst Contracts Entering 2026-27 at The Hockey Writers (Wed Jul 15, 2026)
-
Looking back at Kyle Dubas’ major trades since joining the Penguins at Pens Burgh (Wed Jul 8, 2026)
-
Looking back at Kyle Dubas’ major trades since joining the Penguins at Yahoo Sports NHL (Wed Jul 8, 2026)
-
Senators News & Rumours: Karlsson Reunion, McTavish, Robertson & DeBrusk at The Hockey Writers (Thu Jun 25, 2026)
-
NHL Rumor Mill – June 25, 2026 at Spectors Hockey (Thu Jun 25, 2026)
-
3 Under-The-Radar Penguins' Trade Candidates This Summer at Yahoo Sports NHL (Tue Jun 2, 2026)
-
2025-26 Season in Review: Erik Karlsson at Pens Burgh (Fri May 29, 2026)
-
Penguins Have an Erik Karlsson Decision to Make at The Hockey Writers (Thu May 28, 2026)
-
Revisiting What's Left In Ottawa From The Blockbuster 2018 Erik Karlsson Trade at Yahoo Sports NHL (Fri May 22, 2026)
-
Extend or shop: Examining Penguins players entering the final year of their contracts at Pens Burgh (Thu May 21, 2026)
-
Extend or shop: Examining Penguins players entering the final year of their contracts at Yahoo Sports NHL (Thu May 21, 2026)
-
Does Erik Karlsson Extension Make Sense For Penguins? at Yahoo Sports NHL (Wed May 20, 2026)
-
Penguins 2025-26 Player Grades: Expectations Exceeded By Many at The Hockey Writers (Tue May 12, 2026)
-
Penguins Team Awards for the 2025-26 Season at The Hockey Writers (Sat May 9, 2026)
-
Why Evan Bouchard deserved to be a Norris Trophy nominee at Oilers Nation (Thu May 7, 2026)
-
Flyers vs. Penguins: Previewing the defensive matchups in the Battle of Pennsylvania at Broad Street Hockey (Sat Apr 18, 2026)
-
Top-5 Moves That Shaped Penguins' Successful 2025-26 Season at Yahoo Sports NHL (Wed Apr 15, 2026)
-
A history of the Norris Trophy and a tight 2026 race at Oilers Nation (Tue Apr 14, 2026)
-
Takeaways: Malkin's Hat Trick, Milestones Lead Penguins' Offensive Explosion In 9-4 Over Panthers at Yahoo Sports NHL (Sat Apr 4, 2026)
-
Takeaways: Crucial Shorthanded Goal Leads Lightning To 6-2 Victory Over Penguins at Yahoo Sports NHL (Fri Apr 3, 2026)
-
'March Of The Penguins' Wasn't Perfect, But It Was More Than Enough To Prove This Team Isn't Going Away at Yahoo Sports NHL (Thu Apr 2, 2026)
-
Erik Karlsson Named NHL's Second Star Of The Month at Yahoo Sports NHL (Wed Apr 1, 2026)
-
Erik Karlsson’s Recent Brilliance Guiding Penguins Amid Playoff Push at The Hockey Writers (Wed Apr 1, 2026)
-
Takeaways: Penguins Stomp Islanders In Dominant Effort For Biggest Win Of The Season at Yahoo Sports NHL (Tue Mar 31, 2026)
-
Takeaways: Penalties Costly As Penguins Lose Key Game In Regulation To Dallas Stars at Yahoo Sports NHL (Sun Mar 29, 2026)
-
Is Erik Karlsson The Best Player In Hockey Right Now? He Just Might Be. at Yahoo Sports NHL (Sat Mar 28, 2026)
-
Takeaways: Several Penguins Step Up, Seize Two Points Against Ottawa Senators Despite Crosby Injury at Yahoo Sports NHL (Fri Mar 27, 2026)
-
Penguins/Senators Recap: Crosby injured in Pittsburgh shootout win at Yahoo Sports NHL (Thu Mar 26, 2026)
-
Penguins/Senators Recap: Crosby injured in Pittsburgh shootout win at Pens Burgh (Thu Mar 26, 2026)
-
NHL Rumor Roundup: Penguins Not Moving Erik Karlsson, Latest Red Wings Buzz at The Hockey News (Thu Mar 26, 2026)
-
Report: Penguins' GM Dubas Has No Plans To Trade Karlsson This Offseason at Yahoo Sports NHL (Wed Mar 25, 2026)
-
NHL Rumors: Goalie Trades, Karlsson Staying, Kucherov Controversy at The Hockey Writers (Wed Mar 25, 2026)
-
NHL Rumor Mill – March 25, 2026 at Spectors Hockey (Wed Mar 25, 2026)
-
Erik Karlsson Stepped Up In Crosby, Malkin's Absence; Continues To Drive Penguins Playoff Push at The Hockey News (Sun Mar 22, 2026)
-
Takeaways: Penguins Exorcise Shootout Demons, Beat Jets In Dramatic Fashion at Yahoo Sports NHL (Sat Mar 21, 2026)
-
Penguins/Jets Recap: It’s a…shootout win? Pens scrape to victory at Yahoo Sports NHL (Sat Mar 21, 2026)
-
Penguins/Jets Recap: It’s a…shootout win? Pens scrape to victory at Pens Burgh (Sat Mar 21, 2026)
-
Takeaways: Penguins Come Back Yet Again To Earn Point In Crosby's Return Game at Yahoo Sports NHL (Thu Mar 19, 2026)
-
Potential landings spots listed for superstar defenseman would be bad news for Bruins at Causway Crowd (Wed Mar 18, 2026)
-
Takeaways: Malkin Leads Pens To Statement 7-2 Win Over Avalanche In Return Game at Yahoo Sports NHL (Tue Mar 17, 2026)
-
Erik Karlsson is playing incredible hockey for the Penguins at Pens Burgh (Tue Mar 17, 2026)
-
Penguins Week Ahead: Schedule & Storylines- Karlsson Stepping Up, Battle for Playoff Spot & More at The Hockey Writers (Mon Mar 16, 2026)
-
Game Preview: Pittsburgh Penguins @ Colorado Avalanche 3/16/2026 at Yahoo Sports NHL (Mon Mar 16, 2026)
-
Game Preview: Pittsburgh Penguins @ Colorado Avalanche 3/16/2026 at Pens Burgh (Mon Mar 16, 2026)
-
NHL Player Props for Today, March 5: Fine German Engineering at Yahoo Sports NHL (Thu Mar 5, 2026)
-
Penguins Notebook: Erik Karlsson Returns To Practice, Avery Hayes On The Top Line at Yahoo Sports NHL (Tue Feb 24, 2026)
-
The week ahead: Big week for Penguins players at the Olympics at Pens Burgh (Mon Feb 16, 2026)
-
'I'm Just Going To Take It All In And Leave It All Out There': Rakell Eager To Represent Sweden At Olympics at Yahoo Sports NHL (Mon Jan 19, 2026)
-
Penguins Activate And Option McGroarty, Recall Forward Ahead Of Western Trip at Yahoo Sports NHL (Sun Jan 18, 2026)
-
Pens Points: Karlsson goes down at Pens Burgh (Wed Jan 14, 2026)
-
Erik Karlsson to IR, Ryan Graves and Tristan Broz recalled from AHL at Pens Burgh (Tue Jan 13, 2026)
-
Active NHLers Destined for the HHOF at The Hockey Writers (Fri Jan 9, 2026)
-
Takeaways: In Malkin's Return, Penguins Oust Devils To Earn Sixth Straight Win at Yahoo Sports NHL (Fri Jan 9, 2026)
-
Erik Karlsson’s Confidence Continues To Help Guide The Penguins at Yahoo Sports NHL (Tue Jan 6, 2026)
-
Takeaways: Penguins Roar Back From Three-Goal Deficit, Beat Blue Jackets In OT at Yahoo Sports NHL (Mon Jan 5, 2026)
-
Penguins Well Represented as Karlsson & Rakell Earn Olympic Selection for Team Sweden at The Hockey Writers (Sat Jan 3, 2026)
-
'It's A Dream Come True For Me': Rakell, Karlsson Thrilled To Represent Sweden At Olympic Games at Yahoo Sports NHL (Fri Jan 2, 2026)
-
Predicting the Team Sweden Roster for 2026 Milan Olympics at Blue Shirt Banter (Fri Dec 26, 2025)
-
Preview: Senators Host Sidney Crosby, Erik Karlsson, And The Pittsburgh Penguins Thursday at Yahoo Sports NHL (Thu Dec 18, 2025)
-
Revisiting Penguin predictions for 2025 at Pens Burgh (Wed Dec 17, 2025)
-
Takeaways: Penguins Drop Sixth Straight On Milestone Night For Oilers' Draisaitl at Yahoo Sports NHL (Wed Dec 17, 2025)
-
Karlsson Talks Plattner, Sharks’ Turnaround (+) at San Jose Hockey Now (Sat Dec 13, 2025)
-
Takeaways: Penguins Put Forth Dominant Effort In 5-1 Win Over Flyers at Yahoo Sports NHL (Tue Dec 2, 2025)
-
Takeaways: First Line Powers Penguins' Comeback OT Victory Over Blue Jackets at Yahoo Sports NHL (Sat Nov 29, 2025)
-
Penguins Defenseman Erik Karlsson Hits New Milestone On Friday at Yahoo Sports NHL (Sat Nov 29, 2025)
-
Erik Karlsson and Parker Wotherspoon have formed surprisingly strong top defense pairing at Pens Burgh (Fri Nov 28, 2025)
-
Penguins' Fast Start Has Erik Karlsson's Fingerprints All Over It at Yahoo Sports NHL (Wed Nov 12, 2025)
-
Penguins' Fast Start Has Erik Karlsson's Fingerprints All Over It at Yahoo Sports NHL (Wed Nov 12, 2025)
-
Thoughts on Thoughts: Muse, Karlsson, rookie contracts at Pens Burgh (Thu Nov 6, 2025)
-
Revisiting the Sharks’ Erik Karlsson Trade at The Hockey Writers (Wed Oct 15, 2025)
-
Around the NHL: Sharks owner calls out Erik Karlsson, Canucks’ Myers fined for slashing McDavid at The Leafs Nation (Mon Oct 13, 2025)
-
Le propriétaire des Sharks sur Erik Karlsson : « pas un joueur d’équipe » at HABSolument Fan (Sat Oct 11, 2025)
-
Building the Ottawa Senators All-Time NHL Draft Class at Silver Seven Sens (Sat Oct 11, 2025)
-
Erik Karlsson looks fantastic for Penguins at Pens Burgh (Fri Oct 10, 2025)
-
The Best NHL Players of All-Time, by Decade at The Hockey Writers (Tue Sep 30, 2025)
-
Ottawa Senators’ Best All-Time at The Hockey Writers (Thu Sep 25, 2025)
-
Erik Karlsson intéresserait une formation en particulier at HABSolument Fan (Sun Sep 14, 2025)
-
Recent bold trade predicts Sens legend Erik Karlsson will return to Atlantic Division at SenShot (Fri Sep 12, 2025)
-
Yet another Erik Karlsson rumor at The Malik Report (Fri Sep 12, 2025)
-
NHL Rumors: Jack Eichel, the Hughes’ Brothers, Erik Karlsson, and Pavel Zacha at NHL Rumors (Fri Sep 12, 2025)
-
Khan talks Erik Karlsson’s pluses and minuses at The Malik Report (Wed Sep 10, 2025)
-
Red Wings’ Alleged Interest in Former Norris Trophy Winner Refuses to Go Away at Yahoo Sports (Tue Sep 9, 2025)
-
Expectations for Penguins Defensemen in 2025-26 at The Hockey Writers (Tue Sep 9, 2025)
-
NHL Rumors: Toronto Maple Leafs, and the Pittsburgh Penguins at NHL Rumors (Tue Sep 9, 2025)
-
The Daily: Do Red Wings Need Erik Karlsson?; NJ Goalie Rising at Detroit Hockey Now (Tue Sep 9, 2025)
-
Erik Karlsson Trade Talks Could Hinge on Penguins Ownership Shakeup at Yahoo Sports (Fri Sep 5, 2025)
-
NHL Rumors: Erik Karlsson to the Maple Leafs? at NHL Rumors (Tue Sep 2, 2025)
-
Analyst proposes blockbuster trade sending Erik Karlsson to Carolina at Yahoo Sports (Sun Aug 31, 2025)
-
Analyst proposes blockbuster trade sending Erik Karlsson to Carolina at Yahoo Sports (Sun Aug 31, 2025)
-
The Pittsburgh Penguins' Top-Three Trade Candidates For The 2025-26 Season at Yahoo Sports (Sat Aug 30, 2025)
-
Karlsson, Rakell Eye Spots On Team Sweden For 2026 Winter Olympics at Yahoo Sports (Sat Aug 30, 2025)
-
Can Matt Dumba Have A Bounceback Year In 2025-26? at Yahoo Sports (Mon Aug 25, 2025)
-
Dan’s Daily: Karlsson Mock Trade; Penguins Ownership Heat at Yahoo Sports (Mon Aug 25, 2025)
-
Maple Leafs analyst would swap star defensemen with Penguins "all day" at Yahoo Sports (Fri Aug 22, 2025)
-
Maple Leafs analyst would swap star defensemen with Penguins "all day" at Yahoo Sports (Fri Aug 22, 2025)
-
Way-too-early Pittsburgh Penguins trade candidates in 2025-26 season at Yahoo Sports (Tue Aug 19, 2025)
-
Senators legend snubbed off NHL's Quarter Century Team at SenShot (Sat Aug 16, 2025)
-
Potential Erik Karlsson Suitor Signs Defenseman On Friday at Yahoo Sports (Sat Aug 16, 2025)
-
Potential Erik Karlsson Suitor Signs Defenseman On Friday at Yahoo Sports NHL (Sat Aug 16, 2025)
-
Five Thoughts for Friday: Post-Playoff Performances at Silver Seven Sens (Fri Aug 15, 2025)
-
What To Expect From Erik Karlsson This Season at Yahoo Sports (Thu Aug 14, 2025)
-
NHL Rumors: Does Erik Karlsson Make Sense for the Detroit Red Wings? at NHL Rumors (Sat Aug 9, 2025)
-
An Erik Karlsson trade with the Penguins is extremely unlikely, but ‘never say never’ at The Malik Report (Fri Aug 8, 2025)
-
Deen’s Daily: Two Years Since Karlsson Trade; Should Avs Start Season Without Necas Extension? at Colorado Hockey Now (Wed Aug 6, 2025)
-
3 San Jose Sharks That Fans Would Like to Forget About at The Hockey Writers (Wed Aug 6, 2025)
-
2 Year Anniversary, The Final Erik Karlsson-Penguins Trade Verdict at Yahoo Sports (Wed Aug 6, 2025)
-
The Hurricanes Have Reportedly Spent Time ‘Investigating’ The Possibility Of Trading For Erik Karlsson at Yahoo Sports (Tue Aug 5, 2025)
-
Red Wings might be one Erik Karlsson move from contending at Octopus Thrower (Tue Aug 5, 2025)
-
The Daily: Karlsson Salary Hurts His Desirability; Klima Back With Jagr at Detroit Hockey Now (Mon Aug 4, 2025)
-
NHL Rumors: Carter Hart and Erik Karlsson at NHL Rumors (Mon Aug 4, 2025)
-
1 move Pittsburgh Penguins should've made in 2025 NHL offseason at Yahoo Sports (Sun Aug 3, 2025)
-
The Daily: Karlsson-to-Detroit Talk Lives On; Vrana to Sweden at Detroit Hockey Now (Sun Aug 3, 2025)
-
Penguins' Erik Karlsson Trade Talks Reportedly Take New Turn at Yahoo Sports (Sun Aug 3, 2025)
-
Erik Karlsson Could Be the Red Wings’ Missing Piece at The Hockey Writers (Sat Aug 2, 2025)
-
Trading for Erik Karlsson is a tantalizing short-term move for the win-now Hurricanes at Cardiac Cane (Fri Aug 1, 2025)
-
Insider Connects Hurricanes to Penguins' Erik Karlsson But Sees One Problem at Yahoo Sports (Fri Aug 1, 2025)
-
Do The Carolina Hurricanes Make Sense For Erik Karlsson? at Yahoo Sports (Fri Aug 1, 2025)
-
Senators Predicted to Trade for Erik Karlsson at Yahoo Sports (Thu Jul 31, 2025)
-
Hurricanes linked to three-time Norris winner at Yahoo Sports (Thu Jul 31, 2025)
-
Hurricanes linked to three-time Norris winner at Yahoo Sports (Thu Jul 31, 2025)
-
Hurricanes linked to three-time Norris winner at Yahoo Sports (Thu Jul 31, 2025)
-
NHL Rumors: Buffalo Sabres, Ottawa Senators, and Erik Karlsson at NHL Rumors (Thu Jul 31, 2025)
-
This package for Erik Karlsson could be enticing for Ottawa to bring the legend back at SenShot (Wed Jul 30, 2025)
-
NHL Rumors: The Erik Karlsson Trade Speculation Continues at NHL Rumors (Wed Jul 30, 2025)
-
With Kyle Dubas, Don't Mistake Silence For Stagnation at Yahoo Sports (Tue Jul 29, 2025)
-
Two Rivals Emerge as Trade Suitors for Penguins' Erik Karlsson: Report at Yahoo Sports (Tue Jul 29, 2025)
-
Erik Karlsson : Les Hurricanes seraient le meilleur « fit » selon Frank Seravalli at Dans Les Coulisses (Tue Jul 29, 2025)
-
NJHN Daily: Proposed Devils Fit; Karlsson Clock is Ticking; Bowman Defends Himself at New Jersey Hockey Now (Tue Jul 29, 2025)
-
Dan’s Daily: Capital Comeback; Mooney Momentum; Karlsson Trade Deadline at Yahoo Sports (Tue Jul 29, 2025)
-
NHL Rumor Mill – July 28, 2025 at Spectors Hockey (Mon Jul 28, 2025)
-
Erik Karlsson de retour à Ottawa : « cela aurait beaucoup de sens » at Dans Les Coulisses (Sat Jul 26, 2025)
-
NHL Notebook: Will the Penguins trade Erik Karlsson? at Oilers Nation (Fri Jul 25, 2025)
-
The Daily: Karlsson Coming to Atlantic?; McKenna’s Lure at Detroit Hockey Now (Fri Jul 25, 2025)
-
NHL Rumor Mill – July 25, 2025 at Spectors Hockey (Fri Jul 25, 2025)
-
Even more Erik Karlsson rumors at The Malik Report (Thu Jul 24, 2025)
-
NHL Rumors: Florida Panthers, and Five Potential Erik Karlsson Destinations at NHL Rumors (Thu Jul 24, 2025)
-
NHL Insider Reports Hurricanes Interested in Erik Karlsson at Yahoo Sports (Wed Jul 23, 2025)
-
Erik Karlsson: The Final(?) Verdict at Silver Seven Sens (Wed Jul 23, 2025)
-
Dan’s Daily: Wild vs. Rossi Battle; Karlsson Spots; Penguins Trade Limits at Yahoo Sports (Wed Jul 23, 2025)
-
NHL Rumor Mill – July 22, 2025 at Spectors Hockey (Tue Jul 22, 2025)
-
Golden Knights Predicted to Trade for Erik Karlsson at Yahoo Sports (Mon Jul 21, 2025)
-
Dougie Hamilton, Devils Trade Could Hinge on a Pair of Wild Cards at New Jersey Hockey Now (Mon Jul 21, 2025)
-
The senseless Erik Karlsson rumors involving the Golden Knights must stop immediately at Vegas Hockey Knight (Mon Jul 21, 2025)
-
One Timers: Karlsson Trade Talk and Parallel; the Race for Sid at Yahoo Sports (Mon Jul 21, 2025)
-
3 Trade Destinations for Penguins’ Erik Karlsson at The Hockey Writers (Sun Jul 20, 2025)
-
What Will Kris Letang’s Role Be In 2025-26? at Yahoo Sports (Sun Jul 20, 2025)
-
Why Maple Leafs trading for Erik Karlsson is a bad idea at Editor in Leaf (Sat Jul 19, 2025)
Current Contract
Erik Karlsson signed an $92,000,000 8-year contract with the San Jose Sharks and General Manager Doug Wilson on June 17, 2019 with an AAV of $11,500,000. This contract will start in 2019-20 and end after the 2026-27 season. In the first season of the contract the cap hit was equivalent to 14.11% of the salary cap.
Standard Contract (UFA) ( ) (0 ratings)
Erik Karlsson signed a $45,500,000 7-year contract with the Ottawa Senators and General Manager Bryan Murray on June 19, 2012 with an AAV of $6,500,000. This contract will start in 2012-13 and end after the 2018-19 season. In the first season of the contract the cap hit was equivalent to 10.83% of the salary cap.
Standard Contract (RFA) ( ) (0 ratings)
| Season | Age* | Clause | Cap Hit | AAV | Perf. Bonus | Sign. Bonus | Salary | Compensation | Minors Salary | Status | |
|---|---|---|---|---|---|---|---|---|---|---|---|
| 2012-13 | 22 | $6,500,000 | $6,500,000 | - | $1,000,000 | $4,000,000 | $5,000,000 | $5,000,000 | RFA | ||
| 2013-14 | 23 | $6,500,000 | $6,500,000 | - | - | $5,500,000 | $5,500,000 | $5,500,000 | RFA | ||
| 2014-15 | 24 | $6,500,000 | $6,500,000 | - | - | $6,500,000 | $6,500,000 | $6,500,000 | RFA-arb | ||
| 2015-16 | 25 | $6,500,000 | $6,500,000 | - | - | $7,000,000 | $7,000,000 | $7,000,000 | RFA-arb | ||
| 2016-17 | 26 | $6,500,000 | $6,500,000 | - | - | $7,000,000 | $7,000,000 | $7,000,000 | RFA-arb | ||
| 2017-18 | 27 | M-NTC | $6,500,000 | $6,500,000 | - | - | $7,000,000 | $7,000,000 | $7,000,000 | UFA | |
| 2018-19 | 28 | M-NTC | $6,500,000 | $6,500,000 | - | - | $7,500,000 | $7,500,000 | $7,500,000 | UFA | |
| Total | - | $1,000,000 | $44,500,000 | $45,500,000 | $45,500,000 |
Erik Karlsson signed a $2,625,000 3-year contract with the Ottawa Senators and General Manager Bryan Murray on May 7, 2009 with an AAV of $875,000. This contract will start in 2009-10 and end after the 2011-12 season. In the first season of the contract the cap hit was equivalent to 1.54% of the salary cap.
Entry Level Contract ( ) (0 ratings)
| Season | Age* | Clause | Cap Hit | AAV | Perf. Bonus | Sign. Bonus | Salary | Compensation | Minors Salary | Status | |
|---|---|---|---|---|---|---|---|---|---|---|---|
| 2009-10 | 19 | $875,000 | $1,300,000 | $425,000 | $87,500 | $787,500 | $875,000 | $65,000 | ELC | ||
| 2010-11 | 20 | $875,000 | $1,300,000 | $425,000 | $87,500 | $787,500 | $875,000 | $65,000 | ELC | ||
| 2011-12 | 21 | $875,000 | $1,300,000 | $425,000 | $87,500 | $787,500 | $875,000 | $65,000 | ELC | ||
| Total | $1,275,000 | $262,500 | $2,362,500 | $2,625,000 | $195,000 |
Career Statistics
| Regular Season | Playoffs | |||||||||||||||||||
|---|---|---|---|---|---|---|---|---|---|---|---|---|---|---|---|---|---|---|---|---|
| Season | League | Team | GP | G | A | Pts | +/- | PIM | Shots | Sh% | TOI/G | GP | G | A | Pts | +/- | PIM | Shots | Sh% | TOI/G |
| 2005-06 | J20 Div.2 | Boro/Vetlanda J20 | 4 | 1 | 5 | 6 | 18 | |||||||||||||
| 2006-07 | Swe-Jr. | Sodertalje Jr. | 10 | 2 | 8 | 10 | 8 | |||||||||||||
| 2006-07 | Swe-U18 | Sodertalje U18 | 2 | 0 | 1 | 1 | 33 | |||||||||||||
| 2007-08 | Sweden | Frolunda | 7 | 1 | 0 | 1 | 6 | |||||||||||||
| 2007-08 | Swe-Jr. | Frolunda Jr. | 38 | 13 | 24 | 37 | 68 | 5 | 1 | 1 | 4 | 0.0 | ||||||||
| 2007-08 | Swe-U18 | Frolunda U18 | 3 | 1 | 2 | 3 | 2 | 2 | 1 | 1 | 10 | 0.0 | ||||||||
| 2008-09 | Sweden-2 | Boras | 7 | 0 | 1 | 1 | 14 | |||||||||||||
| 2008-09 | WJC-A | Sweden | 6 | 2 | 7 | 9 | ||||||||||||||
| 2008-09 | Swe-Jr. | Frolunda Jr. | 1 | 0 | 2 | 2 | 2 | |||||||||||||
| 2008-09 | Sweden | Frolunda | 45 | 5 | 5 | 10 | 10 | 11 | 1 | 2 | 3 | 24 | ||||||||
| 2009-10 | AHL | Binghamton | 12 | 0 | 11 | 11 | 22 | |||||||||||||
| 2009-10 | WC-A | Sweden | 9 | 1 | 3 | 4 | 2 | |||||||||||||
| 2009-10 | NHL | Ottawa Senators | 60 | 5 | 21 | 26 | -5 | 24 | 112 | 4.5 | 20:07 | 6 | 1 | 5 | 6 | -4 | 4 | 12 | 8.3 | 25:52 |
| 2010-11 | NHL | Ottawa Senators | 75 | 13 | 32 | 45 | -30 | 50 | 182 | 7.1 | 23:31 | |||||||||
| 2011-12 | WC-A | Sweden | 8 | 3 | 4 | 7 | +3 | 2 | ||||||||||||
| 2011-12 | NHL | Ottawa Senators | 81 | 19 | 59 | 78 | +16 | 42 | 261 | 7.3 | 25:19 | 7 | 1 | 1 | 4 | 31 | 3.2 | 25:22 | ||
| 2012-13 | Finland | Jokerit | 30 | 9 | 25 | 34 | +12 | 24 | ||||||||||||
| 2012-13 | NHL | Ottawa Senators | 17 | 6 | 8 | 14 | +8 | 8 | 79 | 7.6 | 27:09 | 10 | 1 | 7 | 8 | 6 | 28 | 3.6 | 26:44 | |
| 2013-14 | NHL | Ottawa Senators | 82 | 20 | 54 | 74 | -15 | 36 | 257 | 7.8 | 27:04 | |||||||||
| 2013-14 | Olympics | Sweden | 6 | 4 | 4 | 8 | +5 | 20 | ||||||||||||
| 2014-15 | NHL | Ottawa Senators | 82 | 21 | 45 | 66 | +7 | 42 | 292 | 7.2 | 27:15 | 6 | 1 | 3 | 4 | -2 | 2 | 17 | 5.9 | 28:58 |
| 2015-16 | NHL | Ottawa Senators | 82 | 16 | 66 | 82 | -2 | 50 | 248 | 6.4 | 28:58 | |||||||||
| 2016-17 | WCup | Sweden | 4 | 1 | 3 | 4 | +2 | 2 | ||||||||||||
| 2016-17 | NHL | Ottawa Senators | 77 | 17 | 54 | 71 | +10 | 28 | 218 | 7.8 | 26:50 | 19 | 2 | 16 | 18 | +13 | 10 | 53 | 3.8 | 28:08 |
| 2017-18 | NHL | Ottawa Senators | 71 | 9 | 53 | 62 | -25 | 36 | 196 | 4.6 | 26:44 | |||||||||
| 2018-19 | NHL | San Jose Sharks | 53 | 3 | 42 | 45 | +6 | 22 | 169 | 1.8 | 24:29 | 19 | 2 | 14 | 16 | -3 | 8 | 51 | 3.9 | 24:45 |
| 2019-20 | NHL | San Jose Sharks | 56 | 6 | 34 | 40 | -15 | 16 | 120 | 5.0 | 24:31 | |||||||||
| 2020-21 | NHL | San Jose Sharks | 52 | 8 | 14 | 22 | -18 | 18 | 110 | 7.3 | 23:36 | |||||||||
| 2021-22 | NHL | San Jose Sharks | 50 | 10 | 25 | 35 | -14 | 14 | 117 | 8.5 | 23:28 | |||||||||
| 2022-23 | NHL | San Jose Sharks | 82 | 25 | 76 | 101 | -26 | 36 | 209 | 12.0 | 25:37 | |||||||||
| 2023-24 | NHL | Pittsburgh Penguins | 82 | 11 | 45 | 56 | +4 | 44 | 213 | 5.2 | 24:16 | |||||||||
| 2024-25 | NHL | Pittsburgh Penguins | 82 | 11 | 42 | 53 | -24 | 20 | 191 | 5.8 | 23:14 | |||||||||
| 2024-25 | 4 Nations | Sweden | 3 | 1 | 2 | 3 | +2 | 2 | 5 | 20.0 | 18:08 | |||||||||
| 2025-26 | OG | Sweden | 5 | 0 | 4 | 4 | +1 | 16 | 0.0 | 21:06 | ||||||||||
| 2025-26 | NHL | Pittsburgh Penguins | 75 | 15 | 51 | 66 | +8 | 22 | 176 | 8.5 | 23:36 | 6 | 1 | 2 | 3 | -4 | 10 | 13 | 7.7 | 28:37 |
| NHL Career | 1159 | 215 | 721 | 936 | -115 | 508 | 3150 | 6.8 | 25:07 | 73 | 9 | 47 | 56 | 44 | 205 | 4.4 | 26:43 | |||