
 Dmitry Orlov
| Position | Left Defense | Current Team | San Jose Sharks |
| Shoots | Left | Current Contract | 2 years ($6.5M CapHit) |
| Height | 5'11" | Expires | 2026-27 |
| Weight (lbs) | 215 | Expiry Age (Jun 30) | 35 |
| Age (DOB) | 34 (July 23, 1991) | Expiry Status | UFA |
| Drafted | 2009, Round 2, Overall 55 (WSH) |
| Date | Team | Transaction | |
|---|---|---|---|
| Jul 3, 2025 | San Jose Sharks | Signed 2 years @ $6.500M AAV starting in 2025-26 | |
| Jul 1, 2023 | Carolina Hurricanes | Signed 2 years @ $7.750M AAV starting in 2023-24 | |
| Jun 30, 2017 | Washington Capitals | Signed 6 years @ $5.100M AAV starting in 2017-18 | |
| Sep 21, 2016 | Washington Capitals | Signed 1 year @ $2.570M AAV starting in 2016-17 | |
| Mar 13, 2014 | Washington Capitals | Signed 2 years @ $2.000M AAV starting in 2014-15 | |
| Mar 2, 2011 | Washington Capitals | Signed to an entry level contract. |
Player Card(s)
URL: https://thestanleycap.com/cdn/player_cards/20252026/dmitry-orlov-8475200.png

URL: https://thestanleycap.com/cdn/player_cards/20242025/dmitry-orlov-8475200.png

URL: https://thestanleycap.com/cdn/player_cards/20232024/dmitry-orlov-8475200.png
About Player Cards
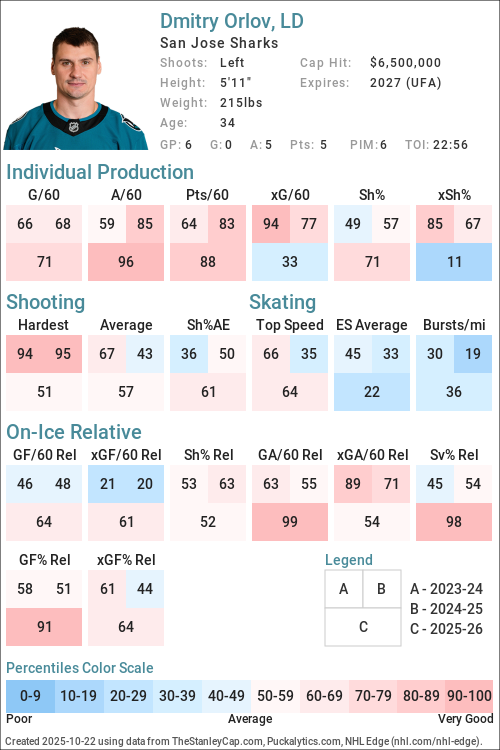
Player cards present an infographic of a players performance using a series of Player Archetypes developed for Puckalytics.com and TheStanleyCap.com. The boxes in the rink image show the archetype ratings for the season specified in the card while the graphs to the right show the five-year trends for those archetypes.
Except for Faceoffs, the values shown are the players z-score (standard deviation from the mean) for the specific metric used to calculate the archetype values. When calculating z-scores forwards were compared to forwards and defensemen were compared to defensemen. Positive values indicate the player is above average and shaded in blue, while negative values indicate the player is below average and shaded in pink. The five year trend charts show a range of -4.0 to 4.0.
The value shown for Faceoffs is the faceoff winning percentage rather than their z-score with winning percentages below 50 in pink shades and above 50 in blue shades.
All archetypes are 5v5 except 5v4 TOI, 4v5 TOI, Skating (even strength) and Faceoffs (all situations). Archetypes use regular season data only.
Archetypes Summary
- Sniper - Measures the to score above the expected goal rate.
- Rebound - Measures the percent of a players shot attempts that come from rebounds (forwards only).
- 5v4 TOI - Powerplay ice time, calculated as the percentage of his teams 5v4 ice time that the player was on the ice for.
- Shooter - Measures whether a players points come from shots (goals or assists on rebounds from his shots).
- Producer - Measures a players ability to produce goals and assists, adjusted for quality of teammates.
- Playmaker - Measures whether a players points come from passes.
- Drive - Measures a players ability to drive puck possession and generate shot attempts for his team.
- Rush - Measures the percent of a players shot attempts that come from rush plays
- Possession - An indicator of a players ability to improve his teams puck possession game.
- Faceoffs - Faceoff Winning Percentage (min. 75 faceoffs taken).
- 5v5 TOI - The percentage of his teams 5v5 TOI that the player was on the ice for.
- Suppress - Measures a players ability to suppress opponent puck possession and shot attempts against.
- Skating - An indicator of a players skating ability, or speed bursts above 20mph per mile skated.
- Defend - An indicator of a players ability to suppress shot quality against.
- 4v5 TOI - Penalty Kill ice time, calculated as the percentage of his teams 4v5 ice time that the player was on the ice for.
Data Sources
- Salary data is from TheStanleyCap.com
- Skating data is from NHL Edge
- Other statistics are from Puckalytics.com and derived from data from NHL.com
Terms of Use
You are free to use include player cards in written articles, share on social media, or on other public websites under the following conditions:
- You credit TheStanleyCap.com as the source and provide a link back to TheStanleyCap.com or this player page.
- You do not mass copy/duplicate/publish dozens or hundreds of player cards. A few, or a handful for a written article is fine. Be reasonable. Fair use rules apply.
- If you are a high-traffic website you must download and host the image(s) on your site rather than overload TheStanleyCap servers with traffic.
Note: Player cards will update daily throughout the season so if you want to include snapshot then you must download the image.
If you have any questions, send an e-mail to the e-mail address at the top of this page.
Read Introducing Player Archetypes on HockeyAnalysis.com for more details on archetype calculations.
Core Archetypes
| Season | Team(s) | GP | TOI | Producer | Playmaker | Shooter | Sniper | Rebound | Rush | Skating | Defend |
|---|---|---|---|---|---|---|---|---|---|---|---|
| 2015-16 | WSH | 81 | 1.53 | 0.59 | 1.85 | 2.29 | - | 0.84 | - | -1.70 | |
| 2016-17 | WSH | 82 | 0.45 | 0.51 | -0.07 | 0.11 | - | 1.47 | - | -1.01 | |
| 2017-18 | WSH | 82 | 0.35 | -0.22 | 1.01 | 2.13 | - | 1.54 | - | -0.73 | |
| 2018-19 | WSH | 82 | 0.10 | 0.69 | -0.71 | -1.20 | - | 0.42 | - | -1.21 | |
| 2019-20 | WSH | 69 | -0.13 | 0.45 | -0.70 | -1.22 | - | 1.30 | - | -0.86 | |
| 2020-21 | WSH | 51 | 0.84 | -0.03 | 1.46 | 2.45 | - | 0.02 | - | 1.00 | |
| 2021-22 | WSH | 75 | 0.91 | 0.33 | 1.20 | 1.68 | - | 1.10 | -0.31 | 1.17 | |
| 2022-23 | BOS, WSH | 66 | 0.84 | 1.27 | -0.21 | -0.34 | - | -0.20 | -0.63 | 0.63 | |
| 2023-24 | CAR | 82 | 0.19 | 0.19 | -0.04 | -0.50 | - | 0.58 | -0.62 | -0.07 | |
| 2024-25 | CAR | 76 | 1.08 | 1.25 | 0.06 | -0.19 | - | -0.68 | -0.86 | 0.12 | |
| 2025-26 | SJS | 82 | -0.55 | -0.02 | -0.84 | -0.64 | - | -0.70 | -0.93 | -0.99 |
Situational and Secondary Archetypes
| Season | Team(s) | GP | TOI | 5v5 TOI | 5v4 TOI | 4v5 TOI | Possession | Drive | Suppress | Faceoffs |
|---|---|---|---|---|---|---|---|---|---|---|
| 2015-16 | WSH | 81 | -0.75 | -1.07 | -2.34 | 0.56 | 0.43 | 0.41 | - | |
| 2016-17 | WSH | 82 | 0.81 | -0.46 | -2.04 | 1.01 | 0.89 | 0.60 | - | |
| 2017-18 | WSH | 82 | 1.66 | -0.37 | -0.04 | 0.81 | 0.12 | 1.25 | - | |
| 2018-19 | WSH | 82 | 1.32 | -0.94 | -0.66 | -0.17 | -0.56 | 0.39 | - | |
| 2019-20 | WSH | 69 | 1.68 | -0.45 | -1.42 | 0.90 | 0.58 | 0.76 | - | |
| 2020-21 | WSH | 51 | 0.78 | -0.96 | -1.57 | 0.60 | 0.70 | 0.10 | - | |
| 2021-22 | WSH | 75 | 1.00 | -0.67 | -1.21 | 1.06 | 0.27 | 1.38 | - | |
| 2022-23 | BOS, WSH | 66 | 0.96 | -0.15 | 0.29 | 0.71 | 1.01 | 0.04 | - | |
| 2023-24 | CAR | 82 | -0.33 | -1.03 | -1.20 | 0.52 | -0.82 | 1.32 | - | |
| 2024-25 | CAR | 76 | 0.59 | -1.47 | 0.23 | -0.31 | -1.08 | 0.48 | - | |
| 2025-26 | SJS | 82 | 0.48 | 0.69 | -1.20 | 1.31 | 1.12 | 0.79 | - |
5v5 Individual Stats
| Season | Team(s) | GP | TOI | G/60 | A/60 | Pts/60 | xG/60 | GAE/60 | Sh% | xSh% | Sh%AE | %SA Rush | %SA Reb. |
|---|---|---|---|---|---|---|---|---|---|---|---|---|---|
| 2015-16 | WSH | 81 | 1180:43 | 0.41 | 0.76 | 1.17 | 0.19 | 0.22 | 10.00 | 4.66 | 5.34 | 1.79 | 1.79 |
| 2016-17 | WSH | 82 | 1415:37 | 0.21 | 0.81 | 1.02 | 0.20 | 0.01 | 4.55 | 4.39 | 0.16 | 2.78 | 1.39 |
| 2017-18 | WSH | 82 | 1540:21 | 0.39 | 0.55 | 0.93 | 0.17 | 0.22 | 10.20 | 4.57 | 5.63 | 2.94 | 2.21 |
| 2018-19 | WSH | 82 | 1481:29 | 0.08 | 0.81 | 0.89 | 0.18 | -0.10 | 2.41 | 5.24 | -2.83 | 1.61 | 2.42 |
| 2019-20 | WSH | 69 | 1258:57 | 0.10 | 0.76 | 0.86 | 0.21 | -0.11 | 2.44 | 5.25 | -2.81 | 2.42 | 0.00 |
| 2020-21 | WSH | 51 | 891:19 | 0.47 | 0.67 | 1.14 | 0.20 | 0.27 | 10.14 | 4.38 | 5.77 | 1.00 | 2.00 |
| 2021-22 | WSH | 75 | 1354:48 | 0.40 | 0.75 | 1.15 | 0.21 | 0.19 | 8.57 | 4.55 | 4.02 | 2.05 | 2.05 |
| 2022-23 | WSH | 43 | 795:18 | 0.08 | 0.68 | 0.75 | 0.27 | -0.19 | 1.52 | 5.32 | -3.81 | 1.18 | 4.71 |
| 2022-23 | BOS | 23 | 367:28 | 0.49 | 1.31 | 1.80 | 0.25 | 0.24 | 8.11 | 4.20 | 3.90 | 0.00 | 8.70 |
| 2022-23 | BOS, WSH | 66 | 1162:46 | 0.21 | 0.88 | 1.08 | 0.26 | -0.06 | 3.88 | 4.92 | -1.04 | 0.76 | 6.11 |
| 2023-24 | CAR | 82 | 1257:47 | 0.24 | 0.72 | 0.95 | 0.29 | -0.05 | 4.35 | 5.22 | -0.88 | 1.67 | 6.67 |
| 2024-25 | CAR | 76 | 1313:39 | 0.23 | 0.91 | 1.14 | 0.25 | -0.02 | 4.85 | 5.35 | -0.50 | 0.00 | 5.26 |
| 2025-26 | SJS | 82 | 1389:29 | 0.09 | 0.65 | 0.73 | 0.14 | -0.05 | 2.90 | 4.56 | -1.66 | 0.00 | 2.68 |
5v5 On Ice Stats
| Season | Team(s) | GP | TOI | SAF/60 | GF/60 | xGF/60 | SAA/60 | GA/60 | xGA/60 | GF% | xGF% | xGF Rel | xGA Rel | xGF% Rel |
|---|---|---|---|---|---|---|---|---|---|---|---|---|---|---|
| 2015-16 | WSH | 81 | 1180:43 | 42.13 | 2.90 | 2.40 | 38.26 | 2.34 | 2.19 | 55.34 | 52.26 | 0.16 | 0.11 | 0.43 |
| 2016-17 | WSH | 82 | 1415:37 | 43.40 | 3.05 | 2.40 | 37.85 | 1.91 | 2.18 | 61.54 | 52.45 | 0.15 | 0.01 | 1.50 |
| 2017-18 | WSH | 82 | 1540:21 | 40.51 | 2.61 | 2.46 | 42.34 | 2.34 | 2.44 | 52.76 | 50.22 | 0.21 | -0.16 | 3.89 |
| 2018-19 | WSH | 82 | 1481:29 | 40.82 | 2.55 | 2.30 | 43.33 | 2.84 | 2.66 | 47.37 | 46.36 | -0.31 | -0.03 | -2.88 |
| 2019-20 | WSH | 69 | 1258:57 | 44.80 | 2.72 | 2.89 | 39.84 | 2.76 | 2.43 | 49.57 | 54.34 | 0.35 | -0.14 | 4.65 |
| 2020-21 | WSH | 51 | 891:19 | 41.94 | 2.96 | 2.52 | 38.44 | 2.02 | 2.15 | 59.46 | 53.98 | 0.23 | 0.04 | 1.84 |
| 2021-22 | WSH | 75 | 1354:48 | 42.65 | 2.79 | 2.53 | 37.56 | 1.86 | 2.22 | 60.00 | 53.23 | 0.02 | -0.27 | 3.12 |
| 2022-23 | WSH | 43 | 795:18 | 44.66 | 2.26 | 2.88 | 42.93 | 2.49 | 2.78 | 47.62 | 50.81 | 0.27 | 0.22 | 0.42 |
| 2022-23 | BOS | 23 | 367:28 | 47.02 | 2.78 | 3.10 | 38.37 | 1.47 | 2.39 | 65.38 | 56.50 | 0.31 | -0.26 | 5.14 |
| 2022-23 | BOS, WSH | 66 | 1162:46 | 45.41 | 2.43 | 2.95 | 41.49 | 2.17 | 2.66 | 52.81 | 52.57 | 0.27 | 0.06 | 1.84 |
| 2023-24 | CAR | 82 | 1257:47 | 47.94 | 2.48 | 2.80 | 32.68 | 2.10 | 2.05 | 54.17 | 57.77 | -0.15 | -0.24 | 1.41 |
| 2024-25 | CAR | 76 | 1313:39 | 46.36 | 2.56 | 2.74 | 34.12 | 2.51 | 2.22 | 50.45 | 55.19 | -0.28 | -0.10 | -1.35 |
| 2025-26 | SJS | 82 | 1389:29 | 38.69 | 2.29 | 2.74 | 40.25 | 3.11 | 2.72 | 42.40 | 50.19 | 0.48 | 0.10 | 3.84 |
NHL Edge Stats
| Skating | Shooting | Zone Time | |||||||||||
|---|---|---|---|---|---|---|---|---|---|---|---|---|---|
| Season | GP | Top Speed | Bursts>20/mi | Avg. Speed | Top Speed | Avg. Speed | %Long Range | %Mid Range | %High Danger | ES DZ% | ES NZ% | ES OZ% | |
| This table is for Basic and Premium subscribers only. To view please login to and/or subscribe to one of our subscription plans. | |||||||||||||
Legend
| Percentile 0-25 | Percentile 25-50 | Percentile 50-75 | Percentile 75-100 |
5v5 Defense Pairs
| Season | Teammate | Team | TOI | GF/60 | GA/60 | GF% | xGF/60 | xGA/60 | xGF% | xGF Rel | xGA Rel | xGF% Rel |
|---|
Glossary
| Type | Statistic | Definition |
|---|---|---|
| Individual | G/60 | Goals Against per 60 minutes. |
| Individual | A/60 | Assists per 60 minutes. |
| Individual | Pts/60 | Points per 60 minutes. |
| Individual | xG/60 | Expected Goals per 60 minutes. |
| Individual | GAE/60 | Goals Above Expected (G/60 - xG/60). |
| Individual | Sh% | Shooting Percentage. |
| Individual | xSh% | Expected Shooting Percentage. |
| Individual | Sh%AE | Shooting percentage above expected (Sh% - xSh%). |
| Individual | %SA Rush | Percentage of shot attempts determined to be on the rush. |
| Individual | %SA Reb. | Percentage of shot attempts determined to be from rebounds. |
| On Ice | SAF/60 | Shot Attempts For per 60 minutes. |
| On Ice | GF/60 | Goals For per 60 minutes. |
| On Ice | xGF/60 | Expected Goals For per 60 minutes. |
| On Ice | SAA/60 | Shot Attempts Against per 60 minutes (lower is better). |
| On Ice | GA/60 | Goals Against per 60 minutes (lower is better). |
| On Ice | xGA/60 | Expected Goals Against per 60 minutes (lower is better). |
| On Ice | GF% | Goals For Percentage = Goals For / (Goals For + Goals Against) |
| On Ice | xGF% | Expected Goals For Percentage = Expected Goals For / (Expected Goals For + Expected Goals Against) |
| On Ice | xGF Rel | xGF/60 when On Ice - xGF/60 when not On Ice. |
| On Ice | xGA Rel | xGA/60 when On Ice - xGA/60 when not On Ice (lower is better). |
| On Ice | xGF% Rel | xGF% when On Ice - xGF% when not On Ice. |
News and Opinions
-
SJHN Daily: PWHL State of Union, Orlov Showers Celebrini With Praise, Rielly Interested in Sharks? at San Jose Hockey Now (Wed Jun 17, 2026)
-
2026 season review Dmitry Orlov: Welcome to San Jose at Fear the Fin (Mon Jun 8, 2026)
-
Alex Ovechkin attends Russian Cup Superfinal with Dmitry Orlov and Mikhail Sergachev at Russian Machine Never Breaks (Mon May 25, 2026)
-
John Carlson meets up with former Capitals teammate Dmitry Orlov after Ducks-Sharks game at Russian Machine Never Breaks (Thu Apr 2, 2026)
-
Orlov Offers Winning Wisdom Amidst Sharks’ Losing Streak (+) at San Jose Hockey Now (Thu Mar 26, 2026)
-
Timothy Liljegren spoke to Dmitry Orlov about Capitals after trade-deadline deal: ‘He had nothing but good things to say’ at Russian Machine Never Breaks (Tue Mar 10, 2026)
-
Zucker, Orlov and more power play sleepers to add to your fantasy hockey lineup at ESPN (Tue Jan 13, 2026)
-
What Can Young Sharks Learn From Orlov? (+) at San Jose Hockey Now (Wed Dec 3, 2025)
-
Preview/Lines #9: Orlov Emerging As Clear Leader of Sharks’ Blueline at San Jose Hockey Now (Sun Oct 26, 2025)
-
Preview/Lines #3: Orlov Has No Grudge Against Canes, Why Scratch Graf? at San Jose Hockey Now (Tue Oct 14, 2025)
-
7 Observations: Golden Knights Get UNBELIEVABLY Lucky, Earn First Win at Vegas Hockey Now (Fri Oct 10, 2025)
-
Mukhamadullin Talks Surgery Recovery, What Stands Out About Orlov at San Jose Hockey Now (Sun Sep 28, 2025)
-
Pre-Season Preview/Lines #2: Sharks Talk Heritage 2.0 Jerseys, Orlov Shares ‘Funny’ Convo With Ovechkin at San Jose Hockey Now (Fri Sep 26, 2025)
-
Orlov on Mukhamadullin, When Celebrini Tried To Dangle Him (+) at San Jose Hockey Now (Tue Sep 23, 2025)
-
Small Orlov Details That Could Make Big Impact on Sharks (+) at San Jose Hockey Now (Thu Aug 28, 2025)
-
NHL Rumors: Colorado Avalanche, Washington, And Orlov at NHL Rumors (Sat Jul 19, 2025)
-
Former Hurricanes blue liner opens up about time in Carolina at Cardiac Cane (Sat Jul 19, 2025)
-
Dmitry Orlov n'était plus heureux avec les Hurricanes at HABSolument Fan (Fri Jul 18, 2025)
-
What do Leddy, Orlov bring to the Sharks defense? at Fear the Fin (Sat Jul 5, 2025)
-
3 potential homes for Dmitry Orlov as he heads towards free agency on July 1st at Cardiac Cane (Wed Jun 18, 2025)
Current Contract
Dmitry Orlov signed a $13,000,000 2-year contract with the San Jose Sharks and General Manager Mike Grier on July 3, 2025 with an AAV of $6,500,000. This contract will start in 2025-26 and end after the 2026-27 season. In the first season of the contract the cap hit was equivalent to 6.81% of the salary cap.
Standard Contract (UFA) ( ) (0 ratings)
Dmitry Orlov signed a $15,500,000 2-year contract with the Carolina Hurricanes and General Manager Don Waddell on July 1, 2023 with an AAV of $7,750,000. This contract will start in 2023-24 and end after the 2024-25 season. In the first season of the contract the cap hit was equivalent to 9.28% of the salary cap.
Standard Contract (UFA) ( ) (0 ratings)
| Season | Age* | Clause | Cap Hit | AAV | Perf. Bonus | Sign. Bonus | Salary | Compensation | Minors Salary | Status | |
|---|---|---|---|---|---|---|---|---|---|---|---|
| 2023-24 | 32 | $7,750,000 | $7,750,000 | - | $3,000,000 | $4,750,000 | $7,750,000 | $7,750,000 | UFA | ||
| 2024-25 | 33 | $7,750,000 | $7,750,000 | - | - | $7,750,000 | $7,750,000 | $7,750,000 | UFA | ||
| Total | - | $3,000,000 | $12,500,000 | $15,500,000 | $15,500,000 |
Dmitry Orlov signed a $30,600,000 6-year contract with the Washington Capitals and General Manager Brian MacLellan on June 30, 2017 with an AAV of $5,100,000. This contract will start in 2017-18 and end after the 2022-23 season. In the first season of the contract the cap hit was equivalent to 6.80% of the salary cap.
Standard Contract (RFA) ( ) (0 ratings)
| Season | Age* | Clause | Cap Hit | AAV | Perf. Bonus | Sign. Bonus | Salary | Compensation | Minors Salary | Status | |
|---|---|---|---|---|---|---|---|---|---|---|---|
| 2017-18 | 26 | $5,100,000 | $5,100,000 | - | $2,000,000 | $4,500,000 | $6,500,000 | $6,500,000 | RFA-arb | ||
| 2018-19 | 27 | $5,100,000 | $5,100,000 | - | $2,000,000 | $4,500,000 | $6,500,000 | $6,500,000 | RFA-arb | ||
| 2019-20 | 28 | M-NTC | $5,100,000 | $5,100,000 | - | $2,000,000 | $4,500,000 | $6,500,000 | $6,500,000 | UFA | |
| 2020-21 | 29 | M-NTC | $5,100,000 | $5,100,000 | - | $2,000,000 | $2,500,000 | $4,500,000 | $4,500,000 | UFA | |
| 2021-22 | 30 | M-NTC | $5,100,000 | $5,100,000 | - | $2,000,000 | $1,300,000 | $3,300,000 | $3,300,000 | UFA | |
| 2022-23 | 31 | M-NTC | $5,100,000 | $5,100,000 | - | $2,000,000 | $1,300,000 | $3,300,000 | $3,300,000 | UFA | |
| Total | - | $12,000,000 | $18,600,000 | $30,600,000 | $30,600,000 |
Dmitry Orlov signed a $2,570,000 1-year contract with the Washington Capitals and General Manager Brian MacLellan on September 21, 2016 with an AAV of $2,570,000. This contract will start in 2016-17 and end after the 2016-17 season. In the first season of the contract the cap hit was equivalent to 3.52% of the salary cap.
Standard Contract (RFA) ( ) (0 ratings)
| Season | Age* | Clause | Cap Hit | AAV | Perf. Bonus | Sign. Bonus | Salary | Compensation | Minors Salary | Status | |
|---|---|---|---|---|---|---|---|---|---|---|---|
| 2016-17 | 25 | $2,570,000 | $2,570,000 | - | - | $2,570,000 | $2,570,000 | $2,570,000 | RFA-arb | ||
| Total | - | - | $2,570,000 | $2,570,000 | $2,570,000 |
Dmitry Orlov signed a $4,000,000 2-year contract with the Washington Capitals and General Manager George McPhee on March 13, 2014 with an AAV of $2,000,000. This contract will start in 2014-15 and end after the 2015-16 season. In the first season of the contract the cap hit was equivalent to 2.90% of the salary cap.
Standard Contract (RFA) ( ) (0 ratings)
| Season | Age* | Clause | Cap Hit | AAV | Perf. Bonus | Sign. Bonus | Salary | Compensation | Minors Salary | Status | |
|---|---|---|---|---|---|---|---|---|---|---|---|
| 2014-15 | 23 | $2,000,000 | $2,000,000 | - | $100,000 | $1,650,000 | $1,750,000 | $1,750,000 | RFA | ||
| 2015-16 | 24 | $2,000,000 | $2,000,000 | - | - | $2,250,000 | $2,250,000 | $2,250,000 | RFA-arb | ||
| Total | - | $100,000 | $3,900,000 | $4,000,000 | $4,000,000 |
Dmitry Orlov signed a $2,070,000 3-year contract with the Washington Capitals and General Manager George McPhee on March 2, 2011 with an AAV of $690,000. This contract will start in 2011-12 and end after the 2013-14 season. In the first season of the contract the cap hit was equivalent to 1.07% of the salary cap.
Entry Level Contract ( ) (0 ratings)
| Season | Age* | Clause | Cap Hit | AAV | Perf. Bonus | Sign. Bonus | Salary | Compensation | Minors Salary | Status | |
|---|---|---|---|---|---|---|---|---|---|---|---|
| 2011-12 | 20 | $690,000 | $900,000 | $260,000 | $90,000 | $550,000 | $640,000 | $67,500 | ELC | ||
| 2012-13 | 21 | $690,000 | $900,000 | $210,000 | $90,000 | $600,000 | $690,000 | $67,500 | ELC | ||
| 2013-14 | 22 | $690,000 | $900,000 | $160,000 | $90,000 | $650,000 | $740,000 | $67,500 | ELC | ||
| Total | $630,000 | $270,000 | $1,800,000 | $2,070,000 | $202,500 |
Career Statistics
| Regular Season | Playoffs | |||||||||||||||||||
|---|---|---|---|---|---|---|---|---|---|---|---|---|---|---|---|---|---|---|---|---|
| Season | League | Team | GP | G | A | Pts | +/- | PIM | Shots | Sh% | TOI/G | GP | G | A | Pts | +/- | PIM | Shots | Sh% | TOI/G |
| 2007-08 | Russia | Novokuznetsk | 6 | 0 | 0 | 0 | ||||||||||||||
| 2007-08 | WJ18-A | Russia | 6 | 0 | 1 | 1 | ||||||||||||||
| 2008-09 | Rus-KHL | Novokuznetsk | 16 | 1 | 0 | 1 | 4 | |||||||||||||
| 2008-09 | WJ18-A | Russia | 7 | 2 | 2 | 4 | 6 | |||||||||||||
| 2009-10 | Rus-KHL | Novokuznetsk | 41 | 4 | 3 | 7 | 49 | |||||||||||||
| 2009-10 | WJC-A | Russia | 6 | 0 | 4 | 4 | 4 | |||||||||||||
| 2009-10 | Russia-Jr. | Novokuznetsk Jr. | 7 | 7 | 6 | 13 | 6 | 17 | 9 | 10 | 19 | 26 | 0.0 | |||||||
| 2010-11 | Rus-KHL | Novokuznetsk | 45 | 2 | 11 | 13 | 43 | |||||||||||||
| 2010-11 | WJC-A | Russia | 7 | 1 | 8 | 9 | +10 | 6 | ||||||||||||
| 2010-11 | Russia-Jr. | Novokuznetsk Jr. | 1 | 0 | 0 | 0 | ||||||||||||||
| 2010-11 | AHL | Hershey | 19 | 2 | 7 | 9 | 12 | 6 | 1 | 1 | 4 | |||||||||
| 2011-12 | NHL | Washington Capitals | 60 | 3 | 16 | 19 | +1 | 18 | 51 | 5.9 | 16:52 | |||||||||
| 2011-12 | AHL | Hershey | 15 | 4 | 5 | 9 | 12 | 21 | 1,905.0 | |||||||||||
| 2012-13 | NHL | Washington Capitals | 5 | 0 | 1 | 1 | +5 | 1 | 0.0 | 14:57 | ||||||||||
| 2012-13 | AHL | Hershey | 31 | 3 | 14 | 17 | -2 | 20 | 52 | 577.0 | 4 | 1 | 2 | 3 | 4 | 7 | 1,429.0 | |||
| 2013-14 | NHL | Washington Capitals | 54 | 3 | 8 | 11 | -1 | 19 | 59 | 5.1 | 19:36 | |||||||||
| 2013-14 | AHL | Hershey | 11 | 3 | 6 | 9 | +1 | 4 | 15 | 2,000.0 | ||||||||||
| 2013-14 | WC-A | Russia | 3 | 0 | 1 | 1 | +3 | 2 | 1 | |||||||||||
| 2014-15 | AHL | Hershey | 3 | 0 | 3 | 3 | -3 | 4 | 6 | 0.0 | ||||||||||
| 2015-16 | WC-A | Russia | 6 | 0 | 3 | 3 | +3 | 2 | 7 | |||||||||||
| 2015-16 | NHL | Washington Capitals | 82 | 8 | 21 | 29 | +8 | 26 | 90 | 8.9 | 16:02 | 11 | 1 | 1 | 2 | 5 | 0.0 | 13:18 | ||
| 2016-17 | WC | Russia | 5 | 1 | 0 | 1 | +4 | |||||||||||||
| 2016-17 | WCup | Russia | 4 | 0 | 0 | 0 | +3 | 4 | ||||||||||||
| 2016-17 | NHL | Washington Capitals | 82 | 6 | 27 | 33 | +30 | 51 | 125 | 4.8 | 19:32 | 13 | 3 | 3 | -1 | 2 | 21 | 0.0 | 21:25 | |
| 2017-18 | NHL | Washington Capitals | 82 | 10 | 21 | 31 | +10 | 22 | 125 | 8.0 | 23:08 | 24 | 2 | 6 | 8 | +5 | 4 | 48 | 4.2 | 24:12 |
| 2018-19 | WC | Russia | 10 | 2 | 4 | 6 | +8 | 2 | ||||||||||||
| 2018-19 | EHT | Russia | 2 | 1 | 0 | 1 | +2 | |||||||||||||
| 2018-19 | NHL | Washington Capitals | 82 | 3 | 26 | 29 | +3 | 33 | 101 | 3.0 | 21:38 | 7 | 4 | 4 | -2 | 4 | 10 | 0.0 | 23:23 | |
| 2019-20 | NHL | Washington Capitals | 69 | 4 | 23 | 27 | +5 | 36 | 105 | 3.8 | 22:10 | 8 | 3 | 3 | -1 | 4 | 11 | 0.0 | 24:00 | |
| 2020-21 | WC | Russia | 3 | 0 | 2 | 2 | +5 | |||||||||||||
| 2020-21 | NHL | Washington Capitals | 51 | 8 | 14 | 22 | +16 | 20 | 83 | 9.6 | 19:49 | 5 | 3 | 3 | -1 | 6 | 12 | 0.0 | 23:27 | |
| 2021-22 | NHL | Washington Capitals | 76 | 12 | 23 | 35 | +25 | 44 | 127 | 9.4 | 20:58 | 6 | 1 | 1 | -4 | 2 | 3 | 0.0 | 22:02 | |
| 2022-23 | NHL | Washington Capitals | 43 | 3 | 16 | 19 | +2 | 10 | 77 | 3.9 | 22:43 | |||||||||
| 2022-23 | NHL | Boston Bruins | 23 | 4 | 13 | 17 | +10 | 12 | 47 | 8.5 | 22:13 | 7 | 8 | 8 | -3 | 2 | 11 | 0.0 | 23:03 | |
| 2023-24 | NHL | Carolina Hurricanes | 82 | 6 | 20 | 26 | +4 | 36 | 129 | 4.7 | 17:19 | 11 | 2 | 4 | 6 | 14 | 22 | 9.1 | 20:57 | |
| 2024-25 | NHL | Carolina Hurricanes | 76 | 6 | 22 | 28 | +16 | 24 | 117 | 5.1 | 20:00 | 15 | 4 | 4 | +2 | 10 | 21 | 0.0 | 21:42 | |
| 2025-26 | NHL | San Jose Sharks | 82 | 3 | 34 | 37 | -28 | 48 | 91 | 3.3 | 21:12 | |||||||||
| NHL Career | 949 | 79 | 285 | 364 | +106 | 399 | 1328 | 5.9 | 20:03 | 107 | 4 | 37 | 41 | -5 | 50 | 164 | 2.4 | 21:45 | ||