
Derek Forbort
| Position | Left Defense | Current Team | |
| Shoots | Left | Current Contract | |
| Height | 6'4" | Expires | |
| Weight (lbs) | 216 | Expiry Age (Jun 30) | |
| Age (DOB) | 34 (Mar 4, 1992) | Expiry Status | |
| Drafted | 2010, Round 1, Overall 15 (LAK) |
| Date | Team | Transaction | |
|---|---|---|---|
| Oct 28, 2025 | Vancouver Canucks | Placed on LTIR | |
| Oct 15, 2025 | Vancouver Canucks | Placed on IR | |
| Jun 3, 2025 | Vancouver Canucks | Signed 1 year @ $2.000M AAV starting in 2025-26 | |
| Jan 8, 2025 | Vancouver Canucks | Activated from IR | |
| Nov 17, 2024 | Vancouver Canucks | Placed on IR | |
| Jul 1, 2024 | Vancouver Canucks | Signed 1 year @ $1.500M AAV starting in 2024-25 | |
| Jul 28, 2021 | Boston Bruins | Signed 3 years @ $3.000M AAV starting in 2021-22 | |
| Oct 11, 2020 | Winnipeg Jets | Signed 1 year @ $1.000M AAV starting in 2020-21 | |
| Oct 19, 2017 | Los Angeles Kings | Signed 2 years @ $2.525M AAV starting in 2018-19 | |
| Jul 9, 2016 | Los Angeles Kings | Signed 2 years @ $650K AAV starting in 2016-17 | |
| Apr 6, 2013 | Los Angeles Kings | Signed to an entry level contract. |
Player Card(s)
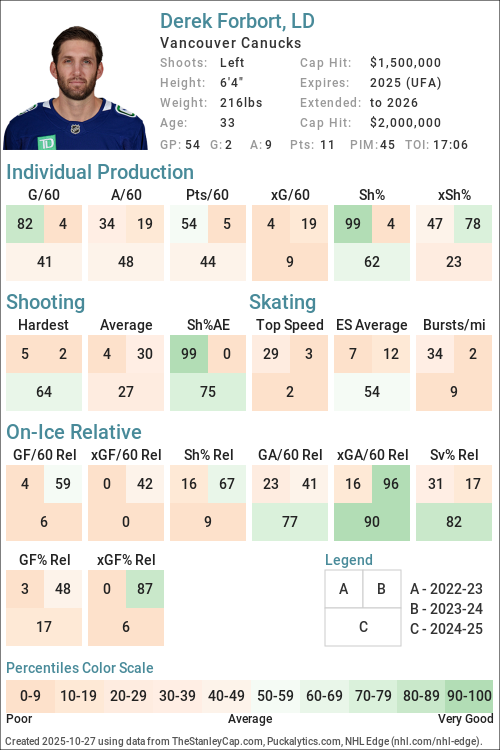
URL: https://thestanleycap.com/cdn/player_cards/20242025/derek-forbort-8475762.png
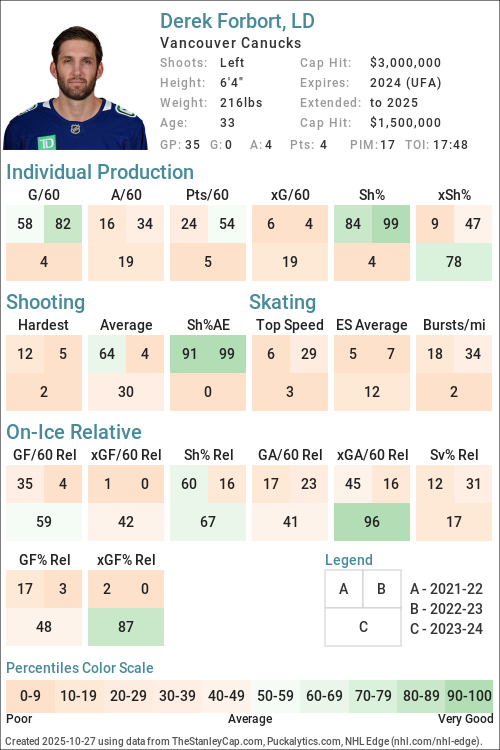
URL: https://thestanleycap.com/cdn/player_cards/20232024/derek-forbort-8475762.png
About Player Cards
Player cards present an infographic of a players performance using a series of Player Archetypes developed for Puckalytics.com and TheStanleyCap.com. The boxes in the rink image show the archetype ratings for the season specified in the card while the graphs to the right show the five-year trends for those archetypes.
Except for Faceoffs, the values shown are the players z-score (standard deviation from the mean) for the specific metric used to calculate the archetype values. When calculating z-scores forwards were compared to forwards and defensemen were compared to defensemen. Positive values indicate the player is above average and shaded in blue, while negative values indicate the player is below average and shaded in pink. The five year trend charts show a range of -4.0 to 4.0.
The value shown for Faceoffs is the faceoff winning percentage rather than their z-score with winning percentages below 50 in pink shades and above 50 in blue shades.
All archetypes are 5v5 except 5v4 TOI, 4v5 TOI, Skating (even strength) and Faceoffs (all situations). Archetypes use regular season data only.
Archetypes Summary
- Sniper - Measures the to score above the expected goal rate.
- Rebound - Measures the percent of a players shot attempts that come from rebounds (forwards only).
- 5v4 TOI - Powerplay ice time, calculated as the percentage of his teams 5v4 ice time that the player was on the ice for.
- Shooter - Measures whether a players points come from shots (goals or assists on rebounds from his shots).
- Producer - Measures a players ability to produce goals and assists, adjusted for quality of teammates.
- Playmaker - Measures whether a players points come from passes.
- Drive - Measures a players ability to drive puck possession and generate shot attempts for his team.
- Rush - Measures the percent of a players shot attempts that come from rush plays
- Possession - An indicator of a players ability to improve his teams puck possession game.
- Faceoffs - Faceoff Winning Percentage (min. 75 faceoffs taken).
- 5v5 TOI - The percentage of his teams 5v5 TOI that the player was on the ice for.
- Suppress - Measures a players ability to suppress opponent puck possession and shot attempts against.
- Skating - An indicator of a players skating ability, or speed bursts above 20mph per mile skated.
- Defend - An indicator of a players ability to suppress shot quality against.
- 4v5 TOI - Penalty Kill ice time, calculated as the percentage of his teams 4v5 ice time that the player was on the ice for.
Data Sources
- Salary data is from TheStanleyCap.com
- Skating data is from NHL Edge
- Other statistics are from Puckalytics.com and derived from data from NHL.com
Terms of Use
You are free to use include player cards in written articles, share on social media, or on other public websites under the following conditions:
- You credit TheStanleyCap.com as the source and provide a link back to TheStanleyCap.com or this player page.
- You do not mass copy/duplicate/publish dozens or hundreds of player cards. A few, or a handful for a written article is fine. Be reasonable. Fair use rules apply.
- If you are a high-traffic website you must download and host the image(s) on your site rather than overload TheStanleyCap servers with traffic.
Note: Player cards will update daily throughout the season so if you want to include snapshot then you must download the image.
If you have any questions, send an e-mail to the e-mail address at the top of this page.
Read Introducing Player Archetypes on HockeyAnalysis.com for more details on archetype calculations.
Core Archetypes
| Season | Team(s) | GP | TOI | Producer | Playmaker | Shooter | Sniper | Rebound | Rush | Skating | Defend |
|---|---|---|---|---|---|---|---|---|---|---|---|
| 2015-16 | LAK | 14 | 1.18 | -0.13 | 2.73 | 1.25 | - | -0.89 | - | -1.62 | |
| 2016-17 | LAK | 82 | -0.11 | 0.30 | -0.54 | -0.18 | - | -0.96 | - | 0.88 | |
| 2017-18 | LAK | 78 | -0.41 | 0.41 | -0.96 | -0.77 | - | -0.24 | - | -0.03 | |
| 2018-19 | LAK | 81 | -0.49 | 0.00 | -0.79 | 0.16 | - | -1.03 | - | 1.45 | |
| 2019-20 | CGY, LAK | 20 | -1.37 | -1.11 | -0.85 | -1.56 | - | 1.62 | - | 1.51 | |
| 2020-21 | WPG | 56 | -0.34 | 0.04 | -0.63 | 0.53 | - | -0.81 | - | -1.82 | |
| 2021-22 | BOS | 76 | -0.75 | -0.88 | -0.28 | 1.52 | - | -1.07 | -0.97 | -1.11 | |
| 2022-23 | BOS | 54 | -0.13 | -0.74 | 1.00 | 3.46 | - | -0.89 | -0.55 | -0.36 | |
| 2023-24 | BOS | 35 | -1.32 | -1.08 | -1.01 | -1.97 | - | -1.10 | -1.43 | -0.87 | |
| 2024-25 | VAN | 54 | 0.40 | 0.81 | -0.40 | 0.61 | - | -0.68 | -1.15 | 0.94 | |
| 2025-26 | VAN | 2 | -1.67 | -1.61 | -0.95 | -3.38 | - | -0.70 | -0.00 | -5.47 |
Situational and Secondary Archetypes
| Season | Team(s) | GP | TOI | 5v5 TOI | 5v4 TOI | 4v5 TOI | Possession | Drive | Suppress | Faceoffs |
|---|---|---|---|---|---|---|---|---|---|---|
| 2015-16 | LAK | 14 | -3.15 | -1.56 | -1.78 | 1.27 | 2.09 | 0.29 | - | |
| 2016-17 | LAK | 82 | 0.52 | -1.48 | 0.35 | -1.75 | -1.88 | -0.75 | - | |
| 2017-18 | LAK | 78 | 0.65 | -1.41 | 0.72 | 0.36 | -0.45 | 1.12 | - | |
| 2018-19 | LAK | 81 | 0.74 | -1.69 | 0.72 | -1.13 | -1.53 | 0.15 | - | |
| 2019-20 | CGY, LAK | 20 | -0.49 | -1.76 | 0.10 | -1.16 | -1.20 | -0.56 | - | |
| 2020-21 | WPG | 56 | 0.49 | -1.54 | 1.35 | 0.29 | -0.68 | 1.10 | - | |
| 2021-22 | BOS | 76 | -0.85 | -1.50 | 1.30 | -1.63 | -2.17 | -0.33 | - | |
| 2022-23 | BOS | 54 | -0.83 | -1.39 | 1.15 | -2.12 | -1.90 | -1.26 | - | |
| 2023-24 | BOS | 35 | -0.82 | -1.46 | 0.91 | 0.60 | -0.22 | 1.19 | - | |
| 2024-25 | VAN | 54 | -1.15 | -1.44 | 0.71 | -0.88 | -1.66 | 0.82 | - | |
| 2025-26 | VAN | 2 | -2.09 | -1.52 | -0.11 | -5.02 | -6.68 | 4.10 | - |
5v5 Individual Stats
| Season | Team(s) | GP | TOI | G/60 | A/60 | Pts/60 | xG/60 | GAE/60 | Sh% | xSh% | Sh%AE | %SA Rush | %SA Reb. |
|---|---|---|---|---|---|---|---|---|---|---|---|---|---|
| 2015-16 | LAK | 14 | 143:48 | 0.42 | 0.42 | 0.83 | 0.25 | 0.17 | 7.14 | 4.30 | 2.84 | 0.00 | 11.11 |
| 2016-17 | LAK | 82 | 1391:46 | 0.09 | 0.60 | 0.69 | 0.11 | -0.02 | 2.13 | 2.62 | -0.49 | 0.00 | 2.99 |
| 2017-18 | LAK | 78 | 1343:14 | 0.04 | 0.67 | 0.71 | 0.10 | -0.05 | 1.39 | 3.04 | -1.65 | 0.93 | 2.78 |
| 2018-19 | LAK | 81 | 1435:03 | 0.08 | 0.50 | 0.59 | 0.08 | 0.00 | 2.94 | 2.89 | 0.05 | 0.00 | 2.73 |
| 2019-20 | LAK | 13 | 208:50 | 0.00 | 0.29 | 0.29 | 0.19 | -0.19 | 0.00 | 4.32 | -4.32 | 0.00 | 0.00 |
| 2019-20 | CGY | 7 | 107:10 | 0.00 | 0.00 | 0.00 | 0.08 | -0.08 | 0.00 | 1.99 | -1.99 | 12.50 | 12.50 |
| 2019-20 | CGY, LAK | 20 | 316:00 | 0.00 | 0.19 | 0.19 | 0.15 | -0.15 | 0.00 | 3.58 | -3.58 | 2.78 | 2.78 |
| 2020-21 | WPG | 56 | 961:25 | 0.12 | 0.62 | 0.75 | 0.08 | 0.04 | 3.39 | 2.26 | 1.13 | 0.00 | 1.10 |
| 2021-22 | BOS | 76 | 1087:42 | 0.22 | 0.44 | 0.66 | 0.10 | 0.12 | 6.67 | 3.04 | 3.62 | 0.00 | 2.33 |
| 2022-23 | BOS | 54 | 754:17 | 0.32 | 0.56 | 0.88 | 0.11 | 0.21 | 12.50 | 4.27 | 8.23 | 0.00 | 2.04 |
| 2023-24 | BOS | 35 | 496:24 | 0.00 | 0.48 | 0.48 | 0.12 | -0.12 | 0.00 | 4.57 | -4.57 | 0.00 | 0.00 |
| 2024-25 | VAN | 54 | 773:10 | 0.16 | 0.62 | 0.78 | 0.12 | 0.04 | 5.26 | 3.93 | 1.33 | 0.00 | 0.00 |
| 2025-26 | VAN | 2 | 21:33 | 0.00 | 0.00 | 0.00 | 0.28 | -0.28 | 0.00 | 9.92 | -9.92 | 0.00 | 0.00 |
5v5 On Ice Stats
| Season | Team(s) | GP | TOI | SAF/60 | GF/60 | xGF/60 | SAA/60 | GA/60 | xGA/60 | GF% | xGF% | xGF Rel | xGA Rel | xGF% Rel |
|---|---|---|---|---|---|---|---|---|---|---|---|---|---|---|
| 2015-16 | LAK | 14 | 143:48 | 54.66 | 1.67 | 2.84 | 35.47 | 2.09 | 1.90 | 44.44 | 59.87 | 0.24 | -0.08 | 3.22 |
| 2016-17 | LAK | 82 | 1391:46 | 40.05 | 1.94 | 2.26 | 38.02 | 1.85 | 2.16 | 51.14 | 51.09 | -0.17 | 0.21 | -4.37 |
| 2017-18 | LAK | 78 | 1343:14 | 40.25 | 2.41 | 2.01 | 40.02 | 1.97 | 2.22 | 55.10 | 47.54 | -0.21 | -0.21 | -0.18 |
| 2018-19 | LAK | 81 | 1435:03 | 35.83 | 1.63 | 2.00 | 43.06 | 2.13 | 2.45 | 43.33 | 44.97 | -0.37 | -0.03 | -3.95 |
| 2019-20 | LAK | 13 | 208:50 | 47.12 | 0.57 | 2.77 | 41.66 | 1.72 | 2.47 | 25.00 | 52.82 | 0.19 | 0.09 | 0.79 |
| 2019-20 | CGY | 7 | 107:10 | 32.47 | 1.68 | 1.66 | 41.99 | 2.24 | 2.16 | 42.86 | 43.55 | -0.65 | -0.37 | -4.31 |
| 2019-20 | CGY, LAK | 20 | 316:00 | 42.15 | 0.95 | 2.39 | 41.77 | 1.90 | 2.37 | 33.33 | 50.30 | -0.09 | -0.07 | -0.24 |
| 2020-21 | WPG | 56 | 961:25 | 36.32 | 2.43 | 2.11 | 37.94 | 2.50 | 2.55 | 49.37 | 45.21 | -0.10 | 0.00 | -1.20 |
| 2021-22 | BOS | 76 | 1087:42 | 41.37 | 2.37 | 2.17 | 38.06 | 2.54 | 2.10 | 48.31 | 50.80 | -0.73 | 0.04 | -7.64 |
| 2022-23 | BOS | 54 | 754:17 | 37.55 | 2.62 | 2.31 | 42.88 | 2.23 | 2.64 | 54.10 | 46.71 | -0.72 | 0.24 | -9.12 |
| 2023-24 | BOS | 35 | 496:24 | 40.25 | 2.78 | 2.47 | 40.85 | 2.05 | 2.07 | 57.50 | 54.50 | -0.07 | -0.49 | 4.68 |
| 2024-25 | VAN | 54 | 773:10 | 31.97 | 1.55 | 1.60 | 37.95 | 2.17 | 2.08 | 41.67 | 43.53 | -0.72 | -0.29 | -5.94 |
| 2025-26 | VAN | 2 | 21:33 | 13.92 | 2.78 | 1.60 | 33.41 | 2.78 | 2.67 | 50.00 | 37.43 | -1.22 | -0.06 | -13.37 |
NHL Edge Stats
| Skating | Shooting | Zone Time | |||||||||||
|---|---|---|---|---|---|---|---|---|---|---|---|---|---|
| Season | GP | Top Speed | Bursts>20/mi | Avg. Speed | Top Speed | Avg. Speed | %Long Range | %Mid Range | %High Danger | ES DZ% | ES NZ% | ES OZ% | |
| This table is for Basic and Premium subscribers only. To view please login to and/or subscribe to one of our subscription plans. | |||||||||||||
Legend
| Percentile 0-25 | Percentile 25-50 | Percentile 50-75 | Percentile 75-100 |
5v5 Defense Pairs
| Season | Teammate | Team | TOI | GF/60 | GA/60 | GF% | xGF/60 | xGA/60 | xGF% | xGF Rel | xGA Rel | xGF% Rel |
|---|
Glossary
| Type | Statistic | Definition |
|---|---|---|
| Individual | G/60 | Goals Against per 60 minutes. |
| Individual | A/60 | Assists per 60 minutes. |
| Individual | Pts/60 | Points per 60 minutes. |
| Individual | xG/60 | Expected Goals per 60 minutes. |
| Individual | GAE/60 | Goals Above Expected (G/60 - xG/60). |
| Individual | Sh% | Shooting Percentage. |
| Individual | xSh% | Expected Shooting Percentage. |
| Individual | Sh%AE | Shooting percentage above expected (Sh% - xSh%). |
| Individual | %SA Rush | Percentage of shot attempts determined to be on the rush. |
| Individual | %SA Reb. | Percentage of shot attempts determined to be from rebounds. |
| On Ice | SAF/60 | Shot Attempts For per 60 minutes. |
| On Ice | GF/60 | Goals For per 60 minutes. |
| On Ice | xGF/60 | Expected Goals For per 60 minutes. |
| On Ice | SAA/60 | Shot Attempts Against per 60 minutes (lower is better). |
| On Ice | GA/60 | Goals Against per 60 minutes (lower is better). |
| On Ice | xGA/60 | Expected Goals Against per 60 minutes (lower is better). |
| On Ice | GF% | Goals For Percentage = Goals For / (Goals For + Goals Against) |
| On Ice | xGF% | Expected Goals For Percentage = Expected Goals For / (Expected Goals For + Expected Goals Against) |
| On Ice | xGF Rel | xGF/60 when On Ice - xGF/60 when not On Ice. |
| On Ice | xGA Rel | xGA/60 when On Ice - xGA/60 when not On Ice (lower is better). |
| On Ice | xGF% Rel | xGF% when On Ice - xGF% when not On Ice. |
News and Opinions
-
Report: Canucks Veterans Blueger & Forbort Expected To Test Free-Agency at Yahoo Sports NHL (Mon Jun 22, 2026)
-
Canucks’ Blueger and Forbort to test NHL free agency: report at Canucks Army (Mon Jun 22, 2026)
-
2 Canucks unlikely to return next season, plus 4 more we’re less sure about at Canucks Army (Tue Apr 21, 2026)
-
“I’ve just been rehabbing now”: Derek Forbort reveals how a hip injury ruined his season at Canucks Daily (Sat Apr 18, 2026)
-
Derek Forbort details frustrating injury that went from day-to-day to ending his season at Canucks Army (Fri Apr 17, 2026)
-
Adam Foote delivers crushing news on Vancouver Canucks injured defenseman Derek Forbort at Canucks Daily (Wed Dec 31, 2025)
-
The specific injury behind Derek Forbort's 50-day absence from the Vancouver Canucks has finally come to light at Canucks Daily (Thu Nov 27, 2025)
-
Foote provides Canucks injury updates on Garland, Höglander, Blueger, and Forbort at Canucks Army (Wed Nov 19, 2025)
-
Canucks News: Tom Willander expected to make NHL debut vs Rangers, Mancini placed on IR, Forbort on LTIR at Canucks Army (Tue Oct 28, 2025)
-
Vancouver Canucks Receive Unfortunate Update on Defenseman Derek Forbort at Canucks Daily (Sat Oct 25, 2025)
-
Canucks place defenceman Derek Forbort on injured reserve at Canucks Army (Wed Oct 15, 2025)
-
Derek Forbort Replaced As Vancouver Canucks Announce Lineup & Starting Goalie Against the St. Louis Blues at Canucks Daily (Mon Oct 13, 2025)
-
Vancouver Canucks Head Coach Adam Foote Gives Key Injury Update on Derek Forbort at Canucks Daily (Fri Oct 3, 2025)
-
2 stars the LA Kings passed on in the 2010 NHL Draft for Derek Forbort at Rink Royalty (Mon Sep 8, 2025)
-
Goals and expectations for Canucks’ Derek Forbort in 2025-26 at Canucks Army (Fri Aug 8, 2025)
-
Free Agent Profile: Derek Forbort, Former Los Angeles Kings’ Defenseman at Devils Army (Fri Sep 11, 2020)
Current Contract
Player does not currently have a contract.Derek Forbort signed a $2,000,000 1-year contract with the Vancouver Canucks and General Manager Patrik Alvin on June 3, 2025 with an AAV of $2,000,000. This contract will start in 2025-26 and end after the 2025-26 season. In the first season of the contract the cap hit was equivalent to 2.09% of the salary cap.
Standard Contract (UFA) ( ) (0 ratings)
| Season | Age* | Clause | Cap Hit | AAV | Perf. Bonus | Sign. Bonus | Salary | Compensation | Minors Salary | Status | |
|---|---|---|---|---|---|---|---|---|---|---|---|
| 2025-26 | 33 | $2,000,000 | $2,000,000 | - | - | $2,000,000 | $2,000,000 | $2,000,000 | UFA | ||
| Total | - | - | $2,000,000 | $2,000,000 | $2,000,000 |
Derek Forbort signed a $1,500,000 1-year contract with the Vancouver Canucks and General Manager Patrik Alvin on July 1, 2024 with an AAV of $1,500,000. This contract will start in 2024-25 and end after the 2024-25 season. In the first season of the contract the cap hit was equivalent to 1.70% of the salary cap.
Standard Contract (UFA) ( ) (0 ratings)
| Season | Age* | Clause | Cap Hit | AAV | Perf. Bonus | Sign. Bonus | Salary | Compensation | Minors Salary | Status | |
|---|---|---|---|---|---|---|---|---|---|---|---|
| 2024-25 | 32 | $1,500,000 | $1,500,000 | - | $200,000 | $1,300,000 | $1,500,000 | $1,500,000 | UFA | ||
| Total | - | $200,000 | $1,300,000 | $1,500,000 | $1,500,000 |
Derek Forbort signed a $9,000,000 3-year contract with the Boston Bruins and General Manager Don Sweeney on July 28, 2021 with an AAV of $3,000,000. This contract will start in 2021-22 and end after the 2023-24 season. In the first season of the contract the cap hit was equivalent to 3.68% of the salary cap.
Standard Contract (UFA) ( ) (0 ratings)
| Season | Age* | Clause | Cap Hit | AAV | Perf. Bonus | Sign. Bonus | Salary | Compensation | Minors Salary | Status | |
|---|---|---|---|---|---|---|---|---|---|---|---|
| 2021-22 | 29 | M-NTC | $3,000,000 | $3,000,000 | - | - | $2,000,000 | $2,000,000 | $2,000,000 | UFA | |
| 2022-23 | 30 | M-NTC | $3,000,000 | $3,000,000 | - | $1,000,000 | $2,500,000 | $3,500,000 | $3,500,000 | UFA | |
| 2023-24 | 31 | M-NTC | $3,000,000 | $3,000,000 | - | - | $3,500,000 | $3,500,000 | $3,500,000 | UFA | |
| Total | - | $1,000,000 | $8,000,000 | $9,000,000 | $9,000,000 |
Derek Forbort signed a $1,000,000 1-year contract with the Winnipeg Jets and General Manager Kevin Cheveldayoff on October 11, 2020 with an AAV of $1,000,000. This contract will start in 2020-21 and end after the 2020-21 season. In the first season of the contract the cap hit was equivalent to 1.23% of the salary cap.
Standard Contract (UFA) ( ) (0 ratings)
| Season | Age* | Clause | Cap Hit | AAV | Perf. Bonus | Sign. Bonus | Salary | Compensation | Minors Salary | Status | |
|---|---|---|---|---|---|---|---|---|---|---|---|
| 2020-21 | 28 | $1,000,000 | $1,000,000 | - | - | $1,000,000 | $1,000,000 | $1,000,000 | UFA | ||
| Total | - | - | $1,000,000 | $1,000,000 | $1,000,000 |
Derek Forbort signed a $5,050,000 2-year contract with the Los Angeles Kings and General Manager Rob Blake on October 19, 2017 with an AAV of $2,525,000. This contract will start in 2018-19 and end after the 2019-20 season. In the first season of the contract the cap hit was equivalent to 3.18% of the salary cap.
Standard Contract (RFA) ( ) (0 ratings)
| Season | Age* | Clause | Cap Hit | AAV | Perf. Bonus | Sign. Bonus | Salary | Compensation | Minors Salary | Status | |
|---|---|---|---|---|---|---|---|---|---|---|---|
| 2018-19 | 26 | $2,525,000 | $2,525,000 | - | $150,000 | $2,100,000 | $2,250,000 | $2,250,000 | RFA-arb | ||
| 2019-20 | 27 | $2,525,000 | $2,525,000 | - | - | $2,800,000 | $2,800,000 | $2,800,000 | UFA | ||
| Total | - | $150,000 | $4,900,000 | $5,050,000 | $5,050,000 |
Derek Forbort signed a $1,300,000 2-year contract with the Los Angeles Kings and General Manager Dean Lombardi on July 9, 2016 with an AAV of $650,000. This contract will start in 2016-17 and end after the 2017-18 season. In the first season of the contract the cap hit was equivalent to 0.89% of the salary cap.
Standard Contract (RFA) ( ) (0 ratings)
| Season | Age* | Clause | Cap Hit | AAV | Perf. Bonus | Sign. Bonus | Salary | Compensation | Minors Salary | Status | |
|---|---|---|---|---|---|---|---|---|---|---|---|
| 2016-17 | 24 | $650,000 | $650,000 | - | - | $650,000 | $650,000 | $100,000 | RFA-arb | ||
| 2017-18 | 25 | $650,000 | $650,000 | - | - | $650,000 | $650,000 | $400,000 | RFA-arb | ||
| Total | - | - | $1,300,000 | $1,300,000 | $500,000 |
Derek Forbort signed a $2,590,000 3-year contract with the Los Angeles Kings and General Manager Dean Lombardi on April 6, 2013 with an AAV of $863,333. This contract will start in 2013-14 and end after the 2015-16 season. In the first season of the contract the cap hit was equivalent to 1.34% of the salary cap.
Entry Level Contract ( ) (0 ratings)
| Season | Age* | Clause | Cap Hit | AAV | Perf. Bonus | Sign. Bonus | Salary | Compensation | Minors Salary | Status | |
|---|---|---|---|---|---|---|---|---|---|---|---|
| 2013-14 | 21 | $863,333 | $900,000 | $110,000 | $90,000 | $700,000 | $790,000 | $67,500 | ELC | ||
| 2014-15 | 22 | $863,333 | $900,000 | - | $90,000 | $810,000 | $900,000 | $67,500 | ELC | ||
| 2015-16 | 23 | $863,333 | $900,000 | - | $90,000 | $810,000 | $900,000 | $67,500 | ELC | ||
| Total | $110,000 | $270,000 | $2,320,000 | $2,590,000 | $202,500 |
Career Statistics
| Regular Season | Playoffs | |||||||||||||||||||
|---|---|---|---|---|---|---|---|---|---|---|---|---|---|---|---|---|---|---|---|---|
| Season | League | Team | GP | G | A | Pts | +/- | PIM | Shots | Sh% | TOI/G | GP | G | A | Pts | +/- | PIM | Shots | Sh% | TOI/G |
| 2008-09 | High-MN | Duluth East | 25 | 7 | 21 | 28 | ||||||||||||||
| 2008-09 | U-17 | USNTDP | 7 | 1 | 4 | 5 | 4 | |||||||||||||
| 2008-09 | NAHL | USNTDP | 2 | 0 | 1 | 1 | 6 | |||||||||||||
| 2008-09 | USHS-MN | Duluth East High | 3 | 2 | 4 | 6 | 4 | |||||||||||||
| 2009-10 | U-18 | USNTDP | 39 | 1 | 13 | 14 | 20 | |||||||||||||
| 2009-10 | USHL | USNTDP | 26 | 4 | 10 | 14 | 26 | |||||||||||||
| 2009-10 | WJ18-A | USA | 7 | 0 | 2 | 2 | 6 | |||||||||||||
| 2010-11 | WCHA | North Dakota | 38 | 0 | 15 | 15 | 26 | |||||||||||||
| 2010-11 | WJC-A | USA | 6 | 0 | 0 | 0 | ||||||||||||||
| 2011-12 | WCHA | North Dakota | 35 | 2 | 11 | 13 | 28 | |||||||||||||
| 2011-12 | WJC-A | USA | 3 | 0 | 2 | 2 | ||||||||||||||
| 2012-13 | WCHA | North Dakota | 42 | 4 | 13 | 17 | 22 | |||||||||||||
| 2012-13 | AHL | Manchester | 6 | 0 | 1 | 1 | +5 | 2 | 0.0 | 4 | -2 | 4 | 4 | 0.0 | ||||||
| 2013-14 | AHL | Manchester | 74 | 1 | 16 | 17 | +19 | 42 | 59 | 170.0 | 3 | 3 | 0.0 | |||||||
| 2014-15 | AHL | Manchester | 67 | 4 | 11 | 15 | +23 | 52 | 100 | 400.0 | 19 | 6 | 6 | +10 | 12 | 25 | 0.0 | |||
| 2015-16 | NHL | Los Angeles Kings | 14 | 1 | 1 | 2 | -1 | 17 | 14 | 7.1 | 11:03 | |||||||||
| 2015-16 | AHL | Ontario | 40 | 2 | 8 | 10 | +13 | 40 | 66 | 300.0 | 13 | 2 | 2 | +1 | 14 | 0.0 | ||||
| 2016-17 | NHL | Los Angeles Kings | 82 | 2 | 16 | 18 | +8 | 54 | 100 | 2.0 | 20:07 | |||||||||
| 2017-18 | NHL | Los Angeles Kings | 78 | 1 | 17 | 18 | +18 | 49 | 78 | 1.3 | 20:47 | |||||||||
| 2018-19 | NHL | Los Angeles Kings | 81 | 2 | 12 | 14 | -13 | 52 | 75 | 2.7 | 20:45 | |||||||||
| 2019-20 | NHL | Los Angeles Kings | 13 | 0 | 1 | 1 | -4 | 4 | 15 | 0.0 | 17:51 | |||||||||
| 2019-20 | AHL | Ontario Reign | 5 | 1 | 0 | 1 | -3 | 5 | ||||||||||||
| 2019-20 | NHL | Calgary Flames | 7 | 0 | 0 | 0 | -1 | 7 | 0.0 | 17:44 | 10 | 1 | 1 | 2 | -1 | 2 | 11 | 9.1 | 17:29 | |
| 2020-21 | NHL | Winnipeg Jets | 56 | 2 | 10 | 12 | +1 | 35 | 67 | 3.0 | 20:45 | 8 | 1 | 1 | -1 | 14 | 7.1 | 24:38 | ||
| 2021-22 | NHL | Boston Bruins | 76 | 4 | 10 | 14 | +2 | 48 | 64 | 6.3 | 18:07 | 7 | 1 | 1 | -1 | 12 | 7 | 14.3 | 18:23 | |
| 2022-23 | NHL | Boston Bruins | 54 | 5 | 7 | 12 | +12 | 23 | 38 | 13.2 | 17:44 | 7 | 1 | 1 | -1 | 19 | 4 | 0.0 | 15:26 | |
| 2023-24 | AHL | Providence Bruins | 2 | 0 | 0 | 0 | -1 | 2 | ||||||||||||
| 2023-24 | NHL | Boston Bruins | 35 | 0 | 4 | 4 | +8 | 17 | 22 | 0.0 | 17:48 | 3 | 1 | 0.0 | 17:49 | |||||
| 2024-25 | NHL | Vancouver Canucks | 54 | 2 | 9 | 11 | -7 | 45 | 39 | 5.1 | 17:06 | |||||||||
| 2025-26 | NHL | Vancouver Canucks | 2 | 0 | 0 | 0 | 2 | 1 | 0.0 | 13:56 | ||||||||||
| NHL Career | 552 | 19 | 87 | 106 | +23 | 346 | 520 | 3.6 | 19:05 | 35 | 3 | 2 | 5 | -4 | 33 | 37 | 8.1 | 18:55 | ||