
 Danton Heinen
| Position | Left Wing / Right Wing | Current Team | Columbus Blue Jackets |
| Shoots | Left | Current Contract | 1 year ($1,000.0K CapHit) |
| Height | 6'2" | Expires | 2026-27 |
| Weight (lbs) | 187 | Expiry Age (Jun 30) | 31 |
| Age (DOB) | 31 (July 5, 1995) | Expiry Status | UFA |
| Drafted | 2014, Round 4, Overall 116 (BOS) |
| Date | Team | Transaction | |
|---|---|---|---|
| Jul 22, 2026 | Columbus Blue Jackets | Signed 1 year @ $1.000M AAV starting in 2026-27 | |
| Jan 1, 2026 | Columbus Blue Jackets | Recalled from AHL | |
| Dec 29, 2025 | Columbus Blue Jackets | Acquired from Pittsburgh Penguins | |
| Dec 29, 2025 | Pittsburgh Penguins | Traded to Columbus Blue Jackets | |
| Dec 29, 2025 | Pittsburgh Penguins | Cleared Waivers | |
| Dec 28, 2025 | Pittsburgh Penguins | Placed on Waivers | |
| Dec 9, 2025 | Pittsburgh Penguins | Recalled from AHL | |
| Nov 30, 2025 | Pittsburgh Penguins | Assigned to AHL | |
| Nov 4, 2025 | Pittsburgh Penguins | Recalled from AHL | |
| Oct 6, 2025 | Pittsburgh Penguins | Assigned to AHL | |
| Oct 3, 2025 | Pittsburgh Penguins | Cleared Waivers | |
| Oct 2, 2025 | Pittsburgh Penguins | Placed on Waivers | |
| Feb 1, 2025 | Pittsburgh Penguins | Acquired from Vancouver Canucks | |
| Feb 1, 2025 | Vancouver Canucks | Traded to Pittsburgh Penguins | |
| Jul 1, 2024 | Vancouver Canucks | Signed 2 years @ $2.250M AAV starting in 2024-25 | |
| Oct 30, 2023 | Boston Bruins | Signed 1 year @ $775K AAV starting in 2023-24 | |
| Jul 27, 2022 | Pittsburgh Penguins | Signed 1 year @ $1.000M AAV starting in 2022-23 | |
| Jul 29, 2021 | Pittsburgh Penguins | Signed 1 year @ $1.100M AAV starting in 2021-22 | |
| Jul 9, 2019 | Boston Bruins | Signed 2 years @ $2.800M AAV starting in 2019-20 | |
| Apr 11, 2016 | Boston Bruins | Signed to an entry level contract. |
Player Card(s)

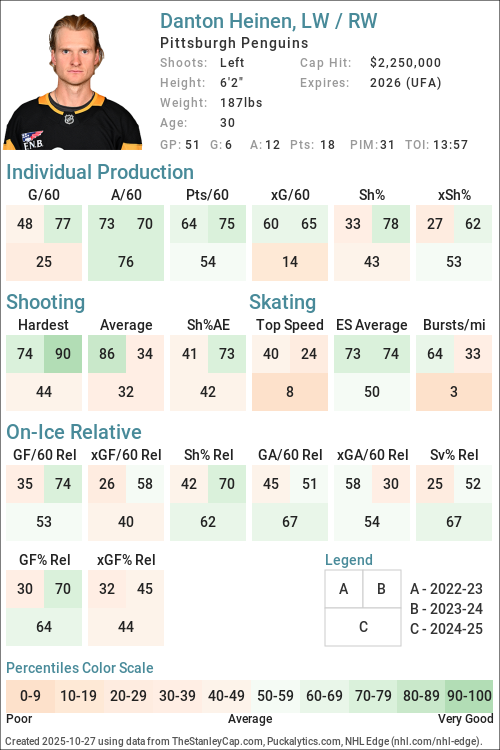
URL: https://thestanleycap.com/cdn/player_cards/20252026/danton-heinen-8478046.png
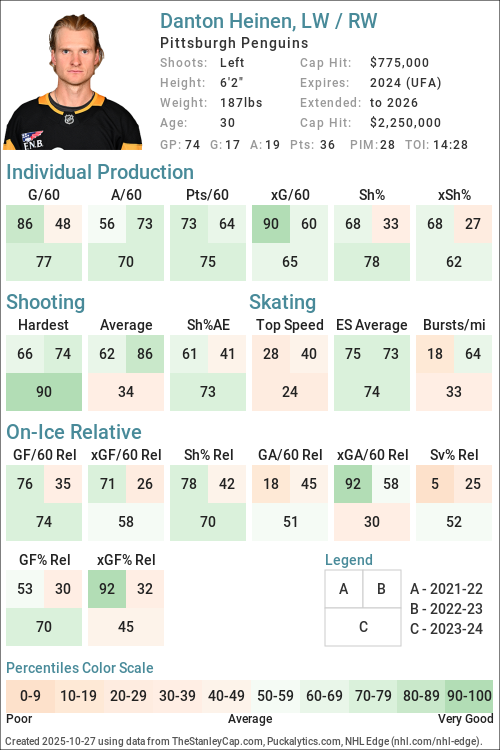
URL: https://thestanleycap.com/cdn/player_cards/20242025/danton-heinen-8478046.png
URL: https://thestanleycap.com/cdn/player_cards/20232024/danton-heinen-8478046.png
About Player Cards
Player cards present an infographic of a players performance using a series of Player Archetypes developed for Puckalytics.com and TheStanleyCap.com. The boxes in the rink image show the archetype ratings for the season specified in the card while the graphs to the right show the five-year trends for those archetypes.
Except for Faceoffs, the values shown are the players z-score (standard deviation from the mean) for the specific metric used to calculate the archetype values. When calculating z-scores forwards were compared to forwards and defensemen were compared to defensemen. Positive values indicate the player is above average and shaded in blue, while negative values indicate the player is below average and shaded in pink. The five year trend charts show a range of -4.0 to 4.0.
The value shown for Faceoffs is the faceoff winning percentage rather than their z-score with winning percentages below 50 in pink shades and above 50 in blue shades.
All archetypes are 5v5 except 5v4 TOI, 4v5 TOI, Skating (even strength) and Faceoffs (all situations). Archetypes use regular season data only.
Archetypes Summary
- Sniper - Measures the to score above the expected goal rate.
- Rebound - Measures the percent of a players shot attempts that come from rebounds (forwards only).
- 5v4 TOI - Powerplay ice time, calculated as the percentage of his teams 5v4 ice time that the player was on the ice for.
- Shooter - Measures whether a players points come from shots (goals or assists on rebounds from his shots).
- Producer - Measures a players ability to produce goals and assists, adjusted for quality of teammates.
- Playmaker - Measures whether a players points come from passes.
- Drive - Measures a players ability to drive puck possession and generate shot attempts for his team.
- Rush - Measures the percent of a players shot attempts that come from rush plays
- Possession - An indicator of a players ability to improve his teams puck possession game.
- Faceoffs - Faceoff Winning Percentage (min. 75 faceoffs taken).
- 5v5 TOI - The percentage of his teams 5v5 TOI that the player was on the ice for.
- Suppress - Measures a players ability to suppress opponent puck possession and shot attempts against.
- Skating - An indicator of a players skating ability, or speed bursts above 20mph per mile skated.
- Defend - An indicator of a players ability to suppress shot quality against.
- 4v5 TOI - Penalty Kill ice time, calculated as the percentage of his teams 4v5 ice time that the player was on the ice for.
Data Sources
- Salary data is from TheStanleyCap.com
- Skating data is from NHL Edge
- Other statistics are from Puckalytics.com and derived from data from NHL.com
Terms of Use
You are free to use include player cards in written articles, share on social media, or on other public websites under the following conditions:
- You credit TheStanleyCap.com as the source and provide a link back to TheStanleyCap.com or this player page.
- You do not mass copy/duplicate/publish dozens or hundreds of player cards. A few, or a handful for a written article is fine. Be reasonable. Fair use rules apply.
- If you are a high-traffic website you must download and host the image(s) on your site rather than overload TheStanleyCap servers with traffic.
Note: Player cards will update daily throughout the season so if you want to include snapshot then you must download the image.
If you have any questions, send an e-mail to the e-mail address at the top of this page.
Read Introducing Player Archetypes on HockeyAnalysis.com for more details on archetype calculations.
Core Archetypes
| Season | Team(s) | GP | TOI | Producer | Playmaker | Shooter | Sniper | Rebound | Rush | Skating | Defend |
|---|---|---|---|---|---|---|---|---|---|---|---|
| 2016-17 | BOS | 8 | -2.27 | -1.45 | -1.43 | -1.68 | 2.21 | -1.95 | - | 0.69 | |
| 2017-18 | BOS | 77 | 0.75 | 0.06 | 0.71 | 0.66 | 1.58 | 0.48 | - | 0.69 | |
| 2018-19 | BOS | 77 | 0.01 | 0.38 | -0.49 | 0.12 | 0.40 | -0.12 | - | 1.82 | |
| 2019-20 | ANA, BOS | 67 | -0.09 | 0.44 | -0.63 | -0.38 | 0.17 | 0.89 | - | 0.29 | |
| 2020-21 | ANA | 43 | -0.27 | -0.40 | -0.07 | -0.11 | 0.52 | -0.01 | - | 0.38 | |
| 2021-22 | PIT | 76 | 0.33 | -0.47 | 0.93 | 0.22 | 1.66 | 0.94 | -0.84 | -1.66 | |
| 2022-23 | PIT | 65 | 0.77 | 1.27 | -0.30 | -0.53 | 1.16 | -1.44 | 0.20 | -0.62 | |
| 2023-24 | BOS | 74 | 0.50 | 0.33 | 0.20 | 0.63 | 1.91 | -0.27 | -0.57 | 0.09 | |
| 2024-25 | PIT, VAN | 79 | 0.03 | 0.89 | -0.82 | -0.02 | 0.22 | 0.38 | -1.37 | 0.44 | |
| 2025-26 | CBJ, PIT | 46 | -0.80 | -0.97 | -0.18 | 0.48 | 1.15 | -0.75 | -0.56 | 0.34 |
Situational and Secondary Archetypes
| Season | Team(s) | GP | TOI | 5v5 TOI | 5v4 TOI | 4v5 TOI | Possession | Drive | Suppress | Faceoffs |
|---|---|---|---|---|---|---|---|---|---|---|
| 2016-17 | BOS | 8 | -0.06 | -0.36 | -2.02 | -1.20 | -1.59 | -0.14 | - | |
| 2017-18 | BOS | 77 | 0.01 | 0.08 | -1.56 | 0.66 | 0.13 | 0.91 | - | |
| 2018-19 | BOS | 77 | 0.01 | -0.51 | -1.77 | -0.17 | -0.31 | 0.10 | - | |
| 2019-20 | ANA, BOS | 67 | -0.10 | 0.09 | -1.76 | -0.95 | -0.75 | -0.61 | - | |
| 2020-21 | ANA | 43 | -0.05 | -0.84 | -0.27 | 0.17 | 0.37 | -0.28 | - | |
| 2021-22 | PIT | 76 | -0.67 | -0.75 | -2.00 | 0.80 | 0.30 | 1.00 | - | |
| 2022-23 | PIT | 65 | -1.24 | -1.24 | -1.89 | -0.70 | -1.04 | 0.26 | - | |
| 2023-24 | BOS | 74 | 0.19 | -1.65 | -0.20 | 0.18 | 0.38 | -0.37 | - | |
| 2024-25 | PIT, VAN | 79 | -0.53 | -1.19 | -0.57 | 0.18 | -0.04 | 0.33 | - | |
| 2025-26 | CBJ, PIT | 46 | -0.91 | -1.75 | -1.68 | 0.72 | -0.26 | 1.34 | - |
5v5 Individual Stats
| Season | Team(s) | GP | TOI | G/60 | A/60 | Pts/60 | xG/60 | GAE/60 | Sh% | xSh% | Sh%AE | %SA Rush | %SA Reb. |
|---|---|---|---|---|---|---|---|---|---|---|---|---|---|
| 2016-17 | BOS | 8 | 87:57 | 0.00 | 0.00 | 0.00 | 0.29 | -0.29 | 0.00 | 6.05 | -6.05 | 0.00 | 10.00 |
| 2017-18 | BOS | 77 | 928:13 | 0.78 | 1.16 | 1.94 | 0.62 | 0.15 | 11.32 | 9.11 | 2.21 | 4.93 | 8.45 |
| 2018-19 | BOS | 77 | 936:38 | 0.64 | 0.96 | 1.60 | 0.62 | 0.02 | 10.75 | 10.49 | 0.26 | 3.85 | 6.15 |
| 2019-20 | ANA | 9 | 117:20 | 1.53 | 0.51 | 2.05 | 1.25 | 0.29 | 20.00 | 16.25 | 3.75 | 0.00 | 13.64 |
| 2019-20 | BOS | 58 | 674:26 | 0.36 | 1.07 | 1.42 | 0.52 | -0.16 | 5.97 | 8.64 | -2.67 | 7.32 | 4.88 |
| 2019-20 | ANA, BOS | 67 | 791:46 | 0.53 | 0.99 | 1.52 | 0.62 | -0.09 | 8.54 | 10.03 | -1.50 | 5.77 | 6.73 |
| 2020-21 | ANA | 43 | 531:00 | 0.68 | 0.68 | 1.36 | 0.70 | -0.02 | 10.17 | 10.53 | -0.37 | 3.70 | 7.41 |
| 2021-22 | PIT | 76 | 853:48 | 1.05 | 0.98 | 2.04 | 0.99 | 0.07 | 11.72 | 10.99 | 0.73 | 5.88 | 10.59 |
| 2022-23 | PIT | 65 | 639:01 | 0.66 | 1.22 | 1.88 | 0.85 | -0.19 | 8.33 | 10.80 | -2.47 | 0.91 | 10.91 |
| 2023-24 | BOS | 74 | 927:42 | 0.91 | 1.10 | 2.00 | 0.74 | 0.17 | 13.08 | 10.63 | 2.45 | 3.31 | 13.91 |
| 2024-25 | VAN | 51 | 587:03 | 0.51 | 1.02 | 1.53 | 0.41 | 0.10 | 12.82 | 10.37 | 2.45 | 3.51 | 8.77 |
| 2024-25 | PIT | 28 | 311:55 | 0.38 | 1.35 | 1.73 | 0.59 | -0.21 | 6.45 | 9.95 | -3.49 | 2.33 | 6.98 |
| 2024-25 | PIT, VAN | 79 | 898:58 | 0.47 | 1.13 | 1.60 | 0.48 | -0.01 | 10.00 | 10.18 | -0.18 | 3.00 | 8.00 |
| 2025-26 | CBJ | 33 | 356:06 | 0.84 | 0.84 | 1.68 | 0.65 | 0.19 | 16.67 | 12.93 | 3.74 | 2.17 | 10.87 |
| 2025-26 | PIT | 13 | 133:22 | 0.45 | 0.00 | 0.45 | 0.70 | -0.25 | 7.69 | 11.99 | -4.30 | 0.00 | 13.64 |
| 2025-26 | CBJ, PIT | 46 | 489:28 | 0.74 | 0.61 | 1.35 | 0.67 | 0.07 | 13.95 | 12.65 | 1.31 | 1.47 | 11.76 |
5v5 On Ice Stats
| Season | Team(s) | GP | TOI | SAF/60 | GF/60 | xGF/60 | SAA/60 | GA/60 | xGA/60 | GF% | xGF% | xGF Rel | xGA Rel | xGF% Rel |
|---|---|---|---|---|---|---|---|---|---|---|---|---|---|---|
| 2016-17 | BOS | 8 | 87:57 | 40.25 | 0.68 | 1.82 | 36.16 | 2.05 | 1.82 | 25.00 | 49.96 | -0.76 | -0.44 | -3.24 |
| 2017-18 | BOS | 77 | 928:13 | 45.31 | 2.65 | 2.48 | 36.39 | 1.68 | 1.71 | 61.19 | 59.18 | 0.00 | -0.43 | 5.50 |
| 2018-19 | BOS | 77 | 936:38 | 43.24 | 2.31 | 2.47 | 37.92 | 1.28 | 2.14 | 64.29 | 53.64 | -0.01 | -0.16 | 1.61 |
| 2019-20 | ANA | 9 | 117:20 | 41.42 | 2.05 | 2.88 | 51.14 | 4.09 | 3.69 | 33.33 | 43.86 | 0.66 | 1.24 | -3.73 |
| 2019-20 | BOS | 58 | 674:26 | 38.08 | 2.22 | 2.18 | 40.57 | 1.60 | 2.01 | 58.14 | 51.99 | -0.18 | -0.16 | -0.03 |
| 2019-20 | ANA, BOS | 67 | 791:46 | 38.57 | 2.20 | 2.28 | 42.13 | 1.97 | 2.26 | 52.73 | 50.25 | -0.05 | 0.05 | -1.16 |
| 2020-21 | ANA | 43 | 531:00 | 38.08 | 1.92 | 2.20 | 42.26 | 2.60 | 2.63 | 42.50 | 45.51 | 0.06 | 0.07 | -0.01 |
| 2021-22 | PIT | 76 | 853:48 | 46.52 | 3.16 | 2.98 | 37.39 | 2.67 | 2.14 | 54.22 | 58.26 | 0.24 | -0.32 | 5.55 |
| 2022-23 | PIT | 65 | 639:01 | 41.78 | 2.35 | 2.83 | 41.88 | 2.72 | 2.52 | 46.30 | 52.91 | -0.19 | -0.17 | -0.04 |
| 2023-24 | BOS | 74 | 927:42 | 39.97 | 3.04 | 2.42 | 44.11 | 2.13 | 2.44 | 58.75 | 49.77 | 0.04 | 0.03 | 0.19 |
| 2024-25 | VAN | 51 | 587:03 | 36.28 | 2.56 | 1.97 | 37.41 | 2.76 | 2.22 | 48.08 | 47.07 | -0.10 | 0.02 | -1.43 |
| 2024-25 | PIT | 28 | 311:55 | 41.16 | 2.12 | 2.42 | 40.59 | 1.73 | 2.53 | 55.00 | 48.90 | -0.07 | -0.03 | -0.46 |
| 2024-25 | PIT, VAN | 79 | 898:58 | 37.98 | 2.40 | 2.13 | 38.51 | 2.40 | 2.32 | 50.00 | 47.78 | -0.10 | -0.01 | -1.08 |
| 2025-26 | CBJ | 33 | 356:06 | 40.27 | 3.03 | 2.60 | 36.56 | 2.02 | 1.88 | 60.00 | 58.08 | -0.14 | -0.61 | 5.62 |
| 2025-26 | PIT | 13 | 133:22 | 43.19 | 1.35 | 2.34 | 30.14 | 1.35 | 1.50 | 50.00 | 61.03 | -0.29 | -1.07 | 10.41 |
| 2025-26 | CBJ, PIT | 46 | 489:28 | 41.07 | 2.57 | 2.53 | 34.81 | 1.84 | 1.77 | 58.33 | 58.80 | -0.18 | -0.73 | 6.85 |
NHL Edge Stats
| Skating | Shooting | Zone Time | |||||||||||
|---|---|---|---|---|---|---|---|---|---|---|---|---|---|
| Season | GP | Top Speed | Bursts>20/mi | Avg. Speed | Top Speed | Avg. Speed | %Long Range | %Mid Range | %High Danger | ES DZ% | ES NZ% | ES OZ% | |
| This table is for Basic and Premium subscribers only. To view please login to and/or subscribe to one of our subscription plans. | |||||||||||||
Legend
| Percentile 0-25 | Percentile 25-50 | Percentile 50-75 | Percentile 75-100 |
5v5 Lines
| Season | Teammate | Teammate | Team | TOI | GF/60 | GA/60 | GF% | xGF/60 | xGA/60 | xGF% | xGF Rel | xGA Rel | xGF% Rel |
|---|
Glossary
| Type | Statistic | Definition |
|---|---|---|
| Individual | G/60 | Goals Against per 60 minutes. |
| Individual | A/60 | Assists per 60 minutes. |
| Individual | Pts/60 | Points per 60 minutes. |
| Individual | xG/60 | Expected Goals per 60 minutes. |
| Individual | GAE/60 | Goals Above Expected (G/60 - xG/60). |
| Individual | Sh% | Shooting Percentage. |
| Individual | xSh% | Expected Shooting Percentage. |
| Individual | Sh%AE | Shooting percentage above expected (Sh% - xSh%). |
| Individual | %SA Rush | Percentage of shot attempts determined to be on the rush. |
| Individual | %SA Reb. | Percentage of shot attempts determined to be from rebounds. |
| On Ice | SAF/60 | Shot Attempts For per 60 minutes. |
| On Ice | GF/60 | Goals For per 60 minutes. |
| On Ice | xGF/60 | Expected Goals For per 60 minutes. |
| On Ice | SAA/60 | Shot Attempts Against per 60 minutes (lower is better). |
| On Ice | GA/60 | Goals Against per 60 minutes (lower is better). |
| On Ice | xGA/60 | Expected Goals Against per 60 minutes (lower is better). |
| On Ice | GF% | Goals For Percentage = Goals For / (Goals For + Goals Against) |
| On Ice | xGF% | Expected Goals For Percentage = Expected Goals For / (Expected Goals For + Expected Goals Against) |
| On Ice | xGF Rel | xGF/60 when On Ice - xGF/60 when not On Ice. |
| On Ice | xGA Rel | xGA/60 when On Ice - xGA/60 when not On Ice (lower is better). |
| On Ice | xGF% Rel | xGF% when On Ice - xGF% when not On Ice. |
News and Opinions
-
Columbus re-ups Danton Heinen for one season in a solid move for the organization's depth at Union Blue (Wed Jul 22, 2026)
-
Five Moves That Can Improve the Devils While Protecting Cap Space at All About the Jersey (Sat Jul 11, 2026)
-
Blue Jackets 2025-26 player review, Danton Heinen found a role at Union Blue (Tue May 19, 2026)
-
3 Blue Jackets Unrestricted Free Agents That Should Be Re-Signed at The Hockey Writers (Sat Apr 18, 2026)
-
CBJ 5, SEA 2: Five Different Blue Jackets Score, Werenski Has Another Three-Assist Night As CBJ Defeat Kraken To Continue Win Streak at 1st Ohio Battery (Sat Mar 21, 2026)
-
Penguins getting strong inputs from make or break players at Yahoo Sports NHL (Fri Feb 20, 2026)
-
Penguins getting strong inputs from make or break players at Pens Burgh (Fri Feb 20, 2026)
-
CBJ 4, PIT 3 (SO): Merzlikins, Coyle Come Up Big In Extra Time As Blue Jackets Win Fourth Straight at 1st Ohio Battery (Sat Jan 17, 2026)
-
Blue Jackets’ News & Rumors: Olympian Werenski, Heinen & More at The Hockey Writers (Sat Jan 3, 2026)
-
NHL Notebook: Penguins acquire Yegor Chinakhov from Blue Jackets for Danton Heinen, two picks at Canucks Army (Mon Dec 29, 2025)
-
Blue Jackets Trade Yegor Chinakhov To Penguins In Exchange For Danton Heinen, Draft Picks at 1st Ohio Battery (Mon Dec 29, 2025)
-
Ex-Canucks Ethan Bear and Danton Heinen placed on NHL waivers at Canucks Army (Sun Dec 28, 2025)
-
Heinen, Graves Look To Take Advantage Of Second-Chance Opportunity With Penguins at Yahoo Sports NHL (Thu Nov 6, 2025)
-
Penguins waive six, including Danton Heinen at Pens Burgh (Thu Oct 2, 2025)
-
Is There Room For This Penguins' Winger In 2025-26? at Yahoo Sports (Sat Sep 6, 2025)
-
Trade Idea Sends Penguins Forward Back to Boston for Third Bruins Stint at Yahoo Sports (Sat Aug 2, 2025)
-
The Anaheim Ducks 2021 Expansion Draft Strategy at Pucks of a Feather (Thu Apr 22, 2021)
Current Contract
Danton Heinen signed a $1,000,000 1-year contract with the Columbus Blue Jackets and General Manager Don Waddell on July 22, 2026 with an AAV of $1,000,000. This contract will start in 2026-27 and end after the 2026-27 season. In the first season of the contract the cap hit was equivalent to 0.96% of the salary cap.
Standard Contract (UFA) ( ) (0 ratings)
Danton Heinen signed a $4,500,000 2-year contract with the Vancouver Canucks and General Manager Patrik Alvin on July 1, 2024 with an AAV of $2,250,000. This contract will start in 2024-25 and end after the 2025-26 season. In the first season of the contract the cap hit was equivalent to 2.56% of the salary cap.
Standard Contract (UFA) ( ) (0 ratings)
| Season | Age* | Clause | Cap Hit | AAV | Perf. Bonus | Sign. Bonus | Salary | Compensation | Minors Salary | Status | |
|---|---|---|---|---|---|---|---|---|---|---|---|
| 2024-25 | 29 | M-NTC | $2,250,000 | $2,250,000 | - | $1,725,000 | $775,000 | $2,500,000 | $2,500,000 | UFA | |
| 2025-26 | 30 | M-NTC | $2,250,000 | $2,250,000 | - | $1,225,000 | $775,000 | $2,000,000 | $2,000,000 | UFA | |
| Total | - | $2,950,000 | $1,550,000 | $4,500,000 | $4,500,000 |
Danton Heinen signed a $775,000 1-year contract with the Boston Bruins and General Manager Don Sweeney on October 30, 2023 with an AAV of $775,000. This contract will start in 2023-24 and end after the 2023-24 season. In the first season of the contract the cap hit was equivalent to 0.93% of the salary cap.
Standard Contract (UFA) ( ) (0 ratings)
| Season | Age* | Clause | Cap Hit | AAV | Perf. Bonus | Sign. Bonus | Salary | Compensation | Minors Salary | Status | |
|---|---|---|---|---|---|---|---|---|---|---|---|
| 2023-24 | 28 | $775,000 | $775,000 | - | - | $775,000 | $775,000 | $775,000 | UFA | ||
| Total | - | - | $775,000 | $775,000 | $775,000 |
Danton Heinen signed a $1,000,000 1-year contract with the Pittsburgh Penguins and General Manager Ron Hextall on July 27, 2022 with an AAV of $1,000,000. This contract will start in 2022-23 and end after the 2022-23 season. In the first season of the contract the cap hit was equivalent to 1.21% of the salary cap.
Standard Contract (UFA) ( ) (0 ratings)
| Season | Age* | Clause | Cap Hit | AAV | Perf. Bonus | Sign. Bonus | Salary | Compensation | Minors Salary | Status | |
|---|---|---|---|---|---|---|---|---|---|---|---|
| 2022-23 | 27 | $1,000,000 | $1,000,000 | - | - | $1,000,000 | $1,000,000 | $1,000,000 | RFA-arb | ||
| Total | - | - | $1,000,000 | $1,000,000 | $1,000,000 |
Danton Heinen signed a $1,100,000 1-year contract with the Pittsburgh Penguins and General Manager Ron Hextall on July 29, 2021 with an AAV of $1,100,000. This contract will start in 2021-22 and end after the 2021-22 season. In the first season of the contract the cap hit was equivalent to 1.35% of the salary cap.
Standard Contract (UFA) ( ) (0 ratings)
| Season | Age* | Clause | Cap Hit | AAV | Perf. Bonus | Sign. Bonus | Salary | Compensation | Minors Salary | Status | |
|---|---|---|---|---|---|---|---|---|---|---|---|
| 2021-22 | 26 | $1,100,000 | $1,100,000 | - | - | $1,100,000 | $1,100,000 | $1,100,000 | RFA-arb | ||
| Total | - | - | $1,100,000 | $1,100,000 | $1,100,000 |
Danton Heinen signed a $5,600,000 2-year contract with the Boston Bruins and General Manager Don Sweeney on July 9, 2019 with an AAV of $2,800,000. This contract will start in 2019-20 and end after the 2020-21 season. In the first season of the contract the cap hit was equivalent to 3.44% of the salary cap.
Standard Contract (RFA) ( ) (0 ratings)
| Season | Age* | Clause | Cap Hit | AAV | Perf. Bonus | Sign. Bonus | Salary | Compensation | Minors Salary | Status | |
|---|---|---|---|---|---|---|---|---|---|---|---|
| 2019-20 | 24 | $2,800,000 | $2,800,000 | - | - | $2,825,000 | $2,825,000 | $2,825,000 | RFA-arb | ||
| 2020-21 | 25 | $2,800,000 | $2,800,000 | - | - | $2,775,000 | $2,775,000 | $2,775,000 | RFA-arb | ||
| Total | - | - | $5,600,000 | $5,600,000 | $5,600,000 |
Danton Heinen signed a $2,617,500 3-year contract with the Boston Bruins and General Manager Don Sweeney on April 11, 2016 with an AAV of $872,500. This contract will start in 2016-17 and end after the 2018-19 season. In the first season of the contract the cap hit was equivalent to 1.20% of the salary cap.
Entry Level Contract ( ) (0 ratings)
| Season | Age* | Clause | Cap Hit | AAV | Perf. Bonus | Sign. Bonus | Salary | Compensation | Minors Salary | Status | |
|---|---|---|---|---|---|---|---|---|---|---|---|
| 2016-17 | 21 | $872,500 | $995,833 | $157,500 | $92,500 | $675,000 | $767,500 | $70,000 | ELC | ||
| 2017-18 | 22 | $872,500 | $995,833 | - | $92,500 | $832,500 | $925,000 | $70,000 | ELC | ||
| 2018-19 | 23 | $872,500 | $995,833 | $212,500 | $92,500 | $832,500 | $925,000 | $70,000 | ELC | ||
| Total | $370,000 | $277,500 | $2,340,000 | $2,617,500 | $210,000 |
Career Statistics
| Regular Season | Playoffs | |||||||||||||||||||
|---|---|---|---|---|---|---|---|---|---|---|---|---|---|---|---|---|---|---|---|---|
| Season | League | Team | GP | G | A | Pts | +/- | PIM | Shots | Sh% | TOI/G | GP | G | A | Pts | +/- | PIM | Shots | Sh% | TOI/G |
| 2010-11 | BCMML | Valley West Hawks | 4 | 1 | 2 | 3 | ||||||||||||||
| 2010-11 | BC U18 | Valley West Giants U18 AAA | 2 | |||||||||||||||||
| 2011-12 | BCMML | Valley West | 39 | 19 | 24 | 43 | 6 | 2 | 2 | 2 | ||||||||||
| 2012-13 | BCHL | Merritt | 2 | 0 | 2 | 2 | ||||||||||||||
| 2012-13 | PJHL | Richmond | 43 | 21 | 28 | 49 | 4 | 15 | 6 | 8 | 14 | 2 | ||||||||
| 2013-14 | BCHL | Surrey | 57 | 29 | 33 | 62 | 8 | 6 | 2 | 5 | 7 | 2 | ||||||||
| 2014-15 | NCHC | U. of Denver | 40 | 16 | 29 | 45 | 10 | |||||||||||||
| 2015-16 | NCAA | Univ. of Denver | 41 | 20 | 28 | 48 | +19 | 10 | ||||||||||||
| 2015-16 | AHL | Providence | 2 | 0 | 2 | 2 | +1 | 2 | 1 | 0.0 | 2 | +1 | 1 | 0.0 | ||||||
| 2016-17 | NHL | Boston Bruins | 8 | 0 | 0 | 0 | -3 | 2 | 7 | 0.0 | 13:14 | |||||||||
| 2016-17 | AHL | Providence Bruins | 64 | 14 | 30 | 44 | +1 | 14 | 17 | 9 | 9 | 18 | -5 | |||||||
| 2017-18 | AHL | Providence Bruins | 4 | 1 | 7 | 8 | +5 | 2 | ||||||||||||
| 2017-18 | NHL | Boston Bruins | 77 | 16 | 31 | 47 | +10 | 16 | 135 | 11.8 | 15:01 | 9 | 1 | 1 | -1 | 2 | 8 | 12.5 | 12:21 | |
| 2018-19 | NHL | Boston Bruins | 77 | 11 | 23 | 34 | +13 | 16 | 114 | 9.6 | 13:58 | 24 | 2 | 6 | 8 | +7 | 2 | 32 | 6.2 | 13:14 |
| 2019-20 | NHL | Boston Bruins | 58 | 7 | 15 | 22 | +3 | 8 | 90 | 7.8 | 14:11 | |||||||||
| 2019-20 | NHL | Anaheim Ducks | 9 | 3 | 1 | 4 | -5 | 2 | 19 | 15.8 | 16:21 | |||||||||
| 2020-21 | NHL | Anaheim Ducks | 43 | 7 | 7 | 14 | -9 | 76 | 9.2 | 14:46 | ||||||||||
| 2021-22 | NHL | Pittsburgh Penguins | 76 | 18 | 15 | 33 | +6 | 16 | 138 | 13.0 | 12:43 | 7 | 3 | 3 | -1 | 4 | 18 | 16.7 | 15:31 | |
| 2022-23 | NHL | Pittsburgh Penguins | 65 | 8 | 14 | 22 | -5 | 12 | 96 | 8.3 | 10:45 | |||||||||
| 2023-24 | NHL | Boston Bruins | 74 | 17 | 19 | 36 | +16 | 28 | 119 | 14.3 | 14:28 | 8 | 1 | 1 | 10 | 0.0 | 15:18 | |||
| 2024-25 | NHL | Vancouver Canucks | 51 | 6 | 12 | 18 | -1 | 31 | 44 | 13.6 | 13:57 | |||||||||
| 2024-25 | NHL | Pittsburgh Penguins | 28 | 3 | 8 | 11 | +3 | 37 | 8.1 | 12:32 | ||||||||||
| 2025-26 | NHL | Columbus Blue Jackets | 33 | 5 | 5 | 10 | +6 | 8 | 30 | 16.7 | 11:13 | |||||||||
| 2025-26 | NHL | Pittsburgh Penguins | 13 | 1 | 1 | 2 | +1 | 8 | 14 | 7.1 | 11:40 | |||||||||
| 2025-26 | AHL | Wilkes-Barre/Scranton Penguins | 12 | 6 | 11 | 17 | +10 | 6 | ||||||||||||
| NHL Career | 612 | 102 | 151 | 253 | +35 | 147 | 919 | 11.1 | 13:30 | 48 | 6 | 7 | 13 | +5 | 8 | 68 | 8.8 | 13:45 | ||