
 Connor Zary
| Position | Left Wing / Center | Current Team | Calgary Flames |
| Shoots | Left | Current Contract | 3 years ($3.8M CapHit) |
| Height | 6'0" | Expires | 2027-28 |
| Weight (lbs) | 178 | Expiry Age (Jun 30) | 26 |
| Age (DOB) | 24 (Sep 25, 2001) | Expiry Status | RFA-arb |
| Drafted | 2020, Round 1, Overall 24 (CGY) |
| Date | Team | Transaction | |
|---|---|---|---|
| Sep 5, 2025 | Calgary Flames | Signed 3 years @ $3.775M AAV starting in 2025-26 | |
| Mar 18, 2025 | Calgary Flames | Suspension Ended | |
| Mar 13, 2025 | Calgary Flames | Suspension Started | |
| Feb 23, 2025 | Calgary Flames | Activated from IR | |
| Jan 10, 2025 | Calgary Flames | Placed on IR | |
| Dec 31, 2020 | Calgary Flames | Signed to an entry level contract. |
Player Card(s)
URL: https://thestanleycap.com/cdn/player_cards/20252026/connor-zary-8482074.png

URL: https://thestanleycap.com/cdn/player_cards/20242025/connor-zary-8482074.png

URL: https://thestanleycap.com/cdn/player_cards/20232024/connor-zary-8482074.png
About Player Cards
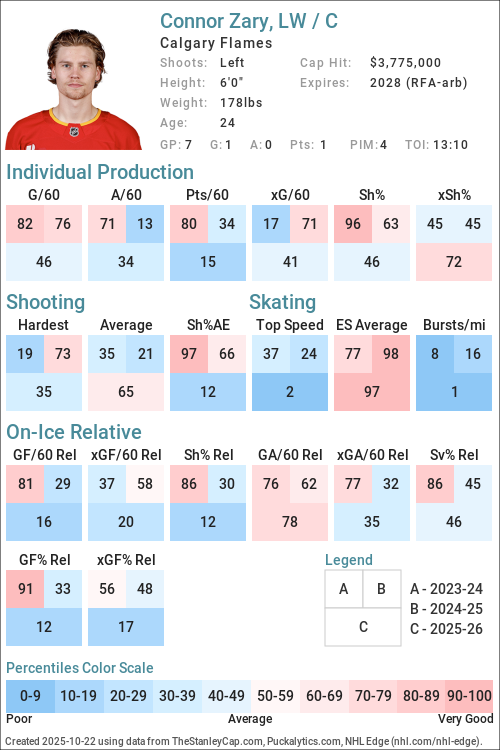
Player cards present an infographic of a players performance using a series of Player Archetypes developed for Puckalytics.com and TheStanleyCap.com. The boxes in the rink image show the archetype ratings for the season specified in the card while the graphs to the right show the five-year trends for those archetypes.
Except for Faceoffs, the values shown are the players z-score (standard deviation from the mean) for the specific metric used to calculate the archetype values. When calculating z-scores forwards were compared to forwards and defensemen were compared to defensemen. Positive values indicate the player is above average and shaded in blue, while negative values indicate the player is below average and shaded in pink. The five year trend charts show a range of -4.0 to 4.0.
The value shown for Faceoffs is the faceoff winning percentage rather than their z-score with winning percentages below 50 in pink shades and above 50 in blue shades.
All archetypes are 5v5 except 5v4 TOI, 4v5 TOI, Skating (even strength) and Faceoffs (all situations). Archetypes use regular season data only.
Archetypes Summary
- Sniper - Measures the to score above the expected goal rate.
- Rebound - Measures the percent of a players shot attempts that come from rebounds (forwards only).
- 5v4 TOI - Powerplay ice time, calculated as the percentage of his teams 5v4 ice time that the player was on the ice for.
- Shooter - Measures whether a players points come from shots (goals or assists on rebounds from his shots).
- Producer - Measures a players ability to produce goals and assists, adjusted for quality of teammates.
- Playmaker - Measures whether a players points come from passes.
- Drive - Measures a players ability to drive puck possession and generate shot attempts for his team.
- Rush - Measures the percent of a players shot attempts that come from rush plays
- Possession - An indicator of a players ability to improve his teams puck possession game.
- Faceoffs - Faceoff Winning Percentage (min. 75 faceoffs taken).
- 5v5 TOI - The percentage of his teams 5v5 TOI that the player was on the ice for.
- Suppress - Measures a players ability to suppress opponent puck possession and shot attempts against.
- Skating - An indicator of a players skating ability, or speed bursts above 20mph per mile skated.
- Defend - An indicator of a players ability to suppress shot quality against.
- 4v5 TOI - Penalty Kill ice time, calculated as the percentage of his teams 4v5 ice time that the player was on the ice for.
Data Sources
- Salary data is from TheStanleyCap.com
- Skating data is from NHL Edge
- Other statistics are from Puckalytics.com and derived from data from NHL.com
Terms of Use
You are free to use include player cards in written articles, share on social media, or on other public websites under the following conditions:
- You credit TheStanleyCap.com as the source and provide a link back to TheStanleyCap.com or this player page.
- You do not mass copy/duplicate/publish dozens or hundreds of player cards. A few, or a handful for a written article is fine. Be reasonable. Fair use rules apply.
- If you are a high-traffic website you must download and host the image(s) on your site rather than overload TheStanleyCap servers with traffic.
Note: Player cards will update daily throughout the season so if you want to include snapshot then you must download the image.
If you have any questions, send an e-mail to the e-mail address at the top of this page.
Read Introducing Player Archetypes on HockeyAnalysis.com for more details on archetype calculations.
Core Archetypes
| Season | Team(s) | GP | TOI | Producer | Playmaker | Shooter | Sniper | Rebound | Rush | Skating | Defend |
|---|---|---|---|---|---|---|---|---|---|---|---|
| 2023-24 | CGY | 63 | 0.60 | 0.28 | 0.37 | 2.25 | -0.11 | -0.80 | -1.13 | 1.02 | |
| 2024-25 | CGY | 54 | 0.05 | -0.85 | 1.15 | 0.49 | 0.29 | -1.05 | -0.93 | -0.10 | |
| 2025-26 | CGY | 74 | -1.10 | -1.16 | -0.40 | 0.00 | 0.57 | 0.43 | -1.58 | 0.34 |
Situational and Secondary Archetypes
| Season | Team(s) | GP | TOI | 5v5 TOI | 5v4 TOI | 4v5 TOI | Possession | Drive | Suppress | Faceoffs |
|---|---|---|---|---|---|---|---|---|---|---|
| 2023-24 | CGY | 63 | 0.29 | 0.25 | -2.02 | 0.31 | 0.21 | 0.21 | 44.0 | |
| 2024-25 | CGY | 54 | 0.53 | 0.14 | -2.14 | 0.13 | 0.11 | 0.04 | 37.3 | |
| 2025-26 | CGY | 74 | 0.05 | -0.27 | -1.98 | -0.07 | -0.47 | 0.52 | 45.8 |
5v5 Individual Stats
| Season | Team(s) | GP | TOI | G/60 | A/60 | Pts/60 | xG/60 | GAE/60 | Sh% | xSh% | Sh%AE | %SA Rush | %SA Reb. |
|---|---|---|---|---|---|---|---|---|---|---|---|---|---|
| 2023-24 | CGY | 63 | 798:35 | 0.98 | 1.13 | 2.10 | 0.52 | 0.46 | 18.31 | 9.75 | 8.56 | 2.20 | 7.69 |
| 2024-25 | CGY | 54 | 713:16 | 0.84 | 0.50 | 1.35 | 0.72 | 0.12 | 11.90 | 10.20 | 1.71 | 0.82 | 8.20 |
| 2025-26 | CGY | 74 | 908:10 | 0.59 | 0.53 | 1.12 | 0.63 | -0.04 | 10.47 | 11.13 | -0.67 | 3.31 | 9.92 |
5v5 On Ice Stats
| Season | Team(s) | GP | TOI | SAF/60 | GF/60 | xGF/60 | SAA/60 | GA/60 | xGA/60 | GF% | xGF% | xGF Rel | xGA Rel | xGF% Rel |
|---|---|---|---|---|---|---|---|---|---|---|---|---|---|---|
| 2023-24 | CGY | 63 | 798:35 | 44.55 | 3.23 | 2.33 | 40.05 | 2.18 | 2.19 | 59.72 | 51.51 | -0.06 | -0.27 | 2.28 |
| 2024-25 | CGY | 54 | 713:16 | 43.32 | 1.68 | 2.41 | 39.62 | 1.85 | 2.31 | 47.62 | 51.05 | 0.23 | 0.00 | 2.45 |
| 2025-26 | CGY | 74 | 908:10 | 38.78 | 2.25 | 2.27 | 40.04 | 2.31 | 2.57 | 49.28 | 46.87 | -0.15 | -0.17 | -0.02 |
NHL Edge Stats
| Skating | Shooting | Zone Time | |||||||||||
|---|---|---|---|---|---|---|---|---|---|---|---|---|---|
| Season | GP | Top Speed | Bursts>20/mi | Avg. Speed | Top Speed | Avg. Speed | %Long Range | %Mid Range | %High Danger | ES DZ% | ES NZ% | ES OZ% | |
| This table is for Basic and Premium subscribers only. To view please login to and/or subscribe to one of our subscription plans. | |||||||||||||
Legend
| Percentile 0-25 | Percentile 25-50 | Percentile 50-75 | Percentile 75-100 |
5v5 Lines
| Season | Teammate | Teammate | Team | TOI | GF/60 | GA/60 | GF% | xGF/60 | xGA/60 | xGF% | xGF Rel | xGA Rel | xGF% Rel |
|---|
Glossary
| Type | Statistic | Definition |
|---|---|---|
| Individual | G/60 | Goals Against per 60 minutes. |
| Individual | A/60 | Assists per 60 minutes. |
| Individual | Pts/60 | Points per 60 minutes. |
| Individual | xG/60 | Expected Goals per 60 minutes. |
| Individual | GAE/60 | Goals Above Expected (G/60 - xG/60). |
| Individual | Sh% | Shooting Percentage. |
| Individual | xSh% | Expected Shooting Percentage. |
| Individual | Sh%AE | Shooting percentage above expected (Sh% - xSh%). |
| Individual | %SA Rush | Percentage of shot attempts determined to be on the rush. |
| Individual | %SA Reb. | Percentage of shot attempts determined to be from rebounds. |
| On Ice | SAF/60 | Shot Attempts For per 60 minutes. |
| On Ice | GF/60 | Goals For per 60 minutes. |
| On Ice | xGF/60 | Expected Goals For per 60 minutes. |
| On Ice | SAA/60 | Shot Attempts Against per 60 minutes (lower is better). |
| On Ice | GA/60 | Goals Against per 60 minutes (lower is better). |
| On Ice | xGA/60 | Expected Goals Against per 60 minutes (lower is better). |
| On Ice | GF% | Goals For Percentage = Goals For / (Goals For + Goals Against) |
| On Ice | xGF% | Expected Goals For Percentage = Expected Goals For / (Expected Goals For + Expected Goals Against) |
| On Ice | xGF Rel | xGF/60 when On Ice - xGF/60 when not On Ice. |
| On Ice | xGA Rel | xGA/60 when On Ice - xGA/60 when not On Ice (lower is better). |
| On Ice | xGF% Rel | xGF% when On Ice - xGF% when not On Ice. |
News and Opinions
-
The Calgary Flames dropped the ball with Connor Zary at The Win Column (Fri Jul 24, 2026)
-
4 Flames Who Could Have Breakout Seasons in 2026-27 at The Hockey Writers (Tue Jul 21, 2026)
-
3 Players the Canadiens Could Target on the Trade Market at The Hockey Writers (Mon Jul 20, 2026)
-
What is the Best Move for the Calgary Flames With Connor Zary? at Flame for Thought (Sun Jul 12, 2026)
-
Connor Zary reportedly hasn’t generated much trade interest at The Win Column (Fri Jul 3, 2026)
-
NHL Rumors: Connor Zary, Blake Coleman, Quinn Hughes, Rasmus Ristolainen, and Bowen Byram at NHL Rumors (Fri Jun 26, 2026)
-
Where Could Connor Zary Be Traded? Examining the Best Fits Around the NHL at Yahoo Sports NHL (Thu Jun 25, 2026)
-
4 Trade Destinations for Flames Forward Connor Zary at The Hockey Writers (Thu Jun 25, 2026)
-
The price Kent Hughes must pay to acquire Connor Zary from the Flames has been revealed at Habs Fanatics (Wed Jun 24, 2026)
-
Flames are ‘trying to move’ forward Connor Zary: Dreger at Flames Nation (Wed Jun 24, 2026)
-
Dreger Reports Flames Exploring Trade Options for Connor Zary at Yahoo Sports NHL (Wed Jun 24, 2026)
-
No, Connor Zary does not need a fresh start elsewhere at The Win Column (Fri May 29, 2026)
-
Is Ryan Huska a problem for the Calgary Flames? at The Win Column (Sat May 23, 2026)
-
Connor Zary reportedly uncertain about future with the Calgary Flames at The Win Column (Fri May 22, 2026)
-
Les Flames veulent (presque) tout vendre : Connor Zary est lié au Canadien at Dans Les Coulisses (Fri May 15, 2026)
-
Why Charlie McAvoy's suspension is absurd compared to others this season at Causway Crowd (Tue May 12, 2026)
-
FN Report Cards: Connor Zary’s 2025-26 season had ups and downs at Flames Nation (Fri Apr 24, 2026)
-
Did Connor Zary take a shot at the Calgary Flames coaching staff? at Flame for Thought (Sat Apr 18, 2026)
-
Connor Zary Should No Longer Be Part of the Flames’ Long-Term Plans at The Hockey Writers (Thu Apr 16, 2026)
-
Is Connor Zary’s future with the Calgary Flames in question? at The Win Column (Wed Mar 25, 2026)
-
NHL Notebook: Panthers’ Greer gets three games for hit on Flames’ Zary at Canucks Army (Mon Mar 23, 2026)
-
Panthers’ A.J. Greer suspended for 3 games for shoving Flames’ Connor Zary into the boards at NBC Sports (Sun Mar 22, 2026)
-
Panthers’ A.J. Greer suspended for 3 games for shoving Flames’ Connor Zary into the boards at Yahoo Sports NHL (Sun Mar 22, 2026)
-
Panthers' A.J. Greer suspended for 3 games for shoving Flames' Connor Zary into the boards at Yahoo Sports NHL (Sun Mar 22, 2026)
-
Panthers’ A.J. Greer suspended three games for hit on Flames forward Connor Zary at Flames Nation (Sun Mar 22, 2026)
-
AJ Greer Suspended 3 Games For Hit On Connor Zary During Panthers Loss In Calgary at Yahoo Sports NHL (Sun Mar 22, 2026)
-
Flames Week Ahead: Schedule & Storylines – Olofsson’s First, Zary Hit, Homestand Momentum and More at The Hockey Writers (Sun Mar 22, 2026)
-
Panthers' A.J. Greer Will Have A Hearing For His Hit On Flames' Connor Zary at Yahoo Sports NHL (Sat Mar 21, 2026)
-
Panthers’ A.J. Greer to have phone hearing for hit on Flames forward Connor Zary at Flames Nation (Sat Mar 21, 2026)
-
Should A.J. Greer face a suspension for his hit on Flames forward Connor Zary? at Flames Nation (Sat Mar 21, 2026)
-
Instant Reaction: Flames tame Sharks in return from Olympics at Flames Nation (Fri Feb 27, 2026)
-
Flames players the Oilers should target at the trade deadline at Oil on Whyte (Thu Feb 26, 2026)
-
Beyond the Boxscore: A healthy Devin Cooley gets the Flames back in the win column at Flames Nation (Sun Jan 11, 2026)
-
Beyond the Boxscore: Flames come out swinging in big 6-3 win over Golden Knights at Flames Nation (Sun Dec 21, 2025)
-
Measuring the Calgary Flames forward group by 82-game point pace at The Win Column (Mon Dec 1, 2025)
-
Game Takes: Flames 5 Canucks 2 at Calgary Puck (Mon Nov 24, 2025)
-
Game Takes: Hawks 5 Flames 2 at Calgary Puck (Wed Nov 19, 2025)
-
Flames News & Rumours: Andersson, Zary, Honzek & More at The Hockey Writers (Tue Nov 18, 2025)
-
The Calgary Flames could be turning Connor Zary into the next Sam Bennett at The Win Column (Thu Nov 13, 2025)
-
The Calgary Flames could be turning Connor Zary into the next Sam Bennett at The Win Column (Thu Nov 13, 2025)
-
The Calgary Flames are comically mismanaging their young players at The Win Column (Sun Nov 2, 2025)
-
The Calgary Flames are comically mismanaging their young players at The Win Column (Sun Nov 2, 2025)
-
Game Takes: Flames 5 Rangers 1 at Calgary Puck (Sun Oct 26, 2025)
-
How have the Calgary Flames’ forward lines have performed thus far in 2025-26? at The Win Column (Wed Oct 22, 2025)
-
Game Takes: Flames 4 Oilers 3 (SO) at Calgary Puck (Thu Oct 9, 2025)
-
Expectations are high for Flames forward Connor Zary in 2025-26 at Flames Nation (Fri Oct 3, 2025)
-
What it will take for Connor Zary to have a breakout year at The Win Column (Sat Sep 27, 2025)
-
3 Takeaways From the Flames’ Preseason Loss in Abbotsford vs Canucks at The Hockey Writers (Thu Sep 25, 2025)
-
Where Connor Zary fits in the Flames’ lineup at The Win Column (Fri Sep 12, 2025)
-
Calgary Flames 2025–26 preseason awards predictions at The Win Column (Thu Sep 11, 2025)
-
Flames’ Zary Facing Pressure Heading into Third NHL Season at The Hockey Writers (Wed Sep 10, 2025)
-
Calgary Flames Pre-Camp Forward Projections at Calgary Hockey Now (Mon Sep 8, 2025)
-
Jack’s Daily: Blackhawks Prospect Showcase Nears; Zary Signs, Trade Deadline Set at Chicago Hockey Now (Mon Sep 8, 2025)
-
Flames News & Rumours: Zary, Andersson, Weegar & More at The Hockey Writers (Sun Sep 7, 2025)
-
Flames get it right with Connor Zary signing at Flame for Thought (Sat Sep 6, 2025)
-
Analyzing Connor Zary’s Contract Extension With the Flames at The Hockey Writers (Sat Sep 6, 2025)
-
NHL Notebook: Derek Ryan retires, Flames sign Connor Zary, and more at Oilers Nation (Fri Sep 5, 2025)
-
REPORTED: Flames Sign Connor Zary to Three-Year Contract at Yahoo Sports NHL (Fri Sep 5, 2025)
-
Calgary Flames Sign Connor Zary to 3-Year Extension at The Hockey Writers (Fri Sep 5, 2025)
-
Breaking: Calgary Flames, Connor Zary agree to three-year contract extension at The Win Column (Fri Sep 5, 2025)
-
Flames sign RFA forward Connor Zary to three-year contract at Flames Nation (Fri Sep 5, 2025)
-
Connor Zary signe enfin un nouveau contrat avec les Flames at HABSolument Fan (Fri Sep 5, 2025)
-
It sounds like the Flames and Connor Zary are working towards a new deal at Flames Nation (Wed Sep 3, 2025)
-
Flames News & Rumors: Zary, Andersson, Lowry at The Hockey Writers (Wed Sep 3, 2025)
-
Report: Calgary Flames and Connor Zary closing in on 3-year contract at The Win Column (Tue Sep 2, 2025)
-
NHL Rumors: Calgary Flames – Connor Zary, Mikael Backlund, and Rasmus Andersson at NHL Rumors (Sat Aug 30, 2025)
-
The Flames and Connor Zary like each other, but have a disagreement on compensation: Friedman at Flames Nation (Wed Aug 27, 2025)
-
Flames News & Rumours: Wolf, Zary, Backlund & More at The Hockey Writers (Tue Aug 26, 2025)
-
The Calgary Flames need to sign Connor Zary as soon as possible at The Win Column (Thu Aug 21, 2025)
-
NHL Rumors: Mason McTavish and Connor Zary are Two Notable RFAs at NHL Rumors (Fri Aug 15, 2025)
-
Flames News & Rumours: Zary, Huberdeau & Weegar at The Hockey Writers (Tue Aug 5, 2025)
-
NHL Rumors: Connor Zary, and Five Destinations for Bryan Rust and Rickard Rakell at NHL Rumors (Fri Aug 1, 2025)
-
Pospisil extension could serve as blueprint for Flames to sign Zary at Flame for Thought (Fri Aug 1, 2025)
-
Flames bounce back candidates for the 2025-26 season at The Win Column (Thu Jul 31, 2025)
-
The Flames’ best goals of 2024-25: Connor Zary scores overtime winner against Canucks at Flames Nation (Fri Jul 25, 2025)
-
Report: Calgary Flames and Connor Zary remain split in contract negotiations at The Win Column (Tue Jul 22, 2025)
-
The waiting game continues for the Flames and Connor Zary on a new contract at Flames Nation (Tue Jul 22, 2025)
-
Flames Fans Should Start Getting Worried About Connor Zary at The Hockey Writers (Tue Jul 22, 2025)
-
Kings Should Target Connor Zary From Flames at Yahoo Sports NHL (Mon Jul 21, 2025)
-
Flames News & Rumors: Kadri, McTavish, Zary & More at The Hockey Writers (Mon Jul 21, 2025)
-
Connor Zary’s Next Deal a Priority for Flames at Yahoo Sports NHL (Fri Jul 18, 2025)
-
Calgary Flames End of Season Awards: Rookie of the Year at Flame for Thought (Tue Apr 23, 2024)
-
Devils Draft Series: Connor Zary, WHL’s Fifth-Leading Scorer at Devils Army (Fri May 15, 2020)
Current Contract
Connor Zary signed a $11,325,000 3-year contract with the Calgary Flames and General Manager Craig Conroy on September 5, 2025 with an AAV of $3,775,000. This contract will start in 2025-26 and end after the 2027-28 season. In the first season of the contract the cap hit was equivalent to 3.95% of the salary cap.
Standard Contract (RFA) ( ) (0 ratings)
Connor Zary signed a $2,775,000 3-year contract with the Calgary Flames and General Manager Brad Treliving on December 31, 2020 with an AAV of $925,000. This contract will start in 2020-21 and end after the 2024-25 season. In the first season of the contract the cap hit was equivalent to 1.13% of the salary cap.
Entry Level Contract ( ) (0 ratings)
| Season | Age* | Clause | Cap Hit | AAV | Perf. Bonus | Sign. Bonus | Salary | Compensation | Minors Salary | Status | |
|---|---|---|---|---|---|---|---|---|---|---|---|
| 2020-21 | 18 | $925,000 | $1,066,667 | - | $92,500 | - | $92,500 | - | ELC | ||
| 2021-22 | 19 | $894,167 | $1,035,833 | - | $92,500 | - | $92,500 | - | ELC | ||
| 2022-23 | 20 | $863,333 | $1,005,000 | - | $92,500 | $832,500 | $925,000 | $80,000 | ELC | ||
| 2023-24 | 21 | $863,333 | $1,005,000 | $212,500 | - | $832,500 | $832,500 | $80,000 | ELC | ||
| 2024-25 | 22 | $863,333 | $1,005,000 | $212,500 | - | $832,500 | $832,500 | $80,000 | ELC | ||
| Total | $425,000 | $277,500 | $2,497,500 | $2,775,000 | $240,000 |
Career Statistics
| Regular Season | Playoffs | |||||||||||||||||||
|---|---|---|---|---|---|---|---|---|---|---|---|---|---|---|---|---|---|---|---|---|
| Season | League | Team | GP | G | A | Pts | +/- | PIM | Shots | Sh% | TOI/G | GP | G | A | Pts | +/- | PIM | Shots | Sh% | TOI/G |
| 2014-15 | SAAHL U15 | Saskatoon Bandits U15 AA | 29 | 22 | 16 | 38 | 46 | 2 | 2 | 1 | 3 | |||||||||
| 2015-16 | SMAAAHL | Saskatoon Contacts U18 AAA | 7 | 2 | 0 | 2 | 6 | |||||||||||||
| 2015-16 | SAAHL U15 | Saskatoon Outlaws U15 AA | 30 | 44 | 37 | 81 | 78 | 5 | 6 | 5 | 11 | 2 | ||||||||
| 2016-17 | WCCC-16 | Team Saskatchewan | 5 | 1 | 1 | 2 | 6 | |||||||||||||
| 2016-17 | SMAAAHL | Saskatoon Contacts U18 AAA | 36 | 27 | 18 | 45 | 48 | 4 | 2 | 2 | ||||||||||
| 2017-18 | WHL | Kamloops Blazers | 68 | 11 | 18 | 29 | -2 | 26 | ||||||||||||
| 2017-18 | U17-Dev | Team Red | 3 | 0 | 1 | 1 | 2 | |||||||||||||
| 2018-19 | WJC-18 | Canada U18 | 7 | 4 | 3 | 7 | +5 | 6 | ||||||||||||
| 2018-19 | WHL | Kamloops Blazers | 63 | 24 | 43 | 67 | +18 | 55 | 4 | 3 | 1 | 4 | -1 | 6 | ||||||
| 2019-20 | WHL | Kamloops Blazers | 57 | 38 | 48 | 86 | +30 | 51 | ||||||||||||
| 2020-21 | WHL | Kamloops Blazers | 15 | 6 | 18 | 24 | +9 | 35 | ||||||||||||
| 2020-21 | AHL | Stockton Heat | 9 | 3 | 4 | 7 | +2 | 4 | ||||||||||||
| 2020-21 | WJC-20 | Canada U20 | 7 | 0 | 2 | 2 | +4 | 2 | ||||||||||||
| 2021-22 | AHL | Stockton Heat | 53 | 13 | 12 | 25 | -4 | 36 | 13 | 1 | 1 | 2 | -1 | 4 | ||||||
| 2022-23 | AHL | Calgary Wranglers | 72 | 21 | 37 | 58 | +7 | 63 | 9 | 1 | 3 | 4 | 4 | |||||||
| 2023-24 | NHL | Calgary Flames | 63 | 14 | 20 | 34 | +12 | 22 | 90 | 15.6 | 15:16 | |||||||||
| 2023-24 | AHL | Calgary Wranglers | 6 | 1 | 9 | 10 | +4 | 2 | ||||||||||||
| 2024-25 | NHL | Calgary Flames | 54 | 13 | 14 | 27 | -7 | 14 | 111 | 11.7 | 16:04 | |||||||||
| 2025-26 | NHL | Calgary Flames | 74 | 12 | 13 | 25 | -9 | 22 | 110 | 10.9 | 14:22 | |||||||||
| NHL Career | 191 | 39 | 47 | 86 | -4 | 58 | 311 | 12.5 | 15:09 | |||||||||||