
 Connor Dewar
| Position | Left Wing / Center | Current Team | Pittsburgh Penguins |
| Shoots | Left | Current Contract | 2 years ($2.2M CapHit) |
| Height | 5'10" | Expires | 2027-28 |
| Weight (lbs) | 187 | Expiry Age (Jun 30) | 29 |
| Age (DOB) | 27 (June 26, 1999) | Expiry Status | UFA |
| Drafted | 2018, Round 3, Overall 92 (MIN) |
| Date | Team | Transaction | |
|---|---|---|---|
| May 7, 2026 | Pittsburgh Penguins | Signed 2 years @ $2.250M AAV starting in 2026-27 | |
| Jul 1, 2025 | Pittsburgh Penguins | Signed 1 year @ $1.100M AAV starting in 2025-26 | |
| Mar 7, 2025 | Pittsburgh Penguins | Acquired from Toronto Maple Leafs | |
| Mar 7, 2025 | Toronto Maple Leafs | Traded to Pittsburgh Penguins | |
| Mar 2, 2025 | Toronto Maple Leafs | Activated from IR | |
| Jan 25, 2025 | Toronto Maple Leafs | Placed on IR | |
| Nov 8, 2024 | Toronto Maple Leafs | Activated from LTIR | |
| Oct 9, 2024 | Toronto Maple Leafs | Placed on LTIR | |
| Oct 7, 2024 | Toronto Maple Leafs | Placed on IR | |
| Jul 23, 2024 | Toronto Maple Leafs | Signed 1 year @ $1.180M AAV starting in 2024-25 | |
| Jun 22, 2023 | Minnesota Wild | Signed 2 years @ $800K AAV starting in 2022-23 | |
| Mar 5, 2019 | Minnesota Wild | Signed to an entry level contract. |
Player Card(s)
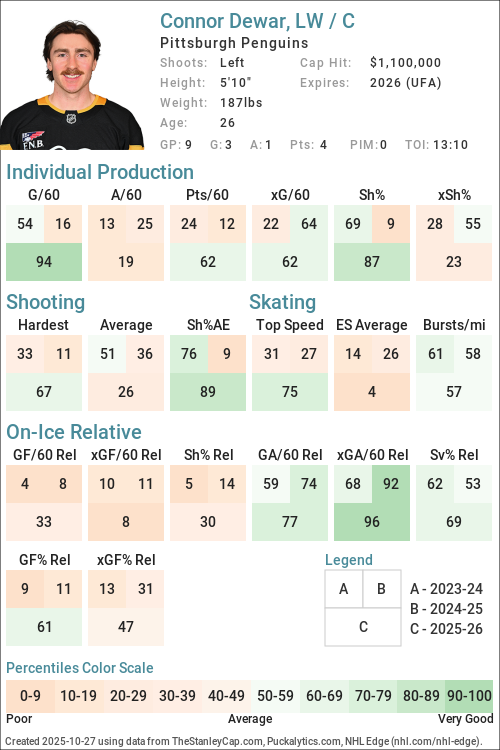
URL: https://thestanleycap.com/cdn/player_cards/20252026/connor-dewar-8480980.png
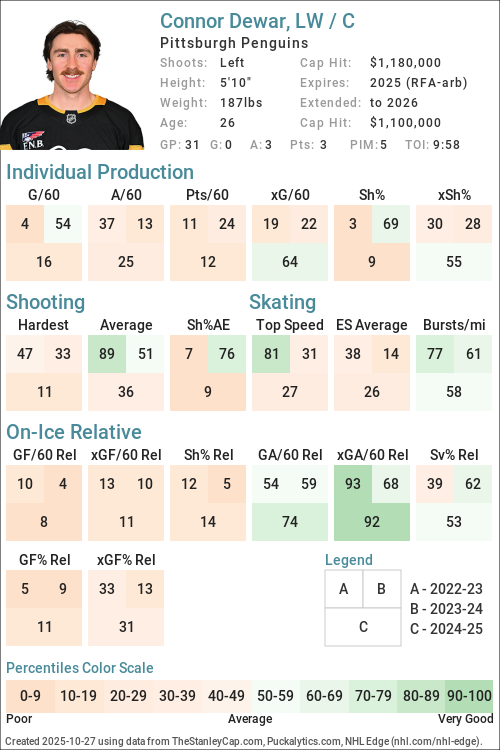
URL: https://thestanleycap.com/cdn/player_cards/20242025/connor-dewar-8480980.png
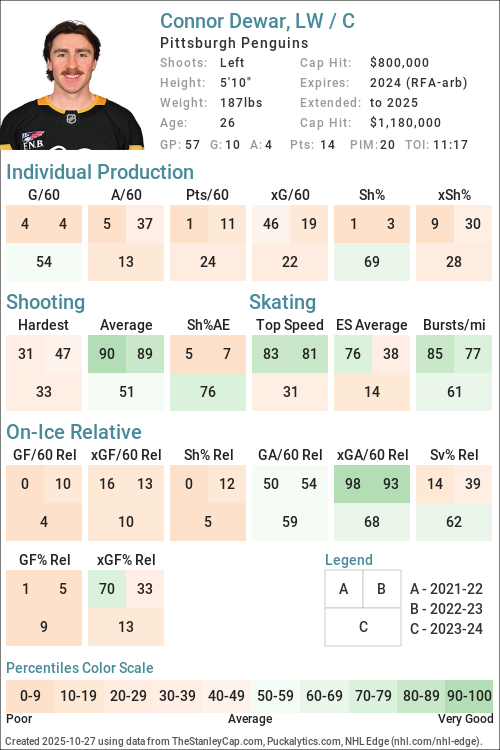
URL: https://thestanleycap.com/cdn/player_cards/20232024/connor-dewar-8480980.png
About Player Cards
Player cards present an infographic of a players performance using a series of Player Archetypes developed for Puckalytics.com and TheStanleyCap.com. The boxes in the rink image show the archetype ratings for the season specified in the card while the graphs to the right show the five-year trends for those archetypes.
Except for Faceoffs, the values shown are the players z-score (standard deviation from the mean) for the specific metric used to calculate the archetype values. When calculating z-scores forwards were compared to forwards and defensemen were compared to defensemen. Positive values indicate the player is above average and shaded in blue, while negative values indicate the player is below average and shaded in pink. The five year trend charts show a range of -4.0 to 4.0.
The value shown for Faceoffs is the faceoff winning percentage rather than their z-score with winning percentages below 50 in pink shades and above 50 in blue shades.
All archetypes are 5v5 except 5v4 TOI, 4v5 TOI, Skating (even strength) and Faceoffs (all situations). Archetypes use regular season data only.
Archetypes Summary
- Sniper - Measures the to score above the expected goal rate.
- Rebound - Measures the percent of a players shot attempts that come from rebounds (forwards only).
- 5v4 TOI - Powerplay ice time, calculated as the percentage of his teams 5v4 ice time that the player was on the ice for.
- Shooter - Measures whether a players points come from shots (goals or assists on rebounds from his shots).
- Producer - Measures a players ability to produce goals and assists, adjusted for quality of teammates.
- Playmaker - Measures whether a players points come from passes.
- Drive - Measures a players ability to drive puck possession and generate shot attempts for his team.
- Rush - Measures the percent of a players shot attempts that come from rush plays
- Possession - An indicator of a players ability to improve his teams puck possession game.
- Faceoffs - Faceoff Winning Percentage (min. 75 faceoffs taken).
- 5v5 TOI - The percentage of his teams 5v5 TOI that the player was on the ice for.
- Suppress - Measures a players ability to suppress opponent puck possession and shot attempts against.
- Skating - An indicator of a players skating ability, or speed bursts above 20mph per mile skated.
- Defend - An indicator of a players ability to suppress shot quality against.
- 4v5 TOI - Penalty Kill ice time, calculated as the percentage of his teams 4v5 ice time that the player was on the ice for.
Data Sources
- Salary data is from TheStanleyCap.com
- Skating data is from NHL Edge
- Other statistics are from Puckalytics.com and derived from data from NHL.com
Terms of Use
You are free to use include player cards in written articles, share on social media, or on other public websites under the following conditions:
- You credit TheStanleyCap.com as the source and provide a link back to TheStanleyCap.com or this player page.
- You do not mass copy/duplicate/publish dozens or hundreds of player cards. A few, or a handful for a written article is fine. Be reasonable. Fair use rules apply.
- If you are a high-traffic website you must download and host the image(s) on your site rather than overload TheStanleyCap servers with traffic.
Note: Player cards will update daily throughout the season so if you want to include snapshot then you must download the image.
If you have any questions, send an e-mail to the e-mail address at the top of this page.
Read Introducing Player Archetypes on HockeyAnalysis.com for more details on archetype calculations.
Core Archetypes
| Season | Team(s) | GP | TOI | Producer | Playmaker | Shooter | Sniper | Rebound | Rush | Skating | Defend |
|---|---|---|---|---|---|---|---|---|---|---|---|
| 2021-22 | MIN | 35 | -1.79 | -1.45 | -1.26 | -1.52 | -1.64 | 0.78 | 1.02 | -1.02 | |
| 2022-23 | MIN | 81 | -0.66 | 0.52 | -1.16 | -1.25 | -0.43 | 1.06 | 0.62 | -0.25 | |
| 2023-24 | MIN, TOR | 74 | -0.48 | -0.85 | 0.17 | 0.60 | -1.63 | 0.06 | 0.10 | 0.28 | |
| 2024-25 | PIT, TOR | 48 | -0.70 | -0.09 | -0.90 | -1.25 | 2.14 | 2.32 | 0.06 | 0.10 | |
| 2025-26 | PIT | 78 | -0.55 | -0.46 | -0.44 | -0.20 | -0.73 | -0.46 | -0.48 | 0.81 |
Situational and Secondary Archetypes
| Season | Team(s) | GP | TOI | 5v5 TOI | 5v4 TOI | 4v5 TOI | Possession | Drive | Suppress | Faceoffs |
|---|---|---|---|---|---|---|---|---|---|---|
| 2021-22 | MIN | 35 | -1.78 | -1.93 | -0.91 | 0.59 | -0.64 | 1.89 | 46.6 | |
| 2022-23 | MIN | 81 | -1.74 | -1.83 | 0.42 | -0.52 | -1.16 | 0.90 | 44.1 | |
| 2023-24 | MIN, TOR | 74 | -1.47 | -1.76 | 0.80 | -1.08 | -1.14 | -0.12 | 46.8 | |
| 2024-25 | PIT, TOR | 48 | -1.63 | -1.96 | 0.62 | -0.75 | -1.53 | 1.17 | 42.7 | |
| 2025-26 | PIT | 78 | -0.78 | -1.83 | 1.93 | 0.46 | -0.02 | 0.71 | 47.4 |
5v5 Individual Stats
| Season | Team(s) | GP | TOI | G/60 | A/60 | Pts/60 | xG/60 | GAE/60 | Sh% | xSh% | Sh%AE | %SA Rush | %SA Reb. |
|---|---|---|---|---|---|---|---|---|---|---|---|---|---|
| 2021-22 | MIN | 35 | 313:05 | 0.19 | 0.38 | 0.57 | 0.63 | -0.44 | 2.44 | 7.99 | -5.55 | 5.56 | 1.85 |
| 2022-23 | MIN | 81 | 724:59 | 0.25 | 0.83 | 1.08 | 0.54 | -0.30 | 4.29 | 9.38 | -5.10 | 5.88 | 5.88 |
| 2023-24 | MIN | 57 | 507:10 | 0.83 | 0.35 | 1.18 | 0.62 | 0.21 | 14.00 | 10.46 | 3.54 | 5.56 | 4.17 |
| 2023-24 | TOR | 17 | 171:30 | 0.35 | 1.05 | 1.40 | 0.42 | -0.07 | 5.56 | 6.60 | -1.04 | 0.00 | 0.00 |
| 2023-24 | MIN, TOR | 74 | 678:40 | 0.71 | 0.53 | 1.24 | 0.57 | 0.14 | 11.76 | 9.44 | 2.33 | 4.00 | 3.00 |
| 2024-25 | TOR | 31 | 261:58 | 0.00 | 0.46 | 0.46 | 0.82 | -0.82 | 0.00 | 12.79 | -12.79 | 8.11 | 16.22 |
| 2024-25 | PIT | 17 | 204:54 | 0.88 | 0.88 | 1.76 | 0.55 | 0.33 | 13.04 | 8.15 | 4.89 | 3.33 | 10.00 |
| 2024-25 | PIT, TOR | 48 | 466:52 | 0.39 | 0.64 | 1.03 | 0.70 | -0.32 | 5.88 | 10.70 | -4.82 | 5.97 | 13.43 |
| 2025-26 | PIT | 78 | 843:19 | 0.64 | 0.92 | 1.57 | 0.74 | -0.09 | 10.11 | 11.61 | -1.50 | 1.92 | 5.77 |
5v5 On Ice Stats
| Season | Team(s) | GP | TOI | SAF/60 | GF/60 | xGF/60 | SAA/60 | GA/60 | xGA/60 | GF% | xGF% | xGF Rel | xGA Rel | xGF% Rel |
|---|---|---|---|---|---|---|---|---|---|---|---|---|---|---|
| 2021-22 | MIN | 35 | 313:05 | 41.01 | 1.53 | 2.17 | 33.92 | 2.49 | 1.87 | 38.10 | 53.70 | -0.55 | -0.37 | -1.15 |
| 2022-23 | MIN | 81 | 724:59 | 36.83 | 1.41 | 1.94 | 39.06 | 2.07 | 2.24 | 40.48 | 46.41 | -0.63 | -0.30 | -3.87 |
| 2023-24 | MIN | 57 | 507:10 | 35.85 | 1.66 | 1.94 | 42.71 | 2.60 | 2.20 | 38.89 | 46.77 | -0.48 | -0.01 | -5.48 |
| 2023-24 | TOR | 17 | 171:30 | 37.43 | 2.10 | 1.90 | 36.73 | 2.45 | 1.88 | 46.15 | 50.27 | -1.13 | -0.70 | -3.73 |
| 2023-24 | MIN, TOR | 74 | 678:40 | 36.25 | 1.77 | 1.93 | 41.20 | 2.56 | 2.12 | 40.82 | 47.60 | -0.63 | -0.17 | -5.11 |
| 2024-25 | TOR | 31 | 261:58 | 30.92 | 0.69 | 1.76 | 41.00 | 1.60 | 2.20 | 30.00 | 44.43 | -0.67 | -0.09 | -7.03 |
| 2024-25 | PIT | 17 | 204:54 | 37.19 | 2.34 | 1.97 | 36.31 | 2.64 | 2.23 | 47.06 | 46.84 | -0.57 | -0.57 | -0.65 |
| 2024-25 | PIT, TOR | 48 | 466:52 | 33.67 | 1.41 | 1.85 | 38.94 | 2.06 | 2.22 | 40.74 | 45.52 | -0.61 | -0.25 | -4.51 |
| 2025-26 | PIT | 78 | 843:19 | 41.34 | 2.99 | 2.66 | 38.42 | 2.21 | 2.33 | 57.53 | 53.32 | -0.15 | -0.32 | 1.80 |
NHL Edge Stats
| Skating | Shooting | Zone Time | |||||||||||
|---|---|---|---|---|---|---|---|---|---|---|---|---|---|
| Season | GP | Top Speed | Bursts>20/mi | Avg. Speed | Top Speed | Avg. Speed | %Long Range | %Mid Range | %High Danger | ES DZ% | ES NZ% | ES OZ% | |
| This table is for Basic and Premium subscribers only. To view please login to and/or subscribe to one of our subscription plans. | |||||||||||||
Legend
| Percentile 0-25 | Percentile 25-50 | Percentile 50-75 | Percentile 75-100 |
5v5 Lines
| Season | Teammate | Teammate | Team | TOI | GF/60 | GA/60 | GF% | xGF/60 | xGA/60 | xGF% | xGF Rel | xGA Rel | xGF% Rel |
|---|
Glossary
| Type | Statistic | Definition |
|---|---|---|
| Individual | G/60 | Goals Against per 60 minutes. |
| Individual | A/60 | Assists per 60 minutes. |
| Individual | Pts/60 | Points per 60 minutes. |
| Individual | xG/60 | Expected Goals per 60 minutes. |
| Individual | GAE/60 | Goals Above Expected (G/60 - xG/60). |
| Individual | Sh% | Shooting Percentage. |
| Individual | xSh% | Expected Shooting Percentage. |
| Individual | Sh%AE | Shooting percentage above expected (Sh% - xSh%). |
| Individual | %SA Rush | Percentage of shot attempts determined to be on the rush. |
| Individual | %SA Reb. | Percentage of shot attempts determined to be from rebounds. |
| On Ice | SAF/60 | Shot Attempts For per 60 minutes. |
| On Ice | GF/60 | Goals For per 60 minutes. |
| On Ice | xGF/60 | Expected Goals For per 60 minutes. |
| On Ice | SAA/60 | Shot Attempts Against per 60 minutes (lower is better). |
| On Ice | GA/60 | Goals Against per 60 minutes (lower is better). |
| On Ice | xGA/60 | Expected Goals Against per 60 minutes (lower is better). |
| On Ice | GF% | Goals For Percentage = Goals For / (Goals For + Goals Against) |
| On Ice | xGF% | Expected Goals For Percentage = Expected Goals For / (Expected Goals For + Expected Goals Against) |
| On Ice | xGF Rel | xGF/60 when On Ice - xGF/60 when not On Ice. |
| On Ice | xGA Rel | xGA/60 when On Ice - xGA/60 when not On Ice (lower is better). |
| On Ice | xGF% Rel | xGF% when On Ice - xGF% when not On Ice. |
News and Opinions
-
Penguins extensions for Connor Dewar, Blake Lizotte are already aging extremely well at Pens Burgh (Mon Jun 29, 2026)
-
2025-26 Season in Review: Connor Dewar at Pens Burgh (Mon May 18, 2026)
-
Penguins Already Making Smart Decisions For Next Season at The Hockey Writers (Mon May 11, 2026)
-
The Connor Dewar and Ilya Solovyov signings are solid start to Penguins offseason at Pens Burgh (Sat May 9, 2026)
-
Possible Rangers’ free-agent option off the board, re-signs with Penguins at Forever Blueshirts (Thu May 7, 2026)
-
Penguins re-sign Connor Dewar and Ilya Solovyov at Pens Burgh (Thu May 7, 2026)
-
Penguins re-sign Connor Dewar and Ilya Solovyov at Yahoo Sports NHL (Thu May 7, 2026)
-
Penguins Notebook: Lizotte, Dewar Return To Practice Ahead Of Stanley Cup Playoffs at Yahoo Sports NHL (Thu Apr 16, 2026)
-
Penguins Have Found Their Ideal Fourth-Liner In Connor Dewar at Yahoo Sports NHL (Thu Nov 20, 2025)
-
Jonathan Drouin Suspended One Game For Cross-Check On Penguins Forward Connor Dewar at Yahoo Sports NHL (Fri Oct 10, 2025)
-
Islanders' Forward Suspended After Cross-Check On Penguins' Connor Dewar at Yahoo Sports NHL (Fri Oct 10, 2025)
-
Islanders Jonathan Drouin Suspended One Game For Cross-Checking Penguins Connor Dewar at Yahoo Sports NHL (Fri Oct 10, 2025)
-
Islanders Jonathan Drouin To Have Over-The-Phone Hearing For Cross-Checking Penguins Connor Dewar at Yahoo Sports NHL (Fri Oct 10, 2025)
-
Can Connor Dewar Carry Last Season's Momentum Into 2025-26? at Yahoo Sports (Sun Sep 14, 2025)
-
3 Penguins Players With Something to Prove in 2025-26 at The Hockey Writers (Sun Aug 17, 2025)
-
Toronto Maple Leafs Trade Deadline History at The Hockey Writers (Sun Aug 10, 2025)
-
Should Two Top Forward Prospects Make Penguins' Opening Night Roster? at Yahoo Sports (Thu Jul 24, 2025)
-
Can Connor Dewar Prove Penguins Right This Year? at Yahoo Sports (Wed Jul 23, 2025)
-
Can Connor Dewar Prove Penguins Right This Year? at Yahoo Sports NHL (Wed Jul 23, 2025)
-
Minnesota Wild: Tough Lineup Decisions for Team Looming at Gone Puck Wild (Fri Nov 11, 2022)
Current Contract
Connor Dewar signed a $4,500,000 2-year contract with the Pittsburgh Penguins and General Manager Kyle Dubas on May 7, 2026 with an AAV of $2,250,000. This contract will start in 2026-27 and end after the 2027-28 season. In the first season of the contract the cap hit was equivalent to 2.16% of the salary cap.
Standard Contract (UFA) ( ) (0 ratings)
Connor Dewar signed a $1,100,000 1-year contract with the Pittsburgh Penguins and General Manager Kyle Dubas on July 1, 2025 with an AAV of $1,100,000. This contract will start in 2025-26 and end after the 2025-26 season. In the first season of the contract the cap hit was equivalent to 1.15% of the salary cap.
Standard Contract (RFA) ( ) (0 ratings)
| Season | Age* | Clause | Cap Hit | AAV | Perf. Bonus | Sign. Bonus | Salary | Compensation | Minors Salary | Status | |
|---|---|---|---|---|---|---|---|---|---|---|---|
| 2025-26 | 26 | $1,100,000 | $1,100,000 | - | - | $1,100,000 | $1,100,000 | $1,100,000 | RFA-arb | ||
| Total | - | - | $1,100,000 | $1,100,000 | $1,100,000 |
Connor Dewar signed a $1,180,000 1-year contract with the Toronto Maple Leafs and General Manager Brad Treliving on July 23, 2024 with an AAV of $1,180,000. This contract will start in 2024-25 and end after the 2024-25 season. In the first season of the contract the cap hit was equivalent to 1.34% of the salary cap.
Standard Contract (RFA) ( ) (0 ratings)
| Season | Age* | Clause | Cap Hit | AAV | Perf. Bonus | Sign. Bonus | Salary | Compensation | Minors Salary | Status | |
|---|---|---|---|---|---|---|---|---|---|---|---|
| 2024-25 | 25 | $1,180,000 | $1,180,000 | - | $400,000 | $780,000 | $1,180,000 | $1,180,000 | RFA-arb | ||
| Total | - | $400,000 | $780,000 | $1,180,000 | $1,180,000 |
Connor Dewar signed a $1,600,000 2-year contract with the Minnesota Wild and General Manager Bill Guerin on June 22, 2023 with an AAV of $800,000. This contract will start in 2022-23 and end after the 2023-24 season. In the first season of the contract the cap hit was equivalent to 0.97% of the salary cap.
Standard Contract (RFA) ( ) (0 ratings)
| Season | Age* | Clause | Cap Hit | AAV | Perf. Bonus | Sign. Bonus | Salary | Compensation | Minors Salary | Status | |
|---|---|---|---|---|---|---|---|---|---|---|---|
| 2022-23 | 23 | $800,000 | $800,000 | - | - | $750,000 | $750,000 | $750,000 | RFA | ||
| 2023-24 | 24 | $800,000 | $800,000 | - | - | $850,000 | $850,000 | $850,000 | RFA-arb | ||
| Total | - | - | $1,600,000 | $1,600,000 | $1,600,000 |
Connor Dewar signed a $2,477,500 3-year contract with the Minnesota Wild and General Manager Paul Fenton on March 5, 2019 with an AAV of $825,833. This contract will start in 2019-20 and end after the 2021-22 season. In the first season of the contract the cap hit was equivalent to 1.01% of the salary cap.
Entry Level Contract ( ) (0 ratings)
| Season | Age* | Clause | Cap Hit | AAV | Perf. Bonus | Sign. Bonus | Salary | Compensation | Minors Salary | Status | |
|---|---|---|---|---|---|---|---|---|---|---|---|
| 2019-20 | 20 | $825,833 | $925,000 | $132,500 | $92,500 | $700,000 | $792,500 | $70,000 | ELC | ||
| 2020-21 | 21 | $825,833 | $925,000 | $82,500 | $92,500 | $750,000 | $842,500 | $70,000 | ELC | ||
| 2021-22 | 22 | $825,833 | $925,000 | $82,500 | $92,500 | $750,000 | $842,500 | $70,000 | ELC | ||
| Total | $297,500 | $277,500 | $2,200,000 | $2,477,500 | $210,000 |
Career Statistics
| Regular Season | Playoffs | |||||||||||||||||||
|---|---|---|---|---|---|---|---|---|---|---|---|---|---|---|---|---|---|---|---|---|
| Season | League | Team | GP | G | A | Pts | +/- | PIM | Shots | Sh% | TOI/G | GP | G | A | Pts | +/- | PIM | Shots | Sh% | TOI/G |
| 2013-14 | WBAAA | Parkland Rangers Bantam AAA | 32 | 35 | 31 | 66 | 48 | 4 | 4 | 1 | 5 | 2 | ||||||||
| 2014-15 | CWG | Team Manitoba | 6 | 1 | 3 | 4 | 2 | |||||||||||||
| 2014-15 | MMHL | Parkland Rangers Midget AAA | 43 | 15 | 22 | 37 | 60 | 4 | 1 | 1 | 2 | 2 | ||||||||
| 2015-16 | WHL | Everett Silvertips | 72 | 11 | 7 | 18 | -1 | 24 | 9 | 1 | 1 | -2 | 2 | |||||||
| 2016-17 | WHL | Everett Silvertips | 71 | 14 | 16 | 30 | -3 | 37 | 10 | 1 | 1 | 2 | -2 | 6 | ||||||
| 2017-18 | WHL | Everett Silvertips | 68 | 38 | 30 | 68 | +23 | 47 | 22 | 12 | 14 | 26 | +24 | 24 | ||||||
| 2018-19 | WHL | Everett Silvertips | 59 | 36 | 45 | 81 | +27 | 60 | 9 | 5 | 5 | 10 | +2 | 10 | ||||||
| 2019-20 | AHL | Iowa Wild | 52 | 6 | 13 | 19 | +10 | 22 | ||||||||||||
| 2020-21 | AHL | Iowa Wild | 32 | 12 | 11 | 23 | +6 | 13 | ||||||||||||
| 2021-22 | AHL | Iowa Wild | 19 | 8 | 9 | 17 | +9 | 17 | ||||||||||||
| 2021-22 | NHL | Minnesota Wild | 35 | 2 | 4 | 6 | -4 | 25 | 44 | 4.5 | 9:54 | 1 | 1 | 0.0 | 10:39 | |||||
| 2022-23 | NHL | Minnesota Wild | 81 | 6 | 12 | 18 | -5 | 50 | 87 | 6.9 | 10:58 | 6 | -2 | 6 | 0.0 | 11:25 | ||||
| 2023-24 | NHL | Minnesota Wild | 57 | 10 | 4 | 14 | -6 | 20 | 57 | 17.5 | 11:17 | |||||||||
| 2023-24 | NHL | Toronto Maple Leafs | 17 | 1 | 4 | 5 | -2 | 8 | 20 | 5.0 | 12:54 | 6 | 1 | 1 | -1 | 6 | 0.0 | 11:10 | ||
| 2024-25 | NHL | Toronto Maple Leafs | 31 | 0 | 3 | 3 | -3 | 5 | 28 | 0.0 | 9:58 | |||||||||
| 2024-25 | NHL | Pittsburgh Penguins | 17 | 4 | 3 | 7 | 9 | 27 | 14.8 | 14:27 | ||||||||||
| 2024-25 | AHL | Toronto Marlies | 1 | 1 | 1 | 2 | +2 | 2 | ||||||||||||
| 2025-26 | NHL | Pittsburgh Penguins | 78 | 14 | 16 | 30 | +16 | 19 | 110 | 12.7 | 13:55 | 6 | 2 | 2 | 2 | 9 | 22.2 | 13:49 | ||
| NHL Career | 316 | 37 | 46 | 83 | -4 | 136 | 373 | 9.9 | 11:50 | 19 | 2 | 1 | 3 | -3 | 2 | 22 | 9.1 | 12:03 | ||