
 Cole Perfetti
| Position | Left Wing | Current Team | Winnipeg Jets |
| Shoots | Left | Current Contract | 5 years ($6.0M CapHit) |
| Height | 5'11" | Expires | 2030-31 |
| Weight (lbs) | 185 | Expiry Age (Jun 30) | 29 |
| Age (DOB) | 24 (Jan 1, 2002) | Expiry Status | UFA |
| Drafted | 2020, Round 1, Overall 10 (WPG) |
| Date | Team | Transaction | |
|---|---|---|---|
| Jul 15, 2026 | Winnipeg Jets | Signed 5 years @ $6.000M AAV starting in 2026-27 | |
| Nov 9, 2025 | Winnipeg Jets | Activated from IR | |
| Oct 6, 2025 | Winnipeg Jets | Placed on IR | |
| Sep 23, 2024 | Winnipeg Jets | Signed 2 years @ $3.250M AAV starting in 2024-25 | |
| Nov 9, 2020 | Winnipeg Jets | Signed to an entry level contract. |
Player Card(s)

URL: https://thestanleycap.com/cdn/player_cards/20252026/cole-perfetti-8482149.png
URL: https://thestanleycap.com/cdn/player_cards/20242025/cole-perfetti-8482149.png
URL: https://thestanleycap.com/cdn/player_cards/20232024/cole-perfetti-8482149.png
About Player Cards
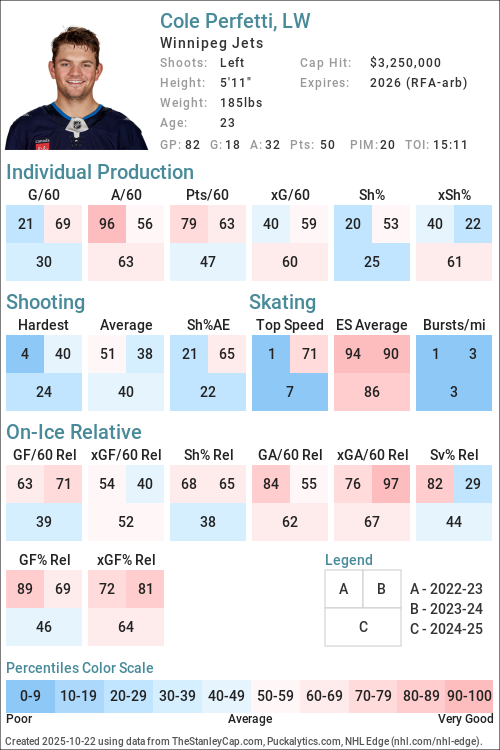
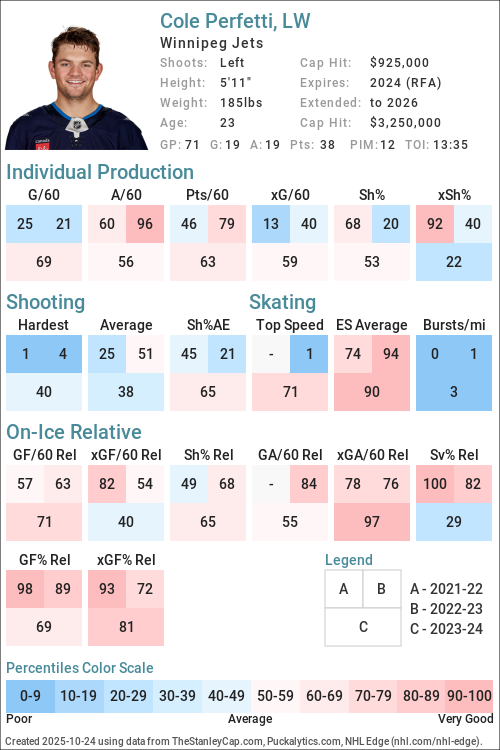
Player cards present an infographic of a players performance using a series of Player Archetypes developed for Puckalytics.com and TheStanleyCap.com. The boxes in the rink image show the archetype ratings for the season specified in the card while the graphs to the right show the five-year trends for those archetypes.
Except for Faceoffs, the values shown are the players z-score (standard deviation from the mean) for the specific metric used to calculate the archetype values. When calculating z-scores forwards were compared to forwards and defensemen were compared to defensemen. Positive values indicate the player is above average and shaded in blue, while negative values indicate the player is below average and shaded in pink. The five year trend charts show a range of -4.0 to 4.0.
The value shown for Faceoffs is the faceoff winning percentage rather than their z-score with winning percentages below 50 in pink shades and above 50 in blue shades.
All archetypes are 5v5 except 5v4 TOI, 4v5 TOI, Skating (even strength) and Faceoffs (all situations). Archetypes use regular season data only.
Archetypes Summary
- Sniper - Measures the to score above the expected goal rate.
- Rebound - Measures the percent of a players shot attempts that come from rebounds (forwards only).
- 5v4 TOI - Powerplay ice time, calculated as the percentage of his teams 5v4 ice time that the player was on the ice for.
- Shooter - Measures whether a players points come from shots (goals or assists on rebounds from his shots).
- Producer - Measures a players ability to produce goals and assists, adjusted for quality of teammates.
- Playmaker - Measures whether a players points come from passes.
- Drive - Measures a players ability to drive puck possession and generate shot attempts for his team.
- Rush - Measures the percent of a players shot attempts that come from rush plays
- Possession - An indicator of a players ability to improve his teams puck possession game.
- Faceoffs - Faceoff Winning Percentage (min. 75 faceoffs taken).
- 5v5 TOI - The percentage of his teams 5v5 TOI that the player was on the ice for.
- Suppress - Measures a players ability to suppress opponent puck possession and shot attempts against.
- Skating - An indicator of a players skating ability, or speed bursts above 20mph per mile skated.
- Defend - An indicator of a players ability to suppress shot quality against.
- 4v5 TOI - Penalty Kill ice time, calculated as the percentage of his teams 4v5 ice time that the player was on the ice for.
Data Sources
- Salary data is from TheStanleyCap.com
- Skating data is from NHL Edge
- Other statistics are from Puckalytics.com and derived from data from NHL.com
Terms of Use
You are free to use include player cards in written articles, share on social media, or on other public websites under the following conditions:
- You credit TheStanleyCap.com as the source and provide a link back to TheStanleyCap.com or this player page.
- You do not mass copy/duplicate/publish dozens or hundreds of player cards. A few, or a handful for a written article is fine. Be reasonable. Fair use rules apply.
- If you are a high-traffic website you must download and host the image(s) on your site rather than overload TheStanleyCap servers with traffic.
Note: Player cards will update daily throughout the season so if you want to include snapshot then you must download the image.
If you have any questions, send an e-mail to the e-mail address at the top of this page.
Read Introducing Player Archetypes on HockeyAnalysis.com for more details on archetype calculations.
Core Archetypes
| Season | Team(s) | GP | TOI | Producer | Playmaker | Shooter | Sniper | Rebound | Rush | Skating | Defend |
|---|---|---|---|---|---|---|---|---|---|---|---|
| 2021-22 | WPG | 18 | 0.38 | 1.33 | -0.67 | -0.17 | -2.34 | -0.23 | -1.57 | 3.06 | |
| 2022-23 | WPG | 51 | 1.14 | 3.20 | -0.96 | -0.82 | -1.01 | -0.88 | -1.36 | 1.00 | |
| 2023-24 | WPG | 71 | 0.05 | -0.21 | 0.13 | 0.45 | -0.52 | 0.20 | -1.30 | -0.52 | |
| 2024-25 | WPG | 82 | -0.12 | 0.61 | -0.77 | -0.85 | -0.36 | 0.30 | -1.43 | -0.13 | |
| 2025-26 | WPG | 68 | 0.02 | 0.63 | -0.72 | -1.37 | -0.58 | 1.52 | -1.32 | 0.51 |
Situational and Secondary Archetypes
| Season | Team(s) | GP | TOI | 5v5 TOI | 5v4 TOI | 4v5 TOI | Possession | Drive | Suppress | Faceoffs |
|---|---|---|---|---|---|---|---|---|---|---|
| 2021-22 | WPG | 18 | 0.49 | -0.78 | -2.01 | 1.36 | 1.23 | 0.56 | - | |
| 2022-23 | WPG | 51 | 0.48 | -0.32 | -1.94 | 0.42 | 0.09 | 0.56 | - | |
| 2023-24 | WPG | 71 | -0.64 | 0.19 | -2.02 | 1.05 | 0.24 | 1.48 | 37.6 | |
| 2024-25 | WPG | 82 | 0.18 | -0.04 | -2.14 | 1.22 | 0.35 | 1.50 | - | |
| 2025-26 | WPG | 68 | 0.05 | 0.31 | -1.98 | 0.61 | 0.42 | 0.34 | - |
5v5 Individual Stats
| Season | Team(s) | GP | TOI | G/60 | A/60 | Pts/60 | xG/60 | GAE/60 | Sh% | xSh% | Sh%AE | %SA Rush | %SA Reb. |
|---|---|---|---|---|---|---|---|---|---|---|---|---|---|
| 2021-22 | WPG | 18 | 230:52 | 0.52 | 1.04 | 1.56 | 0.55 | -0.03 | 11.76 | 12.46 | -0.70 | 3.57 | 0.00 |
| 2022-23 | WPG | 51 | 653:18 | 0.46 | 1.65 | 2.11 | 0.69 | -0.23 | 6.94 | 10.49 | -3.55 | 2.02 | 4.04 |
| 2023-24 | WPG | 71 | 795:30 | 0.83 | 0.98 | 1.81 | 0.69 | 0.14 | 10.28 | 8.50 | 1.78 | 4.29 | 6.43 |
| 2024-25 | WPG | 82 | 1063:45 | 0.51 | 1.02 | 1.52 | 0.71 | -0.20 | 8.18 | 11.47 | -3.29 | 2.89 | 6.36 |
| 2025-26 | WPG | 68 | 849:57 | 0.35 | 1.06 | 1.41 | 0.80 | -0.45 | 5.00 | 11.31 | -6.31 | 5.00 | 6.25 |
5v5 On Ice Stats
| Season | Team(s) | GP | TOI | SAF/60 | GF/60 | xGF/60 | SAA/60 | GA/60 | xGA/60 | GF% | xGF% | xGF Rel | xGA Rel | xGF% Rel |
|---|---|---|---|---|---|---|---|---|---|---|---|---|---|---|
| 2021-22 | WPG | 18 | 230:52 | 44.96 | 1.82 | 2.62 | 40.80 | 1.56 | 2.30 | 53.85 | 53.30 | 0.36 | -0.11 | 4.91 |
| 2022-23 | WPG | 51 | 653:18 | 42.89 | 2.66 | 2.70 | 40.13 | 1.74 | 2.44 | 60.42 | 52.52 | -0.02 | -0.21 | 1.83 |
| 2023-24 | WPG | 71 | 795:30 | 44.88 | 2.94 | 2.37 | 36.58 | 1.81 | 1.97 | 61.90 | 54.68 | -0.13 | -0.38 | 3.05 |
| 2024-25 | WPG | 82 | 1063:45 | 42.64 | 2.31 | 2.42 | 36.38 | 1.64 | 2.18 | 58.57 | 52.58 | 0.01 | -0.08 | 0.95 |
| 2025-26 | WPG | 68 | 849:57 | 40.52 | 1.84 | 2.32 | 39.11 | 2.26 | 2.28 | 44.83 | 50.36 | -0.06 | -0.35 | 2.91 |
NHL Edge Stats
| Skating | Shooting | Zone Time | |||||||||||
|---|---|---|---|---|---|---|---|---|---|---|---|---|---|
| Season | GP | Top Speed | Bursts>20/mi | Avg. Speed | Top Speed | Avg. Speed | %Long Range | %Mid Range | %High Danger | ES DZ% | ES NZ% | ES OZ% | |
| This table is for Basic and Premium subscribers only. To view please login to and/or subscribe to one of our subscription plans. | |||||||||||||
Legend
| Percentile 0-25 | Percentile 25-50 | Percentile 50-75 | Percentile 75-100 |
5v5 Lines
| Season | Teammate | Teammate | Team | TOI | GF/60 | GA/60 | GF% | xGF/60 | xGA/60 | xGF% | xGF Rel | xGA Rel | xGF% Rel |
|---|
Glossary
| Type | Statistic | Definition |
|---|---|---|
| Individual | G/60 | Goals Against per 60 minutes. |
| Individual | A/60 | Assists per 60 minutes. |
| Individual | Pts/60 | Points per 60 minutes. |
| Individual | xG/60 | Expected Goals per 60 minutes. |
| Individual | GAE/60 | Goals Above Expected (G/60 - xG/60). |
| Individual | Sh% | Shooting Percentage. |
| Individual | xSh% | Expected Shooting Percentage. |
| Individual | Sh%AE | Shooting percentage above expected (Sh% - xSh%). |
| Individual | %SA Rush | Percentage of shot attempts determined to be on the rush. |
| Individual | %SA Reb. | Percentage of shot attempts determined to be from rebounds. |
| On Ice | SAF/60 | Shot Attempts For per 60 minutes. |
| On Ice | GF/60 | Goals For per 60 minutes. |
| On Ice | xGF/60 | Expected Goals For per 60 minutes. |
| On Ice | SAA/60 | Shot Attempts Against per 60 minutes (lower is better). |
| On Ice | GA/60 | Goals Against per 60 minutes (lower is better). |
| On Ice | xGA/60 | Expected Goals Against per 60 minutes (lower is better). |
| On Ice | GF% | Goals For Percentage = Goals For / (Goals For + Goals Against) |
| On Ice | xGF% | Expected Goals For Percentage = Expected Goals For / (Expected Goals For + Expected Goals Against) |
| On Ice | xGF Rel | xGF/60 when On Ice - xGF/60 when not On Ice. |
| On Ice | xGA Rel | xGA/60 when On Ice - xGA/60 when not On Ice (lower is better). |
| On Ice | xGF% Rel | xGF% when On Ice - xGF% when not On Ice. |
News and Opinions
-
Media availability with Cole Perfetti after signing a five-year contract with the Winnipeg Jets at Illegal Curve Hockey (Mon Jul 20, 2026)
-
WST | Breaking down Cole Perfetti’s new contract with the Winnipeg Jets at Illegal Curve Hockey (Sat Jul 18, 2026)
-
NHL Network | Elliotte Friedman talks Winnipeg Jets, Cole Perfetti and Connor Hellebuyck at Illegal Curve Hockey (Fri Jul 17, 2026)
-
Screen Shots: Jets Invest Wisely In Cole Perfetti, Plus Gavin McKenna Expectations at The Hockey News (Thu Jul 16, 2026)
-
Perfetti Inks Long-Term Deal with Jets at Arctic Ice Hockey (Thu Jul 16, 2026)
-
Jets re-sign forward Cole Perfetti to a 5-year contract at Yahoo Sports NHL (Wed Jul 15, 2026)
-
Winnipeg Jets Re-Sign Cole Perfetti to 5-Year Contract With $6 Million AAV at The Hockey Writers (Wed Jul 15, 2026)
-
Cole Perfetti lands a huge five-year contract as the Jets avoid arbitration at Habs Fanatics (Wed Jul 15, 2026)
-
Arbitrage évité : Cole Perfetti s'entend à long terme avec les Jets de Winnipeg at HABSolument Fan (Wed Jul 15, 2026)
-
Winnipeg Jets sign Cole Perfetti to a five-year contract at Illegal Curve Hockey (Wed Jul 15, 2026)
-
Winnipeg Jets and Cole Perfetti’s arbitration date set for July 20th at Illegal Curve Hockey (Mon Jul 13, 2026)
-
Not enough production from the rest of the forward group: Jets Nation year in review at Jets Nation (Sun Jul 12, 2026)
-
Winnipeg Jets’ 2026 Offseason: Next Steps After Draft & Free-Agent Frenzy at The Hockey Writers (Wed Jul 8, 2026)
-
Jets’ 2026 Free Agency Class: Who’s Re-Signed, Who’s Gone, & Who’s Left at The Hockey Writers (Tue Jul 7, 2026)
-
Winnipeg Jets Cole Perfetti files for salary arbitration at Illegal Curve Hockey (Sun Jul 5, 2026)
-
Jets Extend Qualifying Offers to Cole Perfetti and Tyrel Bauer, Part Ways With Former High Draft Pick at Yahoo Sports NHL (Mon Jun 29, 2026)
-
What does Cole Perfetti’s next contract look like as a restricted free agent this summer? at Jets Nation (Wed May 20, 2026)
-
WST | Winnipeg Jets 2026 UFA/RFA Preview (Perfetti, Toews, Comrie & more) at Illegal Curve Hockey (Wed May 13, 2026)
-
One year ago today: Winnipeg Jets’ Cole Perfetti’s Manitoba Miracle at Illegal Curve Hockey (Mon May 4, 2026)
-
Winnipeg Jets’ Cole Perfetti focused on future as RFA talks loom at Illegal Curve Hockey (Mon Apr 27, 2026)
-
Winnipeg Jets end of season media availability: Cole Perfetti at Illegal Curve Hockey (Fri Apr 17, 2026)
-
Jets/Blue Jackets Gameday: Bowness, Perfetti & More at The Hockey Writers (Sat Apr 4, 2026)
-
Recap: Rangers Drop 3-2 Shootout Decision to Jets Despite Garand’s 35-Save Debut at Blue Shirt Banter (Sun Mar 22, 2026)
-
Kypreos: Jets receiving multiple calls on Cole Perfetti at Jets Nation (Fri Feb 27, 2026)
-
Perfetti pots overtime winner as Jets edge Canucks 3-2 at Jets Nation (Thu Feb 26, 2026)
-
Cole Perfetti scores in overtime in the Jets' 3-2 victory over the Canucks at Yahoo Sports NHL (Thu Feb 26, 2026)
-
Maccelli emerging, Stolarz speculation, and a Jets trade target: Leaflets at The Leafs Nation (Sat Jan 10, 2026)
-
4 Winnipeg Jets Who Need to Step Up in 2026 at The Hockey Writers (Wed Dec 31, 2025)
-
Hockey Night in Canada: Winnipeg Jets vs. Edmonton Oilers game day at Jets Nation (Sat Dec 6, 2025)
-
Jets’ Injury Returnees Lowry, Perfetti, & Samberg Getting Back Up to Speed Nicely at The Hockey Writers (Thu Nov 20, 2025)
-
Fantasy Hockey Waiver Wire: Cole Perfetti, Ivan Barbashev among top adds to start the week at Yahoo Sports NHL (Mon Nov 10, 2025)
-
Jets depart California winless after a disappointing 4-1 loss to the Ducks at Jets Nation (Mon Nov 10, 2025)
-
Cole Perfetti set to make his regular season debut for the Winnipeg Jets tnt vs Ducks at Illegal Curve Hockey (Sun Nov 9, 2025)
-
Cole Perfetti wearing a regular jersey at Winnipeg Jets morning skate in San Jose at Illegal Curve Hockey (Fri Nov 7, 2025)
-
Injured Winnipeg Jets Dylan Samberg and Cole Perfetti could get into practice contact by end of road trip at Illegal Curve Hockey (Tue Nov 4, 2025)
-
Cole Perfetti joins Winnipeg Jets IR skate with Adam Lowry & Dylan Samberg at Illegal Curve Hockey (Mon Oct 20, 2025)
-
Cole Perfetti out week-to-week with an ankle injury, Heinola and Duehr placed on waivers at Jets Nation (Sun Oct 5, 2025)
-
Jets’ Perfetti Out Week to Week with Ankle Injury at The Hockey Writers (Sun Oct 5, 2025)
-
Winnipeg Jets head coach Scott Arniel indicated Cole Perfetti is week-to-week with ankle injury at Illegal Curve Hockey (Sun Oct 5, 2025)
-
Cole Perfetti leaves final Winnipeg Jets exhibition game with lower-body injury at Illegal Curve Hockey (Sat Oct 4, 2025)
-
After Paying AHL Dues, Cole Perfetti is Ready For NHL Breakout at Yahoo Sports NHL (Mon Sep 29, 2025)
-
Cole Perfetti and Winnipeg Jets head coach Scott Arniel reflect on the impact of the Manitoba Miracle goal at Illegal Curve Hockey (Fri Sep 19, 2025)
-
Day 2 of Winnipeg Jets training camp: Cole Perfetti at Illegal Curve Hockey (Fri Sep 19, 2025)
-
What Does Cole Perfetti's Future Look Like With The Winnipeg Jets? at The Hockey News (Tue Jul 22, 2025)
-
Is Cole Perfetti the Winnipeg Jets top breakout candidate for the 2025-26 season? at Jets Nation (Sun Jul 20, 2025)
-
Winnipeg Jets youthful experiments cut short with need for results at Jets White Out (Tue Oct 24, 2023)
-
Vilardi and Ehlers look like potential steals: Jets Fantasy Hockey Preview at Jets White Out (Wed Oct 4, 2023)
-
Why giving Cole Perfetti a chance at center is the right move for Winnipeg at Jets White Out (Thu Sep 21, 2023)
-
Cole Perfetti has all the tools for a big breakout season at Jets White Out (Tue Sep 5, 2023)
-
What Cole Perfetti’s return could mean for the Winnipeg Jets at Jets White Out (Mon Apr 10, 2023)
-
New Jersey Devils’ 2020 NHL Draft Preview at Devils Army (Tue Oct 6, 2020)
-
Devils Draft Series: Cole Perfetti, Prolific Scoring Forward at Devils Army (Wed May 6, 2020)
Current Contract
Cole Perfetti signed a $30,000,000 5-year contract with the Winnipeg Jets and General Manager Kevin Cheveldayoff on July 15, 2026 with an AAV of $6,000,000. This contract will start in 2026-27 and end after the 2030-31 season. In the first season of the contract the cap hit was equivalent to 5.77% of the salary cap.
Standard Contract (RFA) ( ) (0 ratings)
Cole Perfetti signed a $6,500,000 2-year contract with the Winnipeg Jets and General Manager Kevin Cheveldayoff on September 23, 2024 with an AAV of $3,250,000. This contract will start in 2024-25 and end after the 2025-26 season. In the first season of the contract the cap hit was equivalent to 3.69% of the salary cap.
Standard Contract (RFA) ( ) (0 ratings)
| Season | Age* | Clause | Cap Hit | AAV | Perf. Bonus | Sign. Bonus | Salary | Compensation | Minors Salary | Status | |
|---|---|---|---|---|---|---|---|---|---|---|---|
| 2024-25 | 22 | $3,250,000 | $3,250,000 | - | - | $3,000,000 | $3,000,000 | $3,000,000 | RFA | ||
| 2025-26 | 23 | $3,250,000 | $3,250,000 | - | - | $3,500,000 | $3,500,000 | $3,500,000 | RFA-arb | ||
| Total | - | - | $6,500,000 | $6,500,000 | $6,500,000 |
Cole Perfetti signed a $2,775,000 3-year contract with the Winnipeg Jets and General Manager Kevin Cheveldayoff on November 9, 2020 with an AAV of $925,000. This contract will start in 2020-21 and end after the 2023-24 season. In the first season of the contract the cap hit was equivalent to 1.13% of the salary cap.
Entry Level Contract ( ) (0 ratings)
| Season | Age* | Clause | Cap Hit | AAV | Perf. Bonus | Sign. Bonus | Salary | Compensation | Minors Salary | Status | |
|---|---|---|---|---|---|---|---|---|---|---|---|
| 2020-21 | 18 | $925,000 | $1,658,333 | - | $92,500 | - | $92,500 | - | ELC | ||
| 2021-22 | 19 | $894,167 | $1,627,500 | $500,000 | $92,500 | $832,500 | $925,000 | $80,000 | ELC | ||
| 2022-23 | 20 | $894,167 | $1,627,500 | $850,000 | $92,500 | $832,500 | $925,000 | $80,000 | ELC | ||
| 2023-24 | 21 | $894,167 | $1,627,500 | $850,000 | - | $832,500 | $832,500 | $80,000 | ELC | ||
| Total | $2,200,000 | $277,500 | $2,497,500 | $2,775,000 | $240,000 |
Career Statistics
| Regular Season | Playoffs | |||||||||||||||||||
|---|---|---|---|---|---|---|---|---|---|---|---|---|---|---|---|---|---|---|---|---|
| Season | League | Team | GP | G | A | Pts | +/- | PIM | Shots | Sh% | TOI/G | GP | G | A | Pts | +/- | PIM | Shots | Sh% | TOI/G |
| 2011-12 | Brick Invitational | Toronto Bulldogs | 6 | 5 | 4 | 9 | 2 | 2 | 4 | 6 | 4 | |||||||||
| 2013-14 | QC Int PW | Whitby Wildcats | 4 | 2 | 1 | 3 | ||||||||||||||
| 2014-15 | WSI U13 | Pro Hockey Selects U13 | 6 | 4 | 3 | 7 | 4 | |||||||||||||
| 2015-16 | WSI U14 | Pro Hockey Selects U14 | 7 | 4 | 10 | 14 | 4 | |||||||||||||
| 2015-16 | WSI U15 | Pro Hockey Selects U15 | 7 | 3 | 4 | 7 | 4 | |||||||||||||
| 2016-17 | OJDL | Cobourg Cougars East | 10 | 8 | 5 | 13 | ||||||||||||||
| 2016-17 | WSI U15 | Oshawa Generals Selects U15 | 9 | 2 | 12 | 14 | ||||||||||||||
| 2016-17 | ETAHL U16 | Whitby Wildcats U16 AAA | 27 | 19 | 26 | 45 | 34 | 6 | 5 | 4 | 9 | |||||||||
| 2017-18 | U16 AAA | Vaughan Kings U16 AAA | 64 | 52 | 73 | 125 | 16 | |||||||||||||
| 2017-18 | GTHL U16 | Vaughan Kings U16 AAA | 33 | 29 | 32 | 61 | 14 | |||||||||||||
| 2017-18 | OJHL | Haliburton County Huskies | 5 | 2 | 4 | 6 | ||||||||||||||
| 2017-18 | OGC-16 | Team GTHL Red | 4 | 4 | 2 | 6 | 2 | |||||||||||||
| 2018-19 | WHC-17 | Canada White U17 | 5 | 2 | 7 | 9 | 4 | |||||||||||||
| 2018-19 | OHL | Saginaw Spirit | 63 | 37 | 37 | 74 | +36 | 10 | 16 | 8 | 6 | 14 | +9 | 4 | ||||||
| 2019-20 | OHL | Saginaw Spirit | 61 | 37 | 74 | 111 | +49 | 16 | ||||||||||||
| 2019-20 | Hlinka Gretzky Cup | Canada U18 | 5 | 8 | 4 | 12 | +10 | 2 | ||||||||||||
| 2020-21 | AHL | Manitoba Moose | 32 | 9 | 17 | 26 | +1 | 2 | ||||||||||||
| 2020-21 | WC | Canada | 10 | 2 | 0 | 2 | 4 | |||||||||||||
| 2020-21 | WJC-20 | Canada U20 | 7 | 2 | 4 | 6 | +5 | 2 | ||||||||||||
| 2021-22 | NHL | Winnipeg Jets | 18 | 2 | 5 | 7 | +1 | 21 | 9.5 | 14:09 | ||||||||||
| 2021-22 | AHL | Manitoba Moose | 17 | 6 | 9 | 15 | +6 | 2 | ||||||||||||
| 2022-23 | NHL | Winnipeg Jets | 51 | 8 | 22 | 30 | +10 | 16 | 90 | 8.9 | 14:58 | |||||||||
| 2023-24 | NHL | Winnipeg Jets | 71 | 19 | 19 | 38 | +13 | 12 | 142 | 13.4 | 13:35 | 1 | 3 | 0.0 | 10:56 | |||||
| 2024-25 | NHL | Winnipeg Jets | 82 | 18 | 32 | 50 | +14 | 20 | 143 | 12.6 | 15:11 | 13 | 3 | 3 | 6 | -4 | 2 | 28 | 10.7 | 16:17 |
| 2025-26 | NHL | Winnipeg Jets | 68 | 12 | 20 | 32 | -9 | 20 | 136 | 8.8 | 15:37 | |||||||||
| NHL Career | 290 | 59 | 98 | 157 | +29 | 68 | 532 | 11.1 | 14:48 | 14 | 3 | 3 | 6 | -4 | 2 | 31 | 9.7 | 15:54 | ||