
 Charlie Coyle
| Position | Center / Right Wing | Current Team | Columbus Blue Jackets |
| Shoots | Right | Current Contract | 6 years ($6.0M CapHit) |
| Height | 6'3" | Expires | 2031-32 |
| Weight (lbs) | 221 | Expiry Age (Jun 30) | 40 |
| Age (DOB) | 34 (Mar 2, 1992) | Expiry Status | UFA |
| Drafted | 2010, Round 1, Overall 28 (SJS) |
| Date | Team | Transaction | |
|---|---|---|---|
| May 12, 2026 | Columbus Blue Jackets | Signed 6 years @ $6.000M AAV starting in 2026-27 | |
| Jun 27, 2025 | Columbus Blue Jackets | Acquired from Colorado Avalanche | |
| Jun 27, 2025 | Colorado Avalanche | Traded to Columbus Blue Jackets | |
| Mar 7, 2025 | Colorado Avalanche | Acquired from Boston Bruins | |
| Mar 7, 2025 | Boston Bruins | Traded to Colorado Avalanche | |
| Nov 27, 2019 | Boston Bruins | Signed 6 years @ $5.250M AAV starting in 2020-21 | |
| Oct 23, 2014 | Minnesota Wild | Signed 5 years @ $3.200M AAV starting in 2015-16 | |
| Mar 1, 2012 | Minnesota Wild | Signed to an entry level contract. |
Player Card(s)
URL: https://thestanleycap.com/cdn/player_cards/20252026/charlie-coyle-8475745.png
URL: https://thestanleycap.com/cdn/player_cards/20242025/charlie-coyle-8475745.png
URL: https://thestanleycap.com/cdn/player_cards/20232024/charlie-coyle-8475745.png
About Player Cards
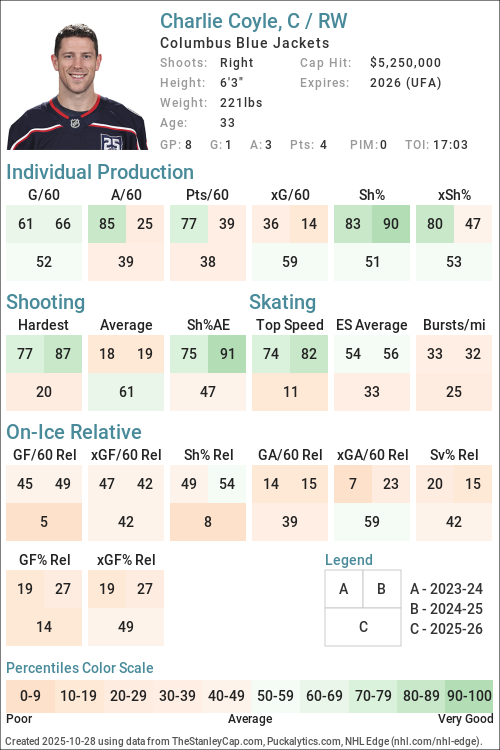
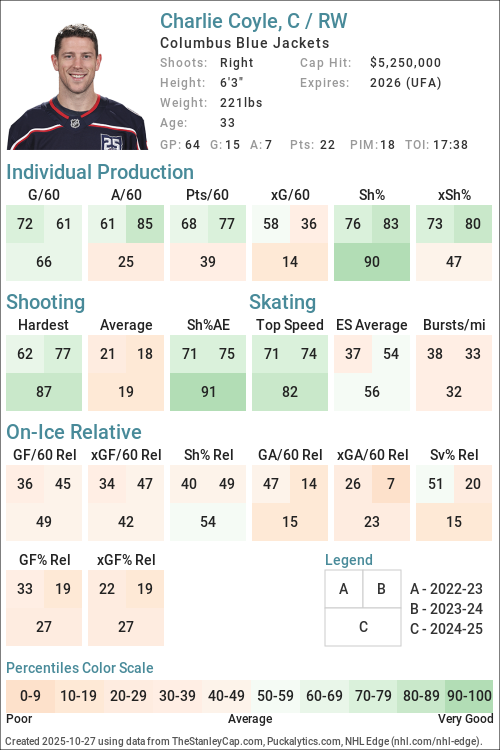
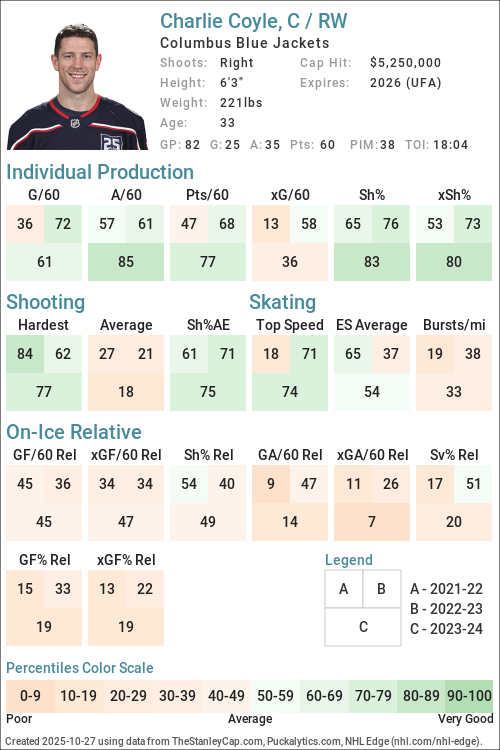
Player cards present an infographic of a players performance using a series of Player Archetypes developed for Puckalytics.com and TheStanleyCap.com. The boxes in the rink image show the archetype ratings for the season specified in the card while the graphs to the right show the five-year trends for those archetypes.
Except for Faceoffs, the values shown are the players z-score (standard deviation from the mean) for the specific metric used to calculate the archetype values. When calculating z-scores forwards were compared to forwards and defensemen were compared to defensemen. Positive values indicate the player is above average and shaded in blue, while negative values indicate the player is below average and shaded in pink. The five year trend charts show a range of -4.0 to 4.0.
The value shown for Faceoffs is the faceoff winning percentage rather than their z-score with winning percentages below 50 in pink shades and above 50 in blue shades.
All archetypes are 5v5 except 5v4 TOI, 4v5 TOI, Skating (even strength) and Faceoffs (all situations). Archetypes use regular season data only.
Archetypes Summary
- Sniper - Measures the to score above the expected goal rate.
- Rebound - Measures the percent of a players shot attempts that come from rebounds (forwards only).
- 5v4 TOI - Powerplay ice time, calculated as the percentage of his teams 5v4 ice time that the player was on the ice for.
- Shooter - Measures whether a players points come from shots (goals or assists on rebounds from his shots).
- Producer - Measures a players ability to produce goals and assists, adjusted for quality of teammates.
- Playmaker - Measures whether a players points come from passes.
- Drive - Measures a players ability to drive puck possession and generate shot attempts for his team.
- Rush - Measures the percent of a players shot attempts that come from rush plays
- Possession - An indicator of a players ability to improve his teams puck possession game.
- Faceoffs - Faceoff Winning Percentage (min. 75 faceoffs taken).
- 5v5 TOI - The percentage of his teams 5v5 TOI that the player was on the ice for.
- Suppress - Measures a players ability to suppress opponent puck possession and shot attempts against.
- Skating - An indicator of a players skating ability, or speed bursts above 20mph per mile skated.
- Defend - An indicator of a players ability to suppress shot quality against.
- 4v5 TOI - Penalty Kill ice time, calculated as the percentage of his teams 4v5 ice time that the player was on the ice for.
Data Sources
- Salary data is from TheStanleyCap.com
- Skating data is from NHL Edge
- Other statistics are from Puckalytics.com and derived from data from NHL.com
Terms of Use
You are free to use include player cards in written articles, share on social media, or on other public websites under the following conditions:
- You credit TheStanleyCap.com as the source and provide a link back to TheStanleyCap.com or this player page.
- You do not mass copy/duplicate/publish dozens or hundreds of player cards. A few, or a handful for a written article is fine. Be reasonable. Fair use rules apply.
- If you are a high-traffic website you must download and host the image(s) on your site rather than overload TheStanleyCap servers with traffic.
Note: Player cards will update daily throughout the season so if you want to include snapshot then you must download the image.
If you have any questions, send an e-mail to the e-mail address at the top of this page.
Read Introducing Player Archetypes on HockeyAnalysis.com for more details on archetype calculations.
Core Archetypes
| Season | Team(s) | GP | TOI | Producer | Playmaker | Shooter | Sniper | Rebound | Rush | Skating | Defend |
|---|---|---|---|---|---|---|---|---|---|---|---|
| 2015-16 | MIN | 82 | 0.49 | -0.38 | 1.05 | 1.38 | 0.95 | 1.68 | - | -0.00 | |
| 2016-17 | MIN | 82 | 1.47 | 2.10 | -0.31 | -0.24 | 0.34 | -0.82 | - | -0.73 | |
| 2017-18 | MIN | 66 | 0.41 | 0.78 | -0.39 | -0.31 | 0.34 | -1.18 | - | 1.31 | |
| 2018-19 | BOS, MIN | 81 | -0.49 | -0.16 | -0.62 | -0.71 | 1.10 | -1.14 | - | -0.53 | |
| 2019-20 | BOS | 70 | 0.32 | 0.07 | 0.18 | 0.19 | -1.39 | -0.22 | - | -0.27 | |
| 2020-21 | BOS | 51 | -1.09 | -0.61 | -0.93 | -0.44 | -0.89 | 0.82 | - | -0.60 | |
| 2021-22 | BOS | 82 | -0.27 | 0.21 | -0.66 | 0.32 | 0.04 | 0.75 | -0.82 | -0.87 | |
| 2022-23 | BOS | 82 | 0.32 | -0.09 | 0.31 | 0.35 | -0.30 | 0.95 | -0.49 | 0.04 | |
| 2023-24 | BOS | 82 | 1.14 | 1.62 | -0.08 | 0.58 | -0.72 | -0.81 | -0.57 | -0.80 | |
| 2024-25 | BOS, COL | 83 | -0.43 | -0.87 | 0.32 | 1.03 | -0.69 | -0.07 | -0.58 | -0.96 | |
| 2025-26 | CBJ | 82 | 1.51 | 2.54 | -0.34 | -0.51 | 0.99 | 0.01 | -0.65 | 0.84 |
Situational and Secondary Archetypes
| Season | Team(s) | GP | TOI | 5v5 TOI | 5v4 TOI | 4v5 TOI | Possession | Drive | Suppress | Faceoffs |
|---|---|---|---|---|---|---|---|---|---|---|
| 2015-16 | MIN | 82 | 0.92 | -0.13 | -1.02 | -0.13 | -0.10 | -0.11 | 45.4 | |
| 2016-17 | MIN | 82 | 0.62 | 0.34 | -1.35 | 0.66 | 0.31 | 0.78 | 46.0 | |
| 2017-18 | MIN | 66 | 0.58 | -0.55 | -0.55 | -0.60 | -0.00 | -1.15 | 52.2 | |
| 2018-19 | BOS, MIN | 81 | 0.53 | -0.13 | -0.43 | -0.29 | 0.13 | -0.60 | 45.9 | |
| 2019-20 | BOS | 70 | 0.61 | -0.23 | -0.71 | 0.65 | 0.26 | 0.75 | 46.6 | |
| 2020-21 | BOS | 51 | 0.19 | -0.72 | 0.30 | -1.83 | -1.54 | -1.44 | 48.3 | |
| 2021-22 | BOS | 82 | 0.27 | -0.05 | 0.28 | -1.17 | -0.31 | -1.72 | 49.1 | |
| 2022-23 | BOS | 82 | 0.72 | -1.29 | 1.35 | -0.91 | -0.56 | -0.76 | 52.6 | |
| 2023-24 | BOS | 82 | 0.27 | -0.18 | 1.24 | -0.97 | -0.31 | -1.42 | 51.6 | |
| 2024-25 | BOS, COL | 83 | 0.08 | -0.31 | 0.93 | -0.48 | 0.04 | -0.93 | 48.6 | |
| 2025-26 | CBJ | 82 | 0.15 | 0.32 | 1.20 | 0.22 | 0.23 | 0.01 | 50.7 |
5v5 Individual Stats
| Season | Team(s) | GP | TOI | G/60 | A/60 | Pts/60 | xG/60 | GAE/60 | Sh% | xSh% | Sh%AE | %SA Rush | %SA Reb. |
|---|---|---|---|---|---|---|---|---|---|---|---|---|---|
| 2015-16 | MIN | 82 | 1079:48 | 0.83 | 0.72 | 1.56 | 0.58 | 0.25 | 14.71 | 10.26 | 4.44 | 7.35 | 7.35 |
| 2016-17 | MIN | 82 | 1064:04 | 0.62 | 1.52 | 2.14 | 0.69 | -0.07 | 8.73 | 9.70 | -0.97 | 2.33 | 5.81 |
| 2017-18 | MIN | 66 | 849:15 | 0.57 | 1.20 | 1.77 | 0.64 | -0.07 | 8.60 | 9.67 | -1.07 | 1.63 | 5.69 |
| 2018-19 | MIN | 60 | 768:37 | 0.62 | 1.09 | 1.72 | 0.75 | -0.13 | 8.60 | 10.37 | -1.77 | 1.63 | 9.76 |
| 2018-19 | BOS | 21 | 277:18 | 0.43 | 0.43 | 0.87 | 0.79 | -0.36 | 5.71 | 10.43 | -4.71 | 2.27 | 2.27 |
| 2018-19 | BOS, MIN | 81 | 1045:55 | 0.57 | 0.92 | 1.49 | 0.76 | -0.19 | 7.81 | 10.39 | -2.58 | 1.80 | 7.78 |
| 2019-20 | BOS | 70 | 902:18 | 0.80 | 1.00 | 1.80 | 0.76 | 0.04 | 11.01 | 10.45 | 0.56 | 3.38 | 2.03 |
| 2020-21 | BOS | 51 | 620:57 | 0.39 | 0.58 | 0.97 | 0.50 | -0.12 | 5.88 | 7.67 | -1.79 | 5.49 | 3.30 |
| 2021-22 | BOS | 82 | 1017:57 | 0.59 | 1.00 | 1.59 | 0.53 | 0.06 | 11.24 | 10.16 | 1.08 | 5.51 | 6.30 |
| 2022-23 | BOS | 82 | 1056:36 | 0.85 | 1.08 | 1.93 | 0.80 | 0.05 | 12.93 | 12.20 | 0.73 | 5.66 | 6.29 |
| 2023-24 | BOS | 82 | 1029:18 | 0.76 | 1.28 | 2.04 | 0.64 | 0.12 | 14.13 | 11.87 | 2.26 | 2.17 | 5.80 |
| 2024-25 | COL | 19 | 211:10 | 0.57 | 1.70 | 2.27 | 0.50 | 0.07 | 13.33 | 11.63 | 1.70 | 0.00 | 9.52 |
| 2024-25 | BOS | 64 | 812:58 | 0.81 | 0.37 | 1.18 | 0.60 | 0.21 | 16.42 | 12.24 | 4.18 | 2.78 | 4.63 |
| 2024-25 | BOS, COL | 83 | 1024:08 | 0.76 | 0.64 | 1.41 | 0.58 | 0.18 | 15.85 | 12.12 | 3.73 | 2.33 | 5.43 |
| 2025-26 | CBJ | 82 | 1032:37 | 0.64 | 1.68 | 2.32 | 0.80 | -0.16 | 11.11 | 13.90 | -2.79 | 2.65 | 11.26 |
5v5 On Ice Stats
| Season | Team(s) | GP | TOI | SAF/60 | GF/60 | xGF/60 | SAA/60 | GA/60 | xGA/60 | GF% | xGF% | xGF Rel | xGA Rel | xGF% Rel |
|---|---|---|---|---|---|---|---|---|---|---|---|---|---|---|
| 2015-16 | MIN | 82 | 1079:48 | 37.40 | 2.06 | 1.98 | 39.95 | 1.89 | 1.99 | 52.11 | 49.88 | -0.04 | 0.03 | -0.94 |
| 2016-17 | MIN | 82 | 1064:04 | 42.01 | 2.82 | 2.36 | 39.53 | 2.31 | 1.97 | 54.95 | 54.59 | 0.03 | 0.03 | -0.14 |
| 2017-18 | MIN | 66 | 849:15 | 39.21 | 2.47 | 2.35 | 45.29 | 2.05 | 2.32 | 54.69 | 50.32 | 0.17 | 0.37 | -2.44 |
| 2018-19 | MIN | 60 | 768:37 | 43.40 | 3.04 | 2.49 | 39.34 | 2.89 | 1.96 | 51.32 | 55.94 | 0.10 | -0.03 | 1.38 |
| 2018-19 | BOS | 21 | 277:18 | 45.01 | 1.08 | 2.50 | 38.08 | 1.73 | 2.19 | 38.46 | 53.32 | -0.23 | 0.02 | -2.38 |
| 2018-19 | BOS, MIN | 81 | 1045:55 | 43.83 | 2.52 | 2.49 | 39.01 | 2.58 | 2.02 | 49.44 | 55.22 | 0.01 | -0.02 | 0.32 |
| 2019-20 | BOS | 70 | 902:18 | 42.69 | 2.59 | 2.48 | 38.24 | 1.86 | 1.96 | 58.21 | 55.80 | 0.17 | -0.21 | 4.37 |
| 2020-21 | BOS | 51 | 620:57 | 39.81 | 1.74 | 2.00 | 40.39 | 2.51 | 2.39 | 40.91 | 45.56 | -0.48 | 0.41 | -10.10 |
| 2021-22 | BOS | 82 | 1017:57 | 45.92 | 2.53 | 2.58 | 41.38 | 2.77 | 2.31 | 47.78 | 52.78 | -0.17 | 0.31 | -5.22 |
| 2022-23 | BOS | 82 | 1056:36 | 41.45 | 2.90 | 2.73 | 42.08 | 1.82 | 2.54 | 61.45 | 51.78 | -0.17 | 0.15 | -3.08 |
| 2023-24 | BOS | 82 | 1029:18 | 37.66 | 2.56 | 2.37 | 46.81 | 2.51 | 2.66 | 50.57 | 47.09 | -0.04 | 0.34 | -3.85 |
| 2024-25 | COL | 19 | 211:10 | 46.88 | 3.41 | 2.89 | 36.09 | 2.27 | 2.12 | 60.00 | 57.70 | 0.27 | -0.04 | 2.89 |
| 2024-25 | BOS | 64 | 812:58 | 38.53 | 1.99 | 2.32 | 44.06 | 2.66 | 2.44 | 42.86 | 48.84 | 0.02 | 0.16 | -1.51 |
| 2024-25 | BOS, COL | 83 | 1024:08 | 40.25 | 2.28 | 2.44 | 42.42 | 2.58 | 2.37 | 46.99 | 50.74 | 0.06 | 0.12 | -0.73 |
| 2025-26 | CBJ | 82 | 1032:37 | 42.71 | 3.02 | 2.83 | 41.14 | 2.09 | 2.52 | 59.09 | 52.89 | 0.19 | -0.03 | 2.02 |
NHL Edge Stats
| Skating | Shooting | Zone Time | |||||||||||
|---|---|---|---|---|---|---|---|---|---|---|---|---|---|
| Season | GP | Top Speed | Bursts>20/mi | Avg. Speed | Top Speed | Avg. Speed | %Long Range | %Mid Range | %High Danger | ES DZ% | ES NZ% | ES OZ% | |
| This table is for Basic and Premium subscribers only. To view please login to and/or subscribe to one of our subscription plans. | |||||||||||||
Legend
| Percentile 0-25 | Percentile 25-50 | Percentile 50-75 | Percentile 75-100 |
5v5 Lines
| Season | Teammate | Teammate | Team | TOI | GF/60 | GA/60 | GF% | xGF/60 | xGA/60 | xGF% | xGF Rel | xGA Rel | xGF% Rel |
|---|
Glossary
| Type | Statistic | Definition |
|---|---|---|
| Individual | G/60 | Goals Against per 60 minutes. |
| Individual | A/60 | Assists per 60 minutes. |
| Individual | Pts/60 | Points per 60 minutes. |
| Individual | xG/60 | Expected Goals per 60 minutes. |
| Individual | GAE/60 | Goals Above Expected (G/60 - xG/60). |
| Individual | Sh% | Shooting Percentage. |
| Individual | xSh% | Expected Shooting Percentage. |
| Individual | Sh%AE | Shooting percentage above expected (Sh% - xSh%). |
| Individual | %SA Rush | Percentage of shot attempts determined to be on the rush. |
| Individual | %SA Reb. | Percentage of shot attempts determined to be from rebounds. |
| On Ice | SAF/60 | Shot Attempts For per 60 minutes. |
| On Ice | GF/60 | Goals For per 60 minutes. |
| On Ice | xGF/60 | Expected Goals For per 60 minutes. |
| On Ice | SAA/60 | Shot Attempts Against per 60 minutes (lower is better). |
| On Ice | GA/60 | Goals Against per 60 minutes (lower is better). |
| On Ice | xGA/60 | Expected Goals Against per 60 minutes (lower is better). |
| On Ice | GF% | Goals For Percentage = Goals For / (Goals For + Goals Against) |
| On Ice | xGF% | Expected Goals For Percentage = Expected Goals For / (Expected Goals For + Expected Goals Against) |
| On Ice | xGF Rel | xGF/60 when On Ice - xGF/60 when not On Ice. |
| On Ice | xGA Rel | xGA/60 when On Ice - xGA/60 when not On Ice (lower is better). |
| On Ice | xGF% Rel | xGF% when On Ice - xGF% when not On Ice. |
News and Opinions
-
What if the Boston Bruins didn't trade Charlie Coyle? at Causway Crowd (Wed Jul 15, 2026)
-
2026-27 Blue Jackets Roster Projection 2.0: The Charlie Coyle Effect at The Hockey Writers (Fri May 29, 2026)
-
Culture Change In Columbus May Begin With The Captaincy at 1st Ohio Battery (Fri May 29, 2026)
-
Blue Jackets Signing Charlie Coyle Signals Aggressive “Win Now” Push in 2026-27 at The Hockey Writers (Sat May 16, 2026)
-
Former Bruins forward Charlie Coyle gets brutally honest on re-signing with Columbus at Causway Crowd (Thu May 14, 2026)
-
What Charlie Coyle’s contract means for Bruins’ offseason, Pavel Zacha extension at Causway Crowd (Wed May 13, 2026)
-
The projected price to re-sign Kirby Dach has just been set by Charlie Coyle's $36 million deal at Habs Fanatics (Tue May 12, 2026)
-
Charlie Coyle was irreplaceable on the CBJ roster, and they had no choice but to re-sign him at Union Blue (Tue May 12, 2026)
-
How Rangers trade plans improved when Blue Jackets re-signed center Coyle at Forever Blueshirts (Tue May 12, 2026)
-
Former Wild standout just made Minnesota’s free agency plans a lot more difficult at Gone Puck Wild (Tue May 12, 2026)
-
Blue Jackets sign Charlie Coyle to a 6-year, $36 million extension at NBC Sports (Tue May 12, 2026)
-
NHL Rumors: Blue Jackets, Oilers, Golden Knights, Leafs, Lightning, and Stars at NHL Rumors (Tue May 12, 2026)
-
Charlie Coyle Re-Signing With Blue Jackets Shows Belief in Team’s Direction at The Hockey Writers (Tue May 12, 2026)
-
The Right Move: Charlie Coyle's Extension Is A Long One, But It Was A Must For A Blue Jackets Club In Need Of Leadership at 1st Ohio Battery (Tue May 12, 2026)
-
NHL Notebook: Vegas blocks Oilers from talking to Cassidy; pending UFA Coyle re-signs in Columbus at Canucks Army (Tue May 12, 2026)
-
The Daily: Another 20-Goal Scorer Off the Market; Would Red Wings Be Interested in Rakell? at Detroit Hockey Now (Tue May 12, 2026)
-
Three Pending UFA NHL Centers After Charlie Coyle Re-Signs With Blue Jackets at The Hockey News (Tue May 12, 2026)
-
NHL Rumors: Oilers Chasing Cassidy, Tippett Statement, Coyle Signs at The Hockey Writers (Tue May 12, 2026)
-
What Bringing Back Charlie Coyle Means To The Columbus Blue Jackets at Yahoo Sports NHL (Tue May 12, 2026)
-
Charlie Coyle, Blue Jackets agree to 6-year, $36 million contract extension at Yahoo Sports NHL (Tue May 12, 2026)
-
Red Wings avoid disastrous free agency signing at Octopus Thrower (Tue May 12, 2026)
-
Blue Jackets re-sign Charlie Coyle until 2032 at Jackets Cannon (Tue May 12, 2026)
-
Blue Jackets re-sign center Charlie Coyle to a six year contract extension at Union Blue (Tue May 12, 2026)
-
Staying Put: Blue Jackets Ink Veteran Charlie Coyle To Six-Year Contract Extension Worth $36 Million at 1st Ohio Battery (Tue May 12, 2026)
-
Former Bruins forward leads way near the top of one NHL writer's NHL free agent big board at Causway Crowd (Sun May 10, 2026)
-
Blue Jackets 2025-26 player review, Charlie Coyle was exactly what Columbus needed, but now can they keep him? at Union Blue (Mon May 4, 2026)
-
2026-27 Blue Jackets Roster Projection 1.0: Life Without Their UFA’s at The Hockey Writers (Wed Apr 29, 2026)
-
NHL reporter has a disastrous contract idea for a former aging Boston Bruins forward at Causway Crowd (Thu Apr 23, 2026)
-
3 Blue Jackets Unrestricted Free Agents That Should Be Re-Signed at The Hockey Writers (Sat Apr 18, 2026)
-
Bowness Locked In, Now the Blue Jackets Face UFA/RFA Decisions at 1st Ohio Battery (Sat Apr 18, 2026)
-
Coyle scores twice, Blue Jackets stay in playoff hunt with 5-2 win over Canadiens at Yahoo Sports NHL (Sat Apr 11, 2026)
-
CBJ 5, MTL 2: Coyle's Two-Goal Night Propels Blue Jackets To Statement Win Over Canadiens As Playoff Hopes Renewed at 1st Ohio Battery (Sat Apr 11, 2026)
-
BOS 4, CBJ 3 (SO): Blue Jackets Squander Three-Goal Lead In Third, Fall To Bruins In Shootout In Demoralizing Loss at 1st Ohio Battery (Sun Mar 29, 2026)
-
Three things the Blue Jackets showed us in last night's win over Carolina at Union Blue (Wed Mar 18, 2026)
-
Charlie Coyle's 4-point night leads the Blue Jackets to a 5-1 win over the Hurricanes at Yahoo Sports NHL (Tue Mar 17, 2026)
-
CBJ 5, CAR 1: Blue Jackets Surge Past Hurricanes Behind Coyle’s Four-Point Night at 1st Ohio Battery (Tue Mar 17, 2026)
-
Can the Blue Jackets put together a trade package for Robert Thomas? at Union Blue (Wed Mar 4, 2026)
-
The Wild Should Steer Clear Of Charlie Coyle at Hockey Wilderness (Tue Mar 3, 2026)
-
3 Right-Shot Center Targets for Hurricanes Ahead of Trade Deadline at The Hockey Writers (Sat Feb 28, 2026)
-
Charlie Coyle thankful for Bruins tenure in first game back with Boston at Boston.com (Fri Feb 27, 2026)
-
One year later, Charlie Coyle trade has been a success for Bruins at Yahoo Sports NHL (Thu Feb 26, 2026)
-
10 Blue Jackets’ Teammate Truths Featuring Charlie Coyle at The Hockey Writers (Thu Feb 19, 2026)
-
Charlie Coyle is the most important pending UFA on the CBJ roster at Union Blue (Mon Feb 9, 2026)
-
Former Avalanche player sitting in limbo as deadline looms at Mile High Sticking (Mon Feb 2, 2026)
-
New Coach, New Life: Rick Bowness Igniting A Blue Jackets Revival at 1st Ohio Battery (Sun Feb 1, 2026)
-
Three things we noticed in last night's Blue Jackets win in Chicago at Union Blue (Sat Jan 31, 2026)
-
Blackhawks Bested By Coyle & Columbus 4-2, Lose Fifth Straight Game at Chicago Hockey Now (Sat Jan 31, 2026)
-
Like a Record Player: Blue Jackets 4, Blackhawks 2 at Second City Hockey (Sat Jan 31, 2026)
-
CBJ 4, CHI 2: Coyle's Hat Trick Leads The Way As Blue Jackets Win Fourth Straight at 1st Ohio Battery (Fri Jan 30, 2026)
-
Former Boston Bruins fan favorite might be shipped out at the trade deadline again at Causway Crowd (Wed Jan 28, 2026)
-
Gameday #50: Mush returns, Coyle hits 1000 at Jackets Cannon (Thu Jan 22, 2026)
-
CBJ 4, PIT 3 (SO): Merzlikins, Coyle Come Up Big In Extra Time As Blue Jackets Win Fourth Straight at 1st Ohio Battery (Sat Jan 17, 2026)
-
CBJ 5, CGY 3: Jenner’s Gordie Howe Hat Trick, Werenski and Coyle’s Three-Point Nights Power Jackets Past Flames in Bowness Debut at 1st Ohio Battery (Tue Jan 13, 2026)
-
Catching up with 3 former Colorado Avalanche players at Mile High Sticking (Fri Dec 26, 2025)
-
Monahan Scores Twice; Blue Jackets Have A Big Third Period To Beat New Jersey at Yahoo Sports NHL (Tue Dec 2, 2025)
-
CBJ 5, NJ 3: Monahan Scores Twice As Blue Jackets Fight Their Way To Victory Over Devils at 1st Ohio Battery (Mon Dec 1, 2025)
-
Bruins are already reaping rewards of their trade-deadline teardown at Boston.com (Sun Nov 16, 2025)
-
CBJ 5, EDM 4: Olivier Scores Twice, Blue Jackets Avoid Late Collapse In Win Over Edmonton at 1st Ohio Battery (Thu Nov 13, 2025)
-
Colorado Avalanche extension proves they fleeced Blue Jackets in Coyle trade at Mile High Sticking (Tue Nov 11, 2025)
-
CBJ 3, STL 2: Werenski Stays Hot, Greaves Shines As Blue Jackets Beat Blues For Fourth Straight Win at 1st Ohio Battery (Sat Nov 1, 2025)
-
CBJ 6, TOR 3: Third Line Of Sillinger, Coyle, Olivier Combines For 11 Points In Maple Leaf Romp at 1st Ohio Battery (Wed Oct 29, 2025)
-
CBJ 6, TOR 3: Fourth Line Of Sillinger, Coyle, Olivier Combines For 11 Points In Maple Leaf Romp at 1st Ohio Battery (Wed Oct 29, 2025)
-
Game Preview: Avalanche Face Wood, Coyle, and Blue Jackets on the Road at Colorado Hockey Now (Thu Oct 16, 2025)
-
Blue Jackets’ Charlie Coyle Hopes to Bring Winning Culture to Team at The Hockey Writers (Mon Sep 22, 2025)
-
Homecomings: Projected returns to Denver for recent, former Avalanche players at Mile High Sticking (Mon Sep 22, 2025)
-
‘It fulfilled a lifelong dream’: Charlie Coyle thanks Bruins fans with social media message at Boston.com (Thu Sep 18, 2025)
-
The Hockey News Sunday Recap: Columbus Blue Jackets at Yahoo Sports NHL (Mon Sep 1, 2025)
-
Blue Jackets 2025-26 season preview: Cole Sillinger may have another offensive level to unlock at Union Blue (Tue Aug 19, 2025)
-
Blue Jackets 2025-26 season preview, Charlie Coyle is a massive upgrade for the bottom six at Union Blue (Tue Aug 12, 2025)
-
Colorado Avalanche could reunite with Evan Rodrigues at Mile High Sticking (Wed Jul 9, 2025)
-
Are the Blue Jackets better or worse today? at Jackets Cannon (Mon Jul 7, 2025)
-
Grading the Blue Jackets trade for Charlie Coyle and Miles Wood at Union Blue (Thu Jul 3, 2025)
-
How Charlie Coyle and Miles Wood fit into the Blue Jackets roster at Union Blue (Fri Jun 27, 2025)
-
Colorado Avalanche trade Coyle, Wood to Blue Jackets: Report at Mile High Sticking (Fri Jun 27, 2025)
-
Don Sweeney's trade deadline fleecing continues after Colorado traded Charlie Coyle at Causway Crowd (Fri Jun 27, 2025)
-
Colorado Avalanche standing pat on Charlie Coyle trade offers for this reason at Mile High Sticking (Wed Jun 25, 2025)
Current Contract
Charlie Coyle signed a $36,000,000 6-year contract with the Columbus Blue Jackets and General Manager Don Waddell on May 12, 2026 with an AAV of $6,000,000. This contract will start in 2026-27 and end after the 2031-32 season. In the first season of the contract the cap hit was equivalent to 5.77% of the salary cap.
Standard Contract (UFA) ( ) (0 ratings)
Charlie Coyle signed a $31,500,000 6-year contract with the Boston Bruins and General Manager Don Sweeney on November 27, 2019 with an AAV of $5,250,000. This contract will start in 2020-21 and end after the 2025-26 season. In the first season of the contract the cap hit was equivalent to 6.44% of the salary cap.
Standard Contract (UFA) ( ) (0 ratings)
| Season | Age* | Clause | Cap Hit | AAV | Perf. Bonus | Sign. Bonus | Salary | Compensation | Minors Salary | Status | |
|---|---|---|---|---|---|---|---|---|---|---|---|
| 2020-21 | 28 | NMC M-NTC | $5,250,000 | $5,250,000 | - | - | $8,000,000 | $8,000,000 | $8,000,000 | UFA | |
| 2021-22 | 29 | NMC M-NTC | $5,250,000 | $5,250,000 | - | - | $6,000,000 | $6,000,000 | $6,000,000 | UFA | |
| 2022-23 | 30 | NMC M-NTC | $5,250,000 | $5,250,000 | - | $1,000,000 | $3,000,000 | $4,000,000 | $4,000,000 | UFA | |
| 2023-24 | 31 | NMC M-NTC | $5,250,000 | $5,250,000 | - | - | $4,500,000 | $4,500,000 | $4,500,000 | UFA | |
| 2024-25 | 32 | NMC M-NTC | $5,250,000 | $5,250,000 | - | - | $4,500,000 | $4,500,000 | $4,500,000 | UFA | |
| 2025-26 | 33 | NMC M-NTC | $5,250,000 | $5,250,000 | - | - | $4,500,000 | $4,500,000 | $4,500,000 | UFA | |
| Total | - | $1,000,000 | $30,500,000 | $31,500,000 | $31,500,000 |
Charlie Coyle signed a $16,000,000 5-year contract with the Minnesota Wild and General Manager Chuck Fletcher on October 23, 2014 with an AAV of $3,200,000. This contract will start in 2015-16 and end after the 2019-20 season. In the first season of the contract the cap hit was equivalent to 4.48% of the salary cap.
Standard Contract (RFA) ( ) (0 ratings)
| Season | Age* | Clause | Cap Hit | AAV | Perf. Bonus | Sign. Bonus | Salary | Compensation | Minors Salary | Status | |
|---|---|---|---|---|---|---|---|---|---|---|---|
| 2015-16 | 23 | $3,200,000 | $3,200,000 | - | - | $1,900,000 | $1,900,000 | $1,900,000 | RFA | ||
| 2016-17 | 24 | $3,200,000 | $3,200,000 | - | - | $2,600,000 | $2,600,000 | $2,600,000 | RFA-arb | ||
| 2017-18 | 25 | $3,200,000 | $3,200,000 | - | - | $3,500,000 | $3,500,000 | $3,500,000 | RFA-arb | ||
| 2018-19 | 26 | $3,200,000 | $3,200,000 | - | - | $3,750,000 | $3,750,000 | $3,750,000 | RFA-arb | ||
| 2019-20 | 27 | $3,200,000 | $3,200,000 | - | - | $4,250,000 | $4,250,000 | $4,250,000 | UFA | ||
| Total | - | - | $16,000,000 | $16,000,000 | $16,000,000 |
Charlie Coyle signed a $2,700,000 3-year contract with the Minnesota Wild and General Manager Chuck Fletcher on March 1, 2012 with an AAV of $900,000. This contract will start in 2012-13 and end after the 2014-15 season. In the first season of the contract the cap hit was equivalent to 1.50% of the salary cap.
Entry Level Contract ( ) (0 ratings)
| Season | Age* | Clause | Cap Hit | AAV | Perf. Bonus | Sign. Bonus | Salary | Compensation | Minors Salary | Status | |
|---|---|---|---|---|---|---|---|---|---|---|---|
| 2012-13 | 20 | $900,000 | $975,000 | $75,000 | $90,000 | $810,000 | $900,000 | $67,500 | ELC | ||
| 2013-14 | 21 | $900,000 | $975,000 | $75,000 | $90,000 | $810,000 | $900,000 | $67,500 | ELC | ||
| 2014-15 | 22 | $900,000 | $975,000 | $75,000 | $90,000 | $810,000 | $900,000 | $67,500 | ELC | ||
| Total | $225,000 | $270,000 | $2,430,000 | $2,700,000 | $202,500 |
Career Statistics
| Regular Season | Playoffs | |||||||||||||||||||
|---|---|---|---|---|---|---|---|---|---|---|---|---|---|---|---|---|---|---|---|---|
| Season | League | Team | GP | G | A | Pts | +/- | PIM | Shots | Sh% | TOI/G | GP | G | A | Pts | +/- | PIM | Shots | Sh% | TOI/G |
| 2008-09 | High-MA | Thayer | 26 | 20 | 28 | 48 | 4 | |||||||||||||
| 2009-10 | U-18 | USNTDP | 4 | 1 | 0 | 1 | 2 | |||||||||||||
| 2009-10 | EJHL | South Shore | 42 | 21 | 42 | 63 | 50 | 4 | 2 | 1 | 3 | |||||||||
| 2010-11 | H-East | Boston University | 37 | 7 | 19 | 26 | 34 | |||||||||||||
| 2010-11 | WJC-A | USA | 6 | 2 | 4 | 6 | +1 | 4 | ||||||||||||
| 2011-12 | H-East | Boston University | 16 | 3 | 11 | 14 | 20 | |||||||||||||
| 2011-12 | WJC-A | USA | 6 | 4 | 1 | 5 | +2 | 2 | ||||||||||||
| 2011-12 | QMJHL | Saint John | 23 | 15 | 23 | 38 | +23 | 8 | 80 | 1,875.0 | 17 | 15 | 19 | 34 | +27 | 8 | 67 | 2,239.0 | ||
| 2011-12 | M-Cup | Saint John | 4 | 4 | 4 | +4 | 2 | 9 | 0.0 | |||||||||||
| 2012-13 | AHL | Houston | 47 | 14 | 11 | 25 | -8 | 22 | 70 | 2,000.0 | ||||||||||
| 2012-13 | NHL | Minnesota Wild | 37 | 8 | 6 | 14 | +3 | 28 | 50 | 16.0 | 15:04 | 5 | 2 | 2 | -4 | 2 | 11 | 0.0 | 18:10 | |
| 2013-14 | NHL | Minnesota Wild | 70 | 12 | 18 | 30 | -7 | 33 | 135 | 8.9 | 17:05 | 13 | 3 | 4 | 7 | -2 | 6 | 23 | 13.0 | 17:50 |
| 2014-15 | WC-A | USA | 5 | 3 | 2 | 5 | +3 | 6 | 8 | |||||||||||
| 2014-15 | NHL | Minnesota Wild | 82 | 11 | 24 | 35 | +13 | 39 | 120 | 9.2 | 14:33 | 10 | 1 | 1 | 2 | -3 | 14 | 7.1 | 14:22 | |
| 2015-16 | NHL | Minnesota Wild | 82 | 21 | 21 | 42 | +1 | 16 | 140 | 15.0 | 17:18 | 6 | 1 | 1 | 2 | -4 | 6 | 13 | 7.7 | 18:50 |
| 2016-17 | NHL | Minnesota Wild | 82 | 18 | 38 | 56 | +13 | 36 | 159 | 11.3 | 16:42 | 5 | 2 | 2 | -1 | 2 | 14 | 14.3 | 17:11 | |
| 2017-18 | NHL | Minnesota Wild | 66 | 11 | 26 | 37 | +8 | 18 | 117 | 9.4 | 16:32 | 5 | -3 | 2 | 10 | 0.0 | 14:06 | |||
| 2018-19 | NHL | Minnesota Wild | 60 | 10 | 18 | 28 | +1 | 16 | 113 | 8.8 | 17:03 | |||||||||
| 2018-19 | NHL | Boston Bruins | 21 | 2 | 4 | 6 | -2 | 4 | 42 | 4.8 | 15:59 | 24 | 9 | 7 | 16 | +8 | 12 | 39 | 23.1 | 15:28 |
| 2019-20 | NHL | Boston Bruins | 70 | 16 | 21 | 37 | +9 | 21 | 145 | 11.0 | 16:47 | 13 | 3 | 2 | 5 | -4 | 2 | 31 | 9.7 | 18:35 |
| 2020-21 | NHL | Boston Bruins | 51 | 6 | 10 | 16 | -4 | 20 | 79 | 7.6 | 16:17 | 11 | 2 | 1 | 3 | -8 | 6 | 16 | 12.5 | 16:20 |
| 2021-22 | NHL | Boston Bruins | 82 | 16 | 28 | 44 | -6 | 32 | 131 | 12.2 | 17:24 | 7 | 2 | 4 | 6 | -7 | 2 | 10 | 20.0 | 16:51 |
| 2022-23 | NHL | Boston Bruins | 82 | 16 | 29 | 45 | +29 | 30 | 139 | 11.5 | 16:59 | 7 | 1 | 1 | 2 | -1 | 4 | 15 | 6.7 | 17:20 |
| 2023-24 | NHL | Boston Bruins | 82 | 25 | 35 | 60 | -2 | 38 | 147 | 17.0 | 18:04 | 13 | 1 | 4 | 5 | 12 | 20 | 5.0 | 18:49 | |
| 2024-25 | NHL | Boston Bruins | 64 | 15 | 7 | 22 | -14 | 18 | 92 | 16.3 | 17:38 | |||||||||
| 2024-25 | NHL | Colorado Avalanche | 19 | 2 | 11 | 13 | +5 | 6 | 23 | 8.7 | 14:48 | 7 | 1 | 1 | -4 | 2 | 7 | 14.3 | 12:50 | |
| 2025-26 | NHL | Columbus Blue Jackets | 82 | 20 | 38 | 58 | +3 | 14 | 144 | 13.9 | 18:06 | |||||||||
| NHL Career | 1032 | 209 | 334 | 543 | +50 | 369 | 1776 | 11.8 | 16:51 | 126 | 26 | 27 | 53 | -33 | 58 | 223 | 11.6 | 16:41 | ||