
 Carl Grundstrom
| Position | Left Wing / Right Wing | Current Team | Philadelphia Flyers |
| Shoots | Left | Current Contract | 1 year ($1,000.0K CapHit) |
| Height | 6'0" | Expires | 2026-27 |
| Weight (lbs) | 200 | Expiry Age (Jun 30) | 29 |
| Age (DOB) | 28 (Dec 1, 1997) | Expiry Status | UFA |
| Drafted | 2016, Round 2, Overall 57 (TOR) |
| Date | Team | Transaction | |
|---|---|---|---|
| Jun 30, 2026 | Philadelphia Flyers | Signed 1 year @ $1.000M AAV starting in 2026-27 | |
| Dec 2, 2025 | Philadelphia Flyers | Recalled from AHL | |
| Nov 12, 2025 | Philadelphia Flyers | Assigned to AHL | |
| Nov 7, 2025 | Philadelphia Flyers | Recalled from AHL | |
| Oct 6, 2025 | Philadelphia Flyers | Assigned to AHL | |
| Oct 6, 2025 | Philadelphia Flyers | Cleared Waivers | |
| Oct 5, 2025 | Philadelphia Flyers | Placed on Waivers | |
| Oct 5, 2025 | Philadelphia Flyers | Acquired from San Jose Sharks | |
| Oct 5, 2025 | San Jose Sharks | Traded to Philadelphia Flyers | |
| Jan 11, 2025 | San Jose Sharks | Activated from IR | |
| Jan 2, 2025 | San Jose Sharks | Placed on IR | |
| Aug 4, 2024 | San Jose Sharks | Signed 2 years @ $1.800M AAV starting in 2024-25 | |
| Aug 11, 2022 | Los Angeles Kings | Signed 2 years @ $1.300M AAV starting in 2022-23 | |
| Sep 1, 2020 | Los Angeles Kings | Signed 2 years @ $725K AAV starting in 2020-21 | |
| Apr 28, 2017 | Toronto Maple Leafs | Signed to an entry level contract. |
Player Card(s)

URL: https://thestanleycap.com/cdn/player_cards/20252026/carl-grundstrom-8479336.png
URL: https://thestanleycap.com/cdn/player_cards/20242025/carl-grundstrom-8479336.png
URL: https://thestanleycap.com/cdn/player_cards/20232024/carl-grundstrom-8479336.png
About Player Cards
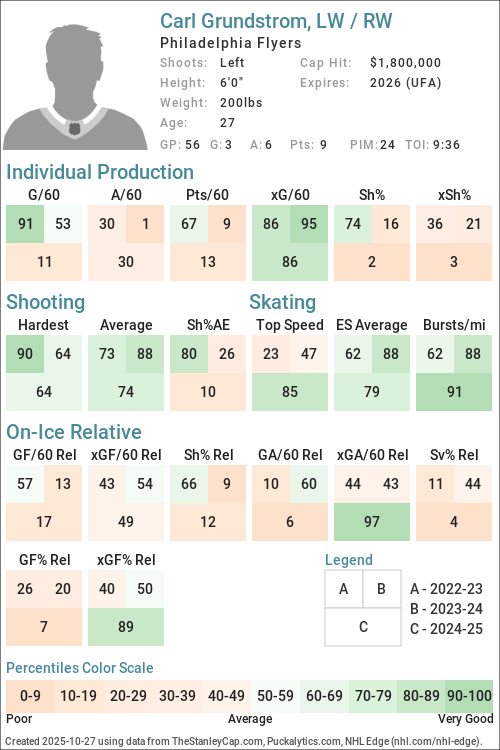
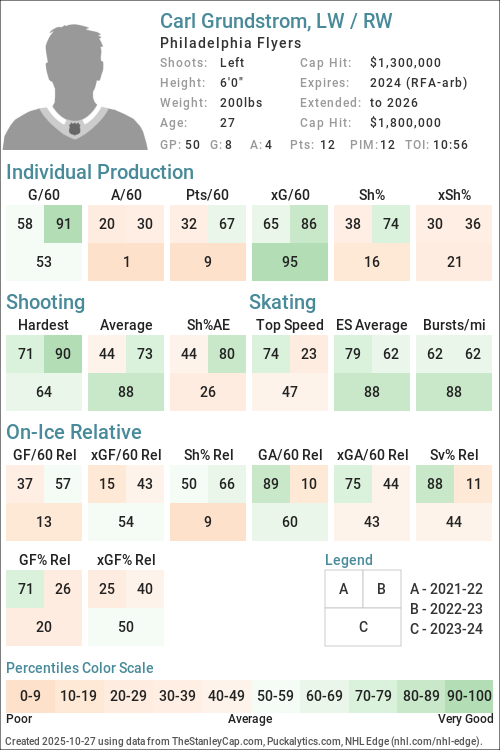
Player cards present an infographic of a players performance using a series of Player Archetypes developed for Puckalytics.com and TheStanleyCap.com. The boxes in the rink image show the archetype ratings for the season specified in the card while the graphs to the right show the five-year trends for those archetypes.
Except for Faceoffs, the values shown are the players z-score (standard deviation from the mean) for the specific metric used to calculate the archetype values. When calculating z-scores forwards were compared to forwards and defensemen were compared to defensemen. Positive values indicate the player is above average and shaded in blue, while negative values indicate the player is below average and shaded in pink. The five year trend charts show a range of -4.0 to 4.0.
The value shown for Faceoffs is the faceoff winning percentage rather than their z-score with winning percentages below 50 in pink shades and above 50 in blue shades.
All archetypes are 5v5 except 5v4 TOI, 4v5 TOI, Skating (even strength) and Faceoffs (all situations). Archetypes use regular season data only.
Archetypes Summary
- Sniper - Measures the to score above the expected goal rate.
- Rebound - Measures the percent of a players shot attempts that come from rebounds (forwards only).
- 5v4 TOI - Powerplay ice time, calculated as the percentage of his teams 5v4 ice time that the player was on the ice for.
- Shooter - Measures whether a players points come from shots (goals or assists on rebounds from his shots).
- Producer - Measures a players ability to produce goals and assists, adjusted for quality of teammates.
- Playmaker - Measures whether a players points come from passes.
- Drive - Measures a players ability to drive puck possession and generate shot attempts for his team.
- Rush - Measures the percent of a players shot attempts that come from rush plays
- Possession - An indicator of a players ability to improve his teams puck possession game.
- Faceoffs - Faceoff Winning Percentage (min. 75 faceoffs taken).
- 5v5 TOI - The percentage of his teams 5v5 TOI that the player was on the ice for.
- Suppress - Measures a players ability to suppress opponent puck possession and shot attempts against.
- Skating - An indicator of a players skating ability, or speed bursts above 20mph per mile skated.
- Defend - An indicator of a players ability to suppress shot quality against.
- 4v5 TOI - Penalty Kill ice time, calculated as the percentage of his teams 4v5 ice time that the player was on the ice for.
Data Sources
- Salary data is from TheStanleyCap.com
- Skating data is from NHL Edge
- Other statistics are from Puckalytics.com and derived from data from NHL.com
Terms of Use
You are free to use include player cards in written articles, share on social media, or on other public websites under the following conditions:
- You credit TheStanleyCap.com as the source and provide a link back to TheStanleyCap.com or this player page.
- You do not mass copy/duplicate/publish dozens or hundreds of player cards. A few, or a handful for a written article is fine. Be reasonable. Fair use rules apply.
- If you are a high-traffic website you must download and host the image(s) on your site rather than overload TheStanleyCap servers with traffic.
Note: Player cards will update daily throughout the season so if you want to include snapshot then you must download the image.
If you have any questions, send an e-mail to the e-mail address at the top of this page.
Read Introducing Player Archetypes on HockeyAnalysis.com for more details on archetype calculations.
Core Archetypes
| Season | Team(s) | GP | TOI | Producer | Playmaker | Shooter | Sniper | Rebound | Rush | Skating | Defend |
|---|---|---|---|---|---|---|---|---|---|---|---|
| 2018-19 | LAK | 15 | -0.58 | -1.62 | 3.55 | 1.66 | 0.14 | -0.65 | - | 0.59 | |
| 2019-20 | LAK | 13 | -0.81 | 0.15 | -1.47 | -3.71 | 2.85 | -0.07 | - | 1.88 | |
| 2020-21 | LAK | 47 | -0.95 | -1.36 | 0.63 | 0.55 | -0.65 | 0.13 | - | 0.36 | |
| 2021-22 | LAK | 54 | -0.26 | -0.78 | 0.41 | -0.01 | -0.95 | -0.18 | 0.10 | 1.25 | |
| 2022-23 | LAK | 57 | 0.53 | -0.78 | 1.71 | 1.16 | -1.54 | 0.89 | 0.15 | -1.20 | |
| 2023-24 | LAK | 50 | -1.34 | -1.56 | 0.04 | -0.48 | 0.44 | -0.73 | 1.25 | -0.14 | |
| 2024-25 | SJS | 56 | -0.63 | -0.42 | -0.64 | -1.09 | 0.39 | 0.63 | 1.42 | -1.74 | |
| 2025-26 | PHI | 47 | -0.79 | -1.55 | 1.15 | 1.31 | 0.41 | -0.18 | 0.92 | 1.29 |
Situational and Secondary Archetypes
| Season | Team(s) | GP | TOI | 5v5 TOI | 5v4 TOI | 4v5 TOI | Possession | Drive | Suppress | Faceoffs |
|---|---|---|---|---|---|---|---|---|---|---|
| 2018-19 | LAK | 15 | -0.01 | 0.34 | -1.95 | 1.91 | 1.30 | 1.35 | - | |
| 2019-20 | LAK | 13 | -0.14 | -1.73 | -1.93 | 0.96 | 1.89 | -0.65 | - | |
| 2020-21 | LAK | 47 | -0.59 | -1.11 | -2.19 | -0.83 | -0.15 | -1.44 | - | |
| 2021-22 | LAK | 54 | -1.06 | -1.75 | -1.87 | -0.55 | -0.87 | 0.23 | - | |
| 2022-23 | LAK | 57 | -1.22 | -1.79 | -1.07 | -0.20 | 0.17 | -0.56 | - | |
| 2023-24 | LAK | 50 | -0.95 | -1.77 | -1.56 | 0.02 | -0.06 | 0.07 | - | |
| 2024-25 | SJS | 56 | -1.71 | -1.93 | -1.95 | 1.24 | 0.44 | 1.58 | - | |
| 2025-26 | PHI | 47 | -0.74 | -1.83 | -0.85 | -1.17 | -1.30 | 0.20 | - |
5v5 Individual Stats
| Season | Team(s) | GP | TOI | G/60 | A/60 | Pts/60 | xG/60 | GAE/60 | Sh% | xSh% | Sh%AE | %SA Rush | %SA Reb. |
|---|---|---|---|---|---|---|---|---|---|---|---|---|---|
| 2018-19 | LAK | 15 | 190:43 | 1.26 | 0.00 | 1.26 | 0.98 | 0.28 | 25.00 | 19.53 | 5.47 | 2.78 | 5.56 |
| 2019-20 | LAK | 13 | 153:21 | 0.00 | 1.56 | 1.56 | 0.74 | -0.74 | 0.00 | 13.49 | -13.49 | 3.70 | 14.81 |
| 2020-21 | LAK | 47 | 529:41 | 0.68 | 0.34 | 1.02 | 0.52 | 0.16 | 10.17 | 7.75 | 2.42 | 4.00 | 4.00 |
| 2021-22 | LAK | 54 | 560:30 | 0.75 | 0.64 | 1.39 | 0.76 | -0.01 | 8.97 | 9.08 | -0.10 | 3.67 | 3.67 |
| 2022-23 | LAK | 57 | 561:02 | 1.18 | 0.75 | 1.92 | 0.84 | 0.34 | 12.79 | 9.13 | 3.66 | 5.56 | 2.38 |
| 2023-24 | LAK | 50 | 514:50 | 0.70 | 0.23 | 0.93 | 0.89 | -0.19 | 6.52 | 8.27 | -1.75 | 2.34 | 9.38 |
| 2024-25 | SJS | 56 | 521:02 | 0.35 | 0.69 | 1.04 | 0.77 | -0.42 | 3.45 | 7.66 | -4.21 | 3.39 | 8.47 |
| 2025-26 | PHI | 47 | 511:11 | 0.94 | 0.35 | 1.29 | 0.66 | 0.28 | 15.69 | 10.98 | 4.71 | 2.35 | 9.41 |
5v5 On Ice Stats
| Season | Team(s) | GP | TOI | SAF/60 | GF/60 | xGF/60 | SAA/60 | GA/60 | xGA/60 | GF% | xGF% | xGF Rel | xGA Rel | xGF% Rel |
|---|---|---|---|---|---|---|---|---|---|---|---|---|---|---|
| 2018-19 | LAK | 15 | 190:43 | 44.99 | 1.89 | 2.93 | 43.73 | 2.83 | 2.23 | 40.00 | 56.79 | 0.47 | -0.65 | 10.75 |
| 2019-20 | LAK | 13 | 153:21 | 54.78 | 3.52 | 3.15 | 44.21 | 2.35 | 2.53 | 60.00 | 55.45 | 0.50 | 0.04 | 3.91 |
| 2020-21 | LAK | 47 | 529:41 | 37.49 | 1.70 | 1.97 | 44.06 | 2.61 | 2.98 | 39.47 | 39.82 | -0.23 | 0.52 | -7.46 |
| 2021-22 | LAK | 54 | 560:30 | 41.86 | 1.93 | 2.38 | 39.50 | 1.61 | 2.48 | 54.55 | 49.01 | -0.52 | -0.17 | -3.28 |
| 2022-23 | LAK | 57 | 561:02 | 45.45 | 2.67 | 2.60 | 38.82 | 2.78 | 2.30 | 49.02 | 53.09 | -0.23 | -0.05 | -1.54 |
| 2023-24 | LAK | 50 | 514:50 | 47.78 | 1.86 | 2.64 | 37.64 | 2.33 | 2.21 | 44.44 | 54.45 | -0.08 | -0.05 | -0.25 |
| 2024-25 | SJS | 56 | 521:02 | 40.88 | 1.38 | 2.21 | 41.34 | 3.68 | 2.30 | 27.27 | 48.98 | 0.00 | -0.56 | 5.44 |
| 2025-26 | PHI | 47 | 511:11 | 31.22 | 2.35 | 1.95 | 36.86 | 1.76 | 2.21 | 57.14 | 46.87 | -0.61 | -0.13 | -5.32 |
NHL Edge Stats
| Skating | Shooting | Zone Time | |||||||||||
|---|---|---|---|---|---|---|---|---|---|---|---|---|---|
| Season | GP | Top Speed | Bursts>20/mi | Avg. Speed | Top Speed | Avg. Speed | %Long Range | %Mid Range | %High Danger | ES DZ% | ES NZ% | ES OZ% | |
| This table is for Basic and Premium subscribers only. To view please login to and/or subscribe to one of our subscription plans. | |||||||||||||
Legend
| Percentile 0-25 | Percentile 25-50 | Percentile 50-75 | Percentile 75-100 |
5v5 Lines
| Season | Teammate | Teammate | Team | TOI | GF/60 | GA/60 | GF% | xGF/60 | xGA/60 | xGF% | xGF Rel | xGA Rel | xGF% Rel |
|---|
Glossary
| Type | Statistic | Definition |
|---|---|---|
| Individual | G/60 | Goals Against per 60 minutes. |
| Individual | A/60 | Assists per 60 minutes. |
| Individual | Pts/60 | Points per 60 minutes. |
| Individual | xG/60 | Expected Goals per 60 minutes. |
| Individual | GAE/60 | Goals Above Expected (G/60 - xG/60). |
| Individual | Sh% | Shooting Percentage. |
| Individual | xSh% | Expected Shooting Percentage. |
| Individual | Sh%AE | Shooting percentage above expected (Sh% - xSh%). |
| Individual | %SA Rush | Percentage of shot attempts determined to be on the rush. |
| Individual | %SA Reb. | Percentage of shot attempts determined to be from rebounds. |
| On Ice | SAF/60 | Shot Attempts For per 60 minutes. |
| On Ice | GF/60 | Goals For per 60 minutes. |
| On Ice | xGF/60 | Expected Goals For per 60 minutes. |
| On Ice | SAA/60 | Shot Attempts Against per 60 minutes (lower is better). |
| On Ice | GA/60 | Goals Against per 60 minutes (lower is better). |
| On Ice | xGA/60 | Expected Goals Against per 60 minutes (lower is better). |
| On Ice | GF% | Goals For Percentage = Goals For / (Goals For + Goals Against) |
| On Ice | xGF% | Expected Goals For Percentage = Expected Goals For / (Expected Goals For + Expected Goals Against) |
| On Ice | xGF Rel | xGF/60 when On Ice - xGF/60 when not On Ice. |
| On Ice | xGA Rel | xGA/60 when On Ice - xGA/60 when not On Ice (lower is better). |
| On Ice | xGF% Rel | xGF% when On Ice - xGF% when not On Ice. |
News and Opinions
-
The Flyers have re-signed Carl Grundstrom to a one-year deal at Flyers Nitty Gritty (Tue Jun 30, 2026)
-
Report: Flyers re-sign Carl Grundstrom to one-year deal at Broad Street Hockey (Tue Jun 30, 2026)
-
2025-26 Player Grades: Carl Grundstrom was surprisingly impactful for the Flyers at Broad Street Hockey (Thu May 28, 2026)
-
Game Breakdown: Flyers two early goals not enough, lose 3-2 to Hurricanes in overtime at Flyers Nitty Gritty (Tue May 5, 2026)
-
Deadline Decisions: Evaluating the Flyers’ Potential Trade Chips Before March 6 at Yahoo Sports NHL (Wed Mar 4, 2026)
-
Flyers are experimenting with their lineup in the worst way at Broad Street Hockey (Wed Mar 4, 2026)
-
Is Denver Barkey sticking with Flyers for rest of the season? at Broad Street Hockey (Tue Jan 6, 2026)
-
Takeaways: Flyers start slow but end up doubling Vancouver in a 6-3 road victory at Broad Street Hockey (Wed Dec 31, 2025)
-
5 New Year’s resolutions for Flyers to make the playoffs at Broad Street Hockey (Tue Dec 30, 2025)
-
Flyers’ 3 Stars of the Week: Barkey remains fun, and the fourth line finally steps up at Broad Street Hockey (Tue Dec 30, 2025)
-
Takeaways: Flyers rebound with solid 5-2 victory over Vancouver as Michkov breaks goal drought at Broad Street Hockey (Tue Dec 23, 2025)
-
Flyers Blog: It’s Time to Call Up Alex Bump at Philly Hockey Now (Thu Dec 18, 2025)
-
Carl Grundstrom’s contributions should force Flyers to re-think fourth line at Broad Street Hockey (Tue Dec 16, 2025)
-
Takeaways: Flyers hang on for a point but lose in the shootout to Carolina 4-3 at Broad Street Hockey (Sun Dec 14, 2025)
-
Game No. 29 Preview: Flyers vs. Golden Knights at Yahoo Sports NHL (Thu Dec 11, 2025)
-
Flyers recall Carl Grundstrom from Lehigh Valley Phantoms at Broad Street Hockey (Tue Dec 2, 2025)
-
Flyers activate Tyson Foerster from IR, reassign Carl Grundstrom to Phantoms at Broad Street Hockey (Wed Nov 12, 2025)
-
Flyers Activate Winger, Loan Grundstrom to AHL Ahead of Wednesday’s Game at Philly Hockey Now (Wed Nov 12, 2025)
-
Flyers vs. Senators: How to watch, lineups, and gamethread at Broad Street Hockey (Sat Nov 8, 2025)
-
Flyers recall Carl Grundstrom from Phantoms, return Aleksei Kolosov at Broad Street Hockey (Fri Nov 7, 2025)
-
What Carl Grundstrom can bring to the Flyers at Broad Street Hockey (Tue Oct 7, 2025)
-
Flyers' massive cap dump trade comes with a surprise twist at Broad Street Buzz (Mon Oct 6, 2025)
-
Rodgrio Abols makes Flyers’ opening roster; Carl Grundstrom on waivers at Broad Street Hockey (Sun Oct 5, 2025)
-
Sharks create roster flexibility by trading Carl Grundstrom to the Flyers at Blades of Teal (Sun Oct 5, 2025)
-
Sharks trade Grundstrom, Guryev to Flyers at Fear the Fin (Sun Oct 5, 2025)
-
Flyers Place New Ryan Ellis Trade Acquisition on Waivers at Yahoo Sports NHL (Sun Oct 5, 2025)
-
Pre-Season Preview/Lines #4: Grundstrom on Roster Bubble? at San Jose Hockey Now (Wed Oct 1, 2025)
Current Contract
Carl Grundstrom signed a $1,000,000 1-year contract with the Philadelphia Flyers and General Manager Daniel Briere on June 30, 2026 with an AAV of $1,000,000. This contract will start in 2026-27 and end after the 2026-27 season. In the first season of the contract the cap hit was equivalent to 0.96% of the salary cap.
Standard Contract (UFA) ( ) (0 ratings)
Carl Grundstrom signed a $3,600,000 2-year contract with the San Jose Sharks and General Manager Mike Grier on August 4, 2024 with an AAV of $1,800,000. This contract will start in 2024-25 and end after the 2025-26 season. In the first season of the contract the cap hit was equivalent to 2.05% of the salary cap.
Standard Contract (RFA) ( ) (0 ratings)
| Season | Age* | Clause | Cap Hit | AAV | Perf. Bonus | Sign. Bonus | Salary | Compensation | Minors Salary | Status | |
|---|---|---|---|---|---|---|---|---|---|---|---|
| 2024-25 | 26 | $1,800,000 | $1,800,000 | - | - | $1,750,000 | $1,750,000 | $1,750,000 | RFA-arb | ||
| 2025-26 | 27 | $1,800,000 | $1,800,000 | - | - | $1,850,000 | $1,850,000 | $1,850,000 | UFA | ||
| Total | - | - | $3,600,000 | $3,600,000 | $3,600,000 |
Carl Grundstrom signed a $2,600,000 2-year contract with the Los Angeles Kings and General Manager Rob Blake on August 11, 2022 with an AAV of $1,300,000. This contract will start in 2022-23 and end after the 2023-24 season. In the first season of the contract the cap hit was equivalent to 1.58% of the salary cap.
Standard Contract (RFA) ( ) (0 ratings)
| Season | Age* | Clause | Cap Hit | AAV | Perf. Bonus | Sign. Bonus | Salary | Compensation | Minors Salary | Status | |
|---|---|---|---|---|---|---|---|---|---|---|---|
| 2022-23 | 24 | $1,300,000 | $1,300,000 | - | - | $1,300,000 | $1,300,000 | $1,300,000 | RFA-arb | ||
| 2023-24 | 25 | $1,300,000 | $1,300,000 | - | - | $1,300,000 | $1,300,000 | $1,300,000 | RFA-arb | ||
| Total | - | - | $2,600,000 | $2,600,000 | $2,600,000 |
Carl Grundstrom signed a $1,450,000 2-year contract with the Los Angeles Kings and General Manager Rob Blake on September 1, 2020 with an AAV of $725,000. This contract will start in 2020-21 and end after the 2021-22 season. In the first season of the contract the cap hit was equivalent to 0.89% of the salary cap.
Standard Contract (RFA) ( ) (0 ratings)
| Season | Age* | Clause | Cap Hit | AAV | Perf. Bonus | Sign. Bonus | Salary | Compensation | Minors Salary | Status | |
|---|---|---|---|---|---|---|---|---|---|---|---|
| 2020-21 | 22 | $725,000 | $725,000 | - | - | $700,000 | $700,000 | $70,000 | RFA | ||
| 2021-22 | 23 | $725,000 | $725,000 | - | - | $750,000 | $750,000 | $750,000 | RFA-arb | ||
| Total | - | - | $1,450,000 | $1,450,000 | $820,000 |
Carl Grundstrom signed a $2,775,000 3-year contract with the Toronto Maple Leafs and General Manager Lou Lamoriello on April 28, 2017 with an AAV of $925,000. This contract will start in 2017-18 and end after the 2019-20 season. In the first season of the contract the cap hit was equivalent to 1.23% of the salary cap.
Entry Level Contract ( ) (0 ratings)
| Season | Age* | Clause | Cap Hit | AAV | Perf. Bonus | Sign. Bonus | Salary | Compensation | Minors Salary | Status | |
|---|---|---|---|---|---|---|---|---|---|---|---|
| 2017-18 | 19 | $925,000 | $925,000 | - | $92,500 | $832,500 | $925,000 | $70,000 | ELC | ||
| 2018-19 | 20 | $925,000 | $925,000 | - | $92,500 | $832,500 | $925,000 | $70,000 | ELC | ||
| 2019-20 | 21 | $925,000 | $925,000 | - | $92,500 | $832,500 | $925,000 | $70,000 | ELC | ||
| Total | - | $277,500 | $2,497,500 | $2,775,000 | $210,000 |
Career Statistics
| Regular Season | Playoffs | |||||||||||||||||||
|---|---|---|---|---|---|---|---|---|---|---|---|---|---|---|---|---|---|---|---|---|
| Season | League | Team | GP | G | A | Pts | +/- | PIM | Shots | Sh% | TOI/G | GP | G | A | Pts | +/- | PIM | Shots | Sh% | TOI/G |
| 2010-11 | U16 SM | IF Björklöven U16 | 3 | 1 | 0 | 1 | ||||||||||||||
| 2011-12 | U16 SM | IF Björklöven U16 | 6 | 5 | 2 | 7 | +2 | 4 | ||||||||||||
| 2011-12 | J18 Allsvenskan | IF Björklöven J18 | 5 | 0 | 1 | 1 | -2 | 2 | ||||||||||||
| 2011-12 | TV-Pucken | Västerbotten | 8 | 0 | 1 | 1 | 12 | 8 | 1 | 1 | 12 | |||||||||
| 2012-13 | J18 Elit | IF Björklöven J18 | 19 | 10 | 8 | 18 | +12 | 24 | ||||||||||||
| 2013-14 | Swe-U18 | MODO U18 | 18 | 19 | 12 | 31 | 47 | 5 | 2 | 2 | 4 | 29 | ||||||||
| 2013-14 | Swe-Jr. | MODO Jr. | 31 | 6 | 4 | 10 | 6 | 1 | ||||||||||||
| 2014-15 | Sweden | MODO | 24 | 2 | 3 | 5 | 8 | |||||||||||||
| 2014-15 | Swe-Jr. | MODO Jr. | 27 | 21 | 15 | 36 | 53 | 4 | 4 | 2 | 6 | 2 | ||||||||
| 2014-15 | Swe-U18 | MODO U18 | 4 | 3 | 3 | 6 | 2 | 3 | 2 | 2 | 4 | |||||||||
| 2015-16 | Sweden | MODO | 49 | 7 | 9 | 16 | 53 | |||||||||||||
| 2015-16 | WJC-20 | Sweden U20 | 7 | 1 | 0 | 1 | +1 | 6 | ||||||||||||
| 2015-16 | J20 Nationell | MoDo Hockey J20 | 1 | 0 | 0 | 0 | -1 | |||||||||||||
| 2015-16 | Swe-Jr. | MODO Jr. | 1 | 0 | 0 | 0 | ||||||||||||||
| 2015-16 | Sweden-Q | MODO | 7 | 1 | 3 | 4 | 6 | |||||||||||||
| 2015-16 | SHL | MoDo Hockey | 49 | 7 | 9 | 16 | -2 | 53 | 7 | 1 | 3 | 4 | +1 | 6 | ||||||
| 2016-17 | Champions HL | Frölunda HC | 13 | 4 | 4 | 8 | 6 | |||||||||||||
| 2016-17 | WJC-20 | Sweden U20 | 7 | 3 | 4 | 7 | +5 | 12 | ||||||||||||
| 2016-17 | SHL | Frölunda HC | 45 | 14 | 6 | 20 | +6 | 6 | 14 | 1 | 1 | 2 | -4 | 4 | ||||||
| 2016-17 | AHL | Toronto Marlies | 6 | 3 | 1 | 4 | -6 | 2 | ||||||||||||
| 2017-18 | Champions HL | Frölunda HC | 7 | 2 | 1 | 3 | -1 | 4 | ||||||||||||
| 2017-18 | AHL | Toronto Marlies | 2 | 1 | 2 | 3 | +1 | 20 | 8 | 6 | 14 | +12 | 14 | |||||||
| 2017-18 | SHL | Frölunda HC | 35 | 17 | 7 | 24 | +8 | 8 | 6 | 2 | 2 | -4 | 2 | |||||||
| 2018-19 | AHL | Toronto Marlies | 42 | 13 | 16 | 29 | +8 | 26 | ||||||||||||
| 2018-19 | NHL | Los Angeles Kings | 15 | 5 | 1 | 6 | -4 | 6 | 26 | 19.2 | 14:58 | |||||||||
| 2018-19 | AHL | Ontario Reign | 13 | 3 | 7 | 10 | -5 | 6 | ||||||||||||
| 2019-20 | AHL | Ontario Reign | 40 | 12 | 16 | 28 | +1 | 36 | ||||||||||||
| 2019-20 | NHL | Los Angeles Kings | 13 | 0 | 4 | 4 | +2 | 8 | 16 | 0.0 | 12:46 | |||||||||
| 2020-21 | NHL | Los Angeles Kings | 47 | 6 | 5 | 11 | -10 | 16 | 66 | 9.1 | 12:28 | |||||||||
| 2020-21 | HockeyAllsvenskan | IF Björklöven | 18 | 5 | 8 | 13 | +4 | 26 | ||||||||||||
| 2021-22 | WC | Sweden | 5 | 1 | 1 | 2 | +2 | 2 | ||||||||||||
| 2021-22 | NHL | Los Angeles Kings | 54 | 9 | 6 | 15 | +4 | 26 | 83 | 10.8 | 10:53 | 6 | 3 | 1 | 4 | -1 | 14 | 21.4 | 14:41 | |
| 2022-23 | NHL | Los Angeles Kings | 57 | 12 | 7 | 19 | -4 | 16 | 90 | 13.3 | 10:45 | 6 | 1 | 1 | -3 | 4 | 6 | 0.0 | 9:47 | |
| 2023-24 | AHL | Ontario Reign | 2 | 1 | 1 | 2 | -1 | |||||||||||||
| 2023-24 | NHL | Los Angeles Kings | 50 | 8 | 4 | 12 | -2 | 12 | 95 | 8.4 | 10:56 | 5 | 4 | 0.0 | 5:42 | |||||
| 2024-25 | NHL | San Jose Sharks | 56 | 3 | 6 | 9 | -21 | 24 | 88 | 3.4 | 9:36 | |||||||||
| 2025-26 | AHL | Lehigh Valley Phantoms | 19 | 6 | 9 | 15 | +5 | 6 | ||||||||||||
| 2025-26 | NHL | Philadelphia Flyers | 47 | 9 | 4 | 13 | +7 | 19 | 56 | 16.1 | 11:51 | 3 | 1 | 1 | +1 | 2 | 4 | 0.0 | 12:57 | |
| NHL Career | 339 | 52 | 37 | 89 | -28 | 127 | 520 | 10.0 | 11:16 | 20 | 3 | 3 | 6 | -3 | 6 | 28 | 10.7 | 10:42 | ||