
 Blake Lizotte
| Position | Center | Current Team | Pittsburgh Penguins |
| Shoots | Left | Current Contract | 3 years ($2.2M CapHit) |
| Height | 5'9" | Expires | 2028-29 |
| Weight (lbs) | 176 | Expiry Age (Jun 30) | 31 |
| Age (DOB) | 28 (Dec 13, 1997) | Expiry Status | UFA |
| Drafted | Undrafted |
| Date | Team | Transaction | |
|---|---|---|---|
| Jan 12, 2026 | Pittsburgh Penguins | Signed 3 years @ $2.250M AAV starting in 2026-27 | |
| Dec 28, 2025 | Pittsburgh Penguins | Activated from IR | |
| Dec 9, 2025 | Pittsburgh Penguins | Placed on IR | |
| Nov 27, 2024 | Pittsburgh Penguins | Activated from IR | |
| Nov 15, 2024 | Pittsburgh Penguins | Placed on IR | |
| Oct 31, 2024 | Pittsburgh Penguins | Activated from IR | |
| Oct 7, 2024 | Pittsburgh Penguins | Placed on IR | |
| Jul 1, 2024 | Pittsburgh Penguins | Signed 2 years @ $1.850M AAV starting in 2024-25 | |
| Mar 21, 2022 | Los Angeles Kings | Signed 2 years @ $1.675M AAV starting in 2022-23 | |
| Jun 25, 2021 | Los Angeles Kings | Signed 1 year @ $800K AAV starting in 2021-22 | |
| Apr 2, 2019 | Los Angeles Kings | Signed to an entry level contract. |
Player Card(s)
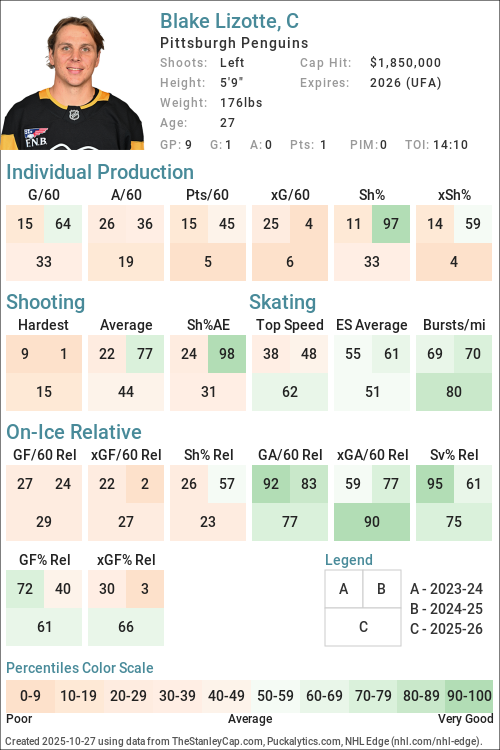
URL: https://thestanleycap.com/cdn/player_cards/20252026/blake-lizotte-8481481.png
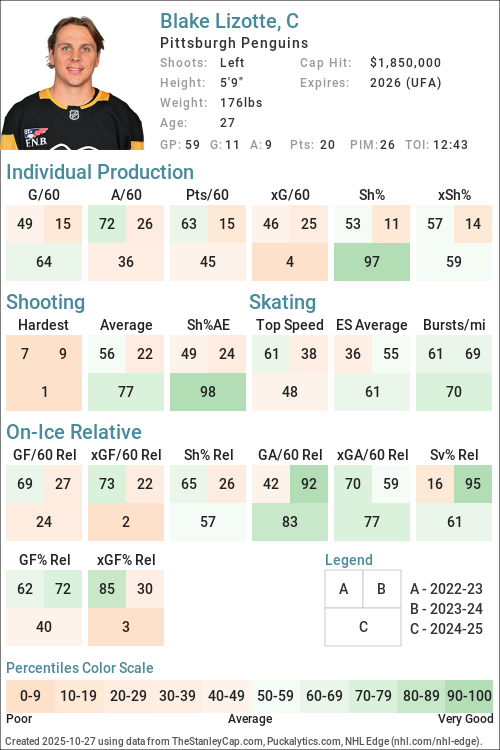
URL: https://thestanleycap.com/cdn/player_cards/20242025/blake-lizotte-8481481.png
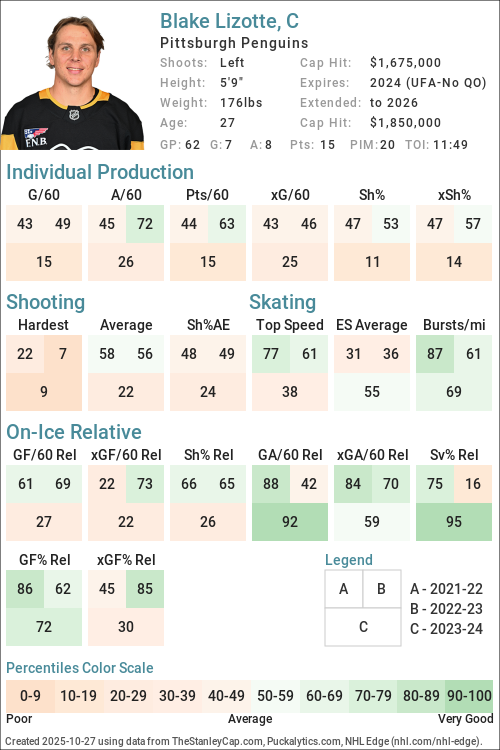
URL: https://thestanleycap.com/cdn/player_cards/20232024/blake-lizotte-8481481.png
About Player Cards
Player cards present an infographic of a players performance using a series of Player Archetypes developed for Puckalytics.com and TheStanleyCap.com. The boxes in the rink image show the archetype ratings for the season specified in the card while the graphs to the right show the five-year trends for those archetypes.
Except for Faceoffs, the values shown are the players z-score (standard deviation from the mean) for the specific metric used to calculate the archetype values. When calculating z-scores forwards were compared to forwards and defensemen were compared to defensemen. Positive values indicate the player is above average and shaded in blue, while negative values indicate the player is below average and shaded in pink. The five year trend charts show a range of -4.0 to 4.0.
The value shown for Faceoffs is the faceoff winning percentage rather than their z-score with winning percentages below 50 in pink shades and above 50 in blue shades.
All archetypes are 5v5 except 5v4 TOI, 4v5 TOI, Skating (even strength) and Faceoffs (all situations). Archetypes use regular season data only.
Archetypes Summary
- Sniper - Measures the to score above the expected goal rate.
- Rebound - Measures the percent of a players shot attempts that come from rebounds (forwards only).
- 5v4 TOI - Powerplay ice time, calculated as the percentage of his teams 5v4 ice time that the player was on the ice for.
- Shooter - Measures whether a players points come from shots (goals or assists on rebounds from his shots).
- Producer - Measures a players ability to produce goals and assists, adjusted for quality of teammates.
- Playmaker - Measures whether a players points come from passes.
- Drive - Measures a players ability to drive puck possession and generate shot attempts for his team.
- Rush - Measures the percent of a players shot attempts that come from rush plays
- Possession - An indicator of a players ability to improve his teams puck possession game.
- Faceoffs - Faceoff Winning Percentage (min. 75 faceoffs taken).
- 5v5 TOI - The percentage of his teams 5v5 TOI that the player was on the ice for.
- Suppress - Measures a players ability to suppress opponent puck possession and shot attempts against.
- Skating - An indicator of a players skating ability, or speed bursts above 20mph per mile skated.
- Defend - An indicator of a players ability to suppress shot quality against.
- 4v5 TOI - Penalty Kill ice time, calculated as the percentage of his teams 4v5 ice time that the player was on the ice for.
Data Sources
- Salary data is from TheStanleyCap.com
- Skating data is from NHL Edge
- Other statistics are from Puckalytics.com and derived from data from NHL.com
Terms of Use
You are free to use include player cards in written articles, share on social media, or on other public websites under the following conditions:
- You credit TheStanleyCap.com as the source and provide a link back to TheStanleyCap.com or this player page.
- You do not mass copy/duplicate/publish dozens or hundreds of player cards. A few, or a handful for a written article is fine. Be reasonable. Fair use rules apply.
- If you are a high-traffic website you must download and host the image(s) on your site rather than overload TheStanleyCap servers with traffic.
Note: Player cards will update daily throughout the season so if you want to include snapshot then you must download the image.
If you have any questions, send an e-mail to the e-mail address at the top of this page.
Read Introducing Player Archetypes on HockeyAnalysis.com for more details on archetype calculations.
Core Archetypes
| Season | Team(s) | GP | TOI | Producer | Playmaker | Shooter | Sniper | Rebound | Rush | Skating | Defend |
|---|---|---|---|---|---|---|---|---|---|---|---|
| 2018-19 | LAK | 1 | - | - | - | -10.11 | -2.24 | -2.02 | - | -10.47 | |
| 2019-20 | LAK | 65 | -0.41 | 1.40 | -1.32 | -1.88 | -1.38 | -1.32 | - | 1.12 | |
| 2020-21 | LAK | 41 | -0.71 | 0.22 | -1.11 | -1.20 | -0.08 | 0.90 | - | 1.48 | |
| 2021-22 | LAK | 70 | -0.44 | -0.28 | -0.47 | -0.03 | 0.13 | 0.33 | 1.13 | 0.67 | |
| 2022-23 | LAK | 81 | 0.16 | 0.56 | -0.44 | 0.10 | -0.24 | -0.09 | 0.12 | -0.94 | |
| 2023-24 | LAK | 62 | -1.17 | -0.69 | -0.98 | -0.72 | 2.30 | -0.74 | 0.38 | 1.83 | |
| 2024-25 | PIT | 59 | 0.18 | -0.13 | 0.26 | 2.04 | 2.91 | 2.50 | 0.46 | 0.33 | |
| 2025-26 | PIT | 55 | -0.31 | 0.53 | -0.89 | -0.42 | -1.16 | 1.14 | 0.69 | 0.46 |
Situational and Secondary Archetypes
| Season | Team(s) | GP | TOI | 5v5 TOI | 5v4 TOI | 4v5 TOI | Possession | Drive | Suppress | Faceoffs |
|---|---|---|---|---|---|---|---|---|---|---|
| 2018-19 | LAK | 1 | -0.80 | -2.02 | -1.98 | 10.18 | 8.91 | 4.45 | - | |
| 2019-20 | LAK | 65 | -0.60 | -0.93 | -0.30 | 0.87 | 0.16 | 1.30 | 50.2 | |
| 2020-21 | LAK | 41 | -0.75 | -1.83 | -0.19 | 0.46 | 0.37 | 0.33 | 50.8 | |
| 2021-22 | LAK | 70 | -0.99 | -1.84 | -0.26 | 0.16 | -0.51 | 0.90 | 51.6 | |
| 2022-23 | LAK | 81 | -0.48 | -1.84 | 0.02 | 0.79 | 0.47 | 0.61 | 51.2 | |
| 2023-24 | LAK | 62 | -1.26 | -1.78 | 0.37 | -0.47 | -0.52 | -0.14 | 46.8 | |
| 2024-25 | PIT | 59 | -0.89 | -1.94 | 0.25 | -1.09 | -1.83 | 0.99 | 51.0 | |
| 2025-26 | PIT | 55 | -0.77 | -1.82 | 1.31 | 0.60 | 0.29 | 0.51 | 50.0 |
5v5 Individual Stats
| Season | Team(s) | GP | TOI | G/60 | A/60 | Pts/60 | xG/60 | GAE/60 | Sh% | xSh% | Sh%AE | %SA Rush | %SA Reb. |
|---|---|---|---|---|---|---|---|---|---|---|---|---|---|
| 2018-19 | LAK | 1 | 11:12 | 0.00 | 0.00 | 0.00 | 1.84 | -1.84 | 0.00 | 34.43 | -34.43 | 0.00 | 0.00 |
| 2019-20 | LAK | 65 | 733:42 | 0.16 | 0.98 | 1.14 | 0.54 | -0.38 | 2.99 | 9.87 | -6.89 | 1.02 | 2.04 |
| 2020-21 | LAK | 41 | 442:15 | 0.27 | 0.95 | 1.22 | 0.50 | -0.23 | 5.88 | 10.87 | -4.99 | 5.66 | 5.66 |
| 2021-22 | LAK | 70 | 742:47 | 0.65 | 0.89 | 1.53 | 0.66 | -0.01 | 9.88 | 10.04 | -0.16 | 4.67 | 6.54 |
| 2022-23 | LAK | 81 | 903:59 | 0.66 | 1.19 | 1.86 | 0.67 | -0.01 | 10.31 | 10.48 | -0.17 | 3.60 | 6.47 |
| 2023-24 | LAK | 62 | 608:00 | 0.39 | 0.69 | 1.09 | 0.57 | -0.18 | 5.97 | 8.62 | -2.65 | 2.33 | 15.12 |
| 2024-25 | PIT | 59 | 644:19 | 0.74 | 0.74 | 1.49 | 0.46 | 0.29 | 19.51 | 11.97 | 7.54 | 6.25 | 15.62 |
| 2025-26 | PIT | 55 | 598:31 | 0.40 | 1.00 | 1.40 | 0.50 | -0.10 | 9.52 | 11.94 | -2.42 | 4.41 | 4.41 |
5v5 On Ice Stats
| Season | Team(s) | GP | TOI | SAF/60 | GF/60 | xGF/60 | SAA/60 | GA/60 | xGA/60 | GF% | xGF% | xGF Rel | xGA Rel | xGF% Rel |
|---|---|---|---|---|---|---|---|---|---|---|---|---|---|---|
| 2018-19 | LAK | 1 | 11:12 | 64.29 | 0.00 | 6.07 | 37.50 | 5.36 | 3.06 | 0.00 | 66.51 | 4.13 | -0.26 | 29.54 |
| 2019-20 | LAK | 65 | 733:42 | 46.12 | 1.47 | 2.69 | 37.29 | 1.96 | 2.20 | 42.86 | 55.01 | 0.19 | -0.32 | 5.25 |
| 2020-21 | LAK | 41 | 442:15 | 41.11 | 2.04 | 2.29 | 39.21 | 2.04 | 2.56 | 50.00 | 47.17 | -0.03 | 0.08 | -1.07 |
| 2021-22 | LAK | 70 | 742:47 | 44.75 | 2.58 | 2.60 | 35.22 | 1.78 | 2.28 | 59.26 | 53.35 | -0.33 | -0.22 | -0.68 |
| 2022-23 | LAK | 81 | 903:59 | 45.47 | 2.85 | 2.83 | 36.31 | 2.46 | 2.28 | 53.75 | 55.37 | 0.15 | -0.13 | 2.75 |
| 2023-24 | LAK | 62 | 608:00 | 42.73 | 2.17 | 2.19 | 38.09 | 1.48 | 2.09 | 59.46 | 51.16 | -0.42 | -0.09 | -3.37 |
| 2024-25 | PIT | 59 | 644:19 | 33.43 | 1.96 | 1.73 | 38.09 | 2.33 | 2.25 | 45.65 | 43.42 | -0.84 | -0.22 | -7.52 |
| 2025-26 | PIT | 55 | 598:31 | 42.40 | 2.11 | 2.69 | 38.09 | 2.21 | 2.31 | 48.84 | 53.77 | -0.06 | -0.30 | 2.49 |
NHL Edge Stats
| Skating | Shooting | Zone Time | |||||||||||
|---|---|---|---|---|---|---|---|---|---|---|---|---|---|
| Season | GP | Top Speed | Bursts>20/mi | Avg. Speed | Top Speed | Avg. Speed | %Long Range | %Mid Range | %High Danger | ES DZ% | ES NZ% | ES OZ% | |
| This table is for Basic and Premium subscribers only. To view please login to and/or subscribe to one of our subscription plans. | |||||||||||||
Legend
| Percentile 0-25 | Percentile 25-50 | Percentile 50-75 | Percentile 75-100 |
5v5 Lines
| Season | Teammate | Teammate | Team | TOI | GF/60 | GA/60 | GF% | xGF/60 | xGA/60 | xGF% | xGF Rel | xGA Rel | xGF% Rel |
|---|
Glossary
| Type | Statistic | Definition |
|---|---|---|
| Individual | G/60 | Goals Against per 60 minutes. |
| Individual | A/60 | Assists per 60 minutes. |
| Individual | Pts/60 | Points per 60 minutes. |
| Individual | xG/60 | Expected Goals per 60 minutes. |
| Individual | GAE/60 | Goals Above Expected (G/60 - xG/60). |
| Individual | Sh% | Shooting Percentage. |
| Individual | xSh% | Expected Shooting Percentage. |
| Individual | Sh%AE | Shooting percentage above expected (Sh% - xSh%). |
| Individual | %SA Rush | Percentage of shot attempts determined to be on the rush. |
| Individual | %SA Reb. | Percentage of shot attempts determined to be from rebounds. |
| On Ice | SAF/60 | Shot Attempts For per 60 minutes. |
| On Ice | GF/60 | Goals For per 60 minutes. |
| On Ice | xGF/60 | Expected Goals For per 60 minutes. |
| On Ice | SAA/60 | Shot Attempts Against per 60 minutes (lower is better). |
| On Ice | GA/60 | Goals Against per 60 minutes (lower is better). |
| On Ice | xGA/60 | Expected Goals Against per 60 minutes (lower is better). |
| On Ice | GF% | Goals For Percentage = Goals For / (Goals For + Goals Against) |
| On Ice | xGF% | Expected Goals For Percentage = Expected Goals For / (Expected Goals For + Expected Goals Against) |
| On Ice | xGF Rel | xGF/60 when On Ice - xGF/60 when not On Ice. |
| On Ice | xGA Rel | xGA/60 when On Ice - xGA/60 when not On Ice (lower is better). |
| On Ice | xGF% Rel | xGF% when On Ice - xGF% when not On Ice. |
News and Opinions
-
Penguins extensions for Connor Dewar, Blake Lizotte are already aging extremely well at Pens Burgh (Mon Jun 29, 2026)
-
2025-26 Season in Review: Connor Dewar at Pens Burgh (Mon May 18, 2026)
-
2025-26 Season in Review: Blake Lizotte at Pens Burgh (Tue May 12, 2026)
-
Porter Martone is getting on the Penguins' nerves early in Game 6 at Broad Street Buzz (Wed Apr 29, 2026)
-
Penguins Notebook: Lizotte, Dewar Return To Practice Ahead Of Stanley Cup Playoffs at Yahoo Sports NHL (Thu Apr 16, 2026)
-
Penguins provide Blake Lizotte injury update ahead of playoffs at Yahoo Sports NHL (Tue Apr 7, 2026)
-
Penguins provide Blake Lizotte injury update ahead of playoffs at Pens Burgh (Tue Apr 7, 2026)
-
Penguins injury update: Lizotte to be re-evaluated in four weeks at Pens Burgh (Tue Mar 17, 2026)
-
Penguins fourth line could have very different look vs. Sabres at Yahoo Sports NHL (Thu Feb 5, 2026)
-
Predicting the Penguins in 2026-27 at Pens Burgh (Wed Jan 14, 2026)
-
Penguins Extend Lizotte, Karlsson to IR at PenguinPoop.com (Tue Jan 13, 2026)
-
There is no downside to Blake Lizotte’s new contract at Pens Burgh (Tue Jan 13, 2026)
-
Recent Moves Show Penguins Are Prioritizing Winning at Yahoo Sports NHL (Tue Jan 13, 2026)
-
Pens sign veteran F Lizotte to 3-year extension at ESPN (Mon Jan 12, 2026)
-
Penguins re-sign Blake Lizotte for three years at Pens Burgh (Mon Jan 12, 2026)
-
Former Kings Center Signs Three-Year Contract Extension at Yahoo Sports NHL (Mon Jan 12, 2026)
-
Pittsburgh Penguins' New Year's Resolutions: 2025 Edition at Yahoo Sports NHL (Wed Dec 31, 2025)
-
Takeaways: Big Forward Registers Hat Trick In Scoring Frenzy As Penguins Beat Blackhawks, 7-3 at Yahoo Sports NHL (Mon Dec 29, 2025)
-
Game Preview: Pittsburgh Penguins @ Chicago Blackhawks 12/28/25 at Pens Burgh (Sun Dec 28, 2025)
-
Blake Lizotte's Impending Return Can't Be Understated Enough at Yahoo Sports NHL (Sun Dec 28, 2025)
-
Penguins Notebook: Lizotte Full Participant In First Practice After Holiday Break at Yahoo Sports NHL (Sat Dec 27, 2025)
-
Penguins Update: Malkin and Lizotte Placed on IR at PenguinPoop.com (Tue Dec 9, 2025)
-
Former LA Kings C helps lift Pens to win on opening night at Rink Royalty (Wed Oct 8, 2025)
-
What Should Expectations Be For Blake Lizotte In 2025-26? at Yahoo Sports NHL (Sat Aug 23, 2025)
-
What Should Expectations Be For Blake Lizotte In 2025-26? at Yahoo Sports (Sat Aug 23, 2025)
-
Gabe Vilardi’s bluntness towards ex-teammate Lizotte is refreshing at Jets White Out (Thu Nov 30, 2023)
Current Contract
Blake Lizotte signed a $6,750,000 3-year contract with the Pittsburgh Penguins and General Manager Kyle Dubas on January 12, 2026 with an AAV of $2,250,000. This contract will start in 2026-27 and end after the 2028-29 season. In the first season of the contract the cap hit was equivalent to 2.16% of the salary cap.
Standard Contract (UFA) ( ) (0 ratings)
Blake Lizotte signed a $3,700,000 2-year contract with the Pittsburgh Penguins and General Manager Kyle Dubas on July 1, 2024 with an AAV of $1,850,000. This contract will start in 2024-25 and end after the 2025-26 season. In the first season of the contract the cap hit was equivalent to 2.10% of the salary cap.
Standard Contract (UFA) ( ) (0 ratings)
| Season | Age* | Clause | Cap Hit | AAV | Perf. Bonus | Sign. Bonus | Salary | Compensation | Minors Salary | Status | |
|---|---|---|---|---|---|---|---|---|---|---|---|
| 2024-25 | 26 | $1,850,000 | $1,850,000 | - | - | $1,850,000 | $1,850,000 | $1,850,000 | RFA-arb | ||
| 2025-26 | 27 | $1,850,000 | $1,850,000 | - | - | $1,850,000 | $1,850,000 | $1,850,000 | UFA | ||
| Total | - | - | $3,700,000 | $3,700,000 | $3,700,000 |
Blake Lizotte signed a $3,350,000 2-year contract with the Los Angeles Kings and General Manager Rob Blake on March 21, 2022 with an AAV of $1,675,000. This contract will start in 2022-23 and end after the 2023-24 season. In the first season of the contract the cap hit was equivalent to 2.03% of the salary cap.
Standard Contract (RFA) ( ) (0 ratings)
| Season | Age* | Clause | Cap Hit | AAV | Perf. Bonus | Sign. Bonus | Salary | Compensation | Minors Salary | Status | |
|---|---|---|---|---|---|---|---|---|---|---|---|
| 2022-23 | 24 | $1,675,000 | $1,675,000 | - | - | $1,675,000 | $1,675,000 | $1,675,000 | RFA-arb | ||
| 2023-24 | 25 | $1,675,000 | $1,675,000 | - | - | $1,675,000 | $1,675,000 | $1,675,000 | RFA-arb | ||
| Total | - | - | $3,350,000 | $3,350,000 | $3,350,000 |
Blake Lizotte signed a $800,000 1-year contract with the Los Angeles Kings and General Manager Rob Blake on June 25, 2021 with an AAV of $800,000. This contract will start in 2021-22 and end after the 2021-22 season. In the first season of the contract the cap hit was equivalent to 0.98% of the salary cap.
Standard Contract (RFA) ( ) (0 ratings)
| Season | Age* | Clause | Cap Hit | AAV | Perf. Bonus | Sign. Bonus | Salary | Compensation | Minors Salary | Status | |
|---|---|---|---|---|---|---|---|---|---|---|---|
| 2021-22 | 23 | $800,000 | $800,000 | - | - | $800,000 | $800,000 | $800,000 | 10.2(c) | ||
| Total | - | - | $800,000 | $800,000 | $800,000 |
Blake Lizotte signed a $2,775,000 3-year contract with the Los Angeles Kings and General Manager Rob Blake on April 2, 2019 with an AAV of $925,000. This contract will start in 2018-19 and end after the 2020-21 season. In the first season of the contract the cap hit was equivalent to 1.16% of the salary cap.
Entry Level Contract ( ) (0 ratings)
| Season | Age* | Clause | Cap Hit | AAV | Perf. Bonus | Sign. Bonus | Salary | Compensation | Minors Salary | Status | |
|---|---|---|---|---|---|---|---|---|---|---|---|
| 2018-19 | 20 | $925,000 | $1,491,667 | - | $92,500 | $832,500 | $925,000 | $70,000 | ELC | ||
| 2019-20 | 21 | $925,000 | $1,491,667 | $850,000 | $92,500 | $832,500 | $925,000 | $70,000 | ELC | ||
| 2020-21 | 22 | $925,000 | $1,491,667 | $850,000 | $92,500 | $832,500 | $925,000 | $70,000 | ELC | ||
| Total | $1,700,000 | $277,500 | $2,497,500 | $2,775,000 | $210,000 |
Career Statistics
| Regular Season | Playoffs | |||||||||||||||||||
|---|---|---|---|---|---|---|---|---|---|---|---|---|---|---|---|---|---|---|---|---|
| Season | League | Team | GP | G | A | Pts | +/- | PIM | Shots | Sh% | TOI/G | GP | G | A | Pts | +/- | PIM | Shots | Sh% | TOI/G |
| 2012-13 | USHS-MN | Chisago Lakes High | 25 | 8 | 19 | 27 | 4 | 3 | 1 | 1 | ||||||||||
| 2013-14 | USHS-MN | Chisago Lakes High | 25 | 11 | 29 | 40 | 3 | 3 | 5 | 8 | ||||||||||
| 2014-15 | NAHL | Minot Minotauros | 56 | 14 | 38 | 52 | +27 | 14 | 6 | 3 | 3 | +1 | 4 | |||||||
| 2015-16 | USHL | Fargo Force | 54 | 12 | 34 | 46 | +13 | 26 | ||||||||||||
| 2016-17 | WJAC-19 | USA U19 | 5 | 0 | 3 | 3 | 2 | |||||||||||||
| 2016-17 | USHL | Fargo Force | 56 | 19 | 46 | 65 | +23 | 42 | 3 | -5 | ||||||||||
| 2017-18 | NCAA | St. Cloud State Univ. | 39 | 8 | 19 | 27 | +16 | 20 | ||||||||||||
| 2018-19 | NCAA | St. Cloud State Univ. | 37 | 14 | 28 | 42 | +28 | 28 | ||||||||||||
| 2018-19 | NHL | Los Angeles Kings | 1 | 0 | 0 | 0 | -1 | 1 | 0.0 | 11:12 | ||||||||||
| 2019-20 | NHL | Los Angeles Kings | 65 | 6 | 17 | 23 | -4 | 20 | 87 | 6.9 | 13:58 | |||||||||
| 2019-20 | AHL | Ontario Reign | 1 | 0 | 0 | 0 | 2 | |||||||||||||
| 2020-21 | NHL | Los Angeles Kings | 41 | 3 | 7 | 10 | +2 | 16 | 42 | 7.1 | 12:42 | |||||||||
| 2021-22 | NHL | Los Angeles Kings | 70 | 10 | 14 | 24 | +15 | 28 | 91 | 11.0 | 12:10 | 7 | 1 | 1 | -1 | 16 | 11 | 0.0 | 13:59 | |
| 2022-23 | NHL | Los Angeles Kings | 81 | 11 | 23 | 34 | +11 | 70 | 108 | 10.2 | 12:57 | 3 | 2 | 4 | 0.0 | 9:42 | ||||
| 2023-24 | NHL | Los Angeles Kings | 62 | 7 | 8 | 15 | +11 | 20 | 76 | 9.2 | 11:49 | 5 | 1 | 1 | 2 | 3 | 33.3 | 10:22 | ||
| 2024-25 | NHL | Pittsburgh Penguins | 59 | 11 | 9 | 20 | -4 | 26 | 51 | 21.6 | 12:43 | |||||||||
| 2025-26 | NHL | Pittsburgh Penguins | 55 | 7 | 12 | 19 | +6 | 25 | 49 | 14.3 | 13:52 | 6 | 2 | 2 | 2 | 3 | 0.0 | 14:12 | ||
| NHL Career | 434 | 55 | 90 | 145 | +36 | 205 | 505 | 10.9 | 12:52 | 21 | 1 | 3 | 4 | -1 | 22 | 21 | 4.8 | 12:34 | ||