
 Beck Malenstyn
| Position | Center / Left Wing | Current Team | Buffalo Sabres |
| Shoots | Left | Current Contract | 6 years ($2.9M CapHit) |
| Height | 6'3" | Expires | 2031-32 |
| Weight (lbs) | 209 | Expiry Age (Jun 30) | 34 |
| Age (DOB) | 28 (Feb 4, 1998) | Expiry Status | UFA |
| Drafted | 2016, Round 5, Overall 145 (WSH) |
| Date | Team | Transaction | |
|---|---|---|---|
| Jun 29, 2026 | Buffalo Sabres | Signed 6 years @ $2.917M AAV starting in 2026-27 | |
| Aug 23, 2024 | Buffalo Sabres | Signed 2 years @ $1.350M AAV starting in 2024-25 | |
| Jun 20, 2022 | Washington Capitals | Signed 2 years @ $762K AAV starting in 2022-23 | |
| Jul 8, 2021 | Washington Capitals | Signed 1 year @ $750K AAV starting in 2021-22 | |
| Apr 10, 2017 | Washington Capitals | Signed to an entry level contract. |
Player Card(s)
URL: https://thestanleycap.com/cdn/player_cards/20252026/beck-malenstyn-8479359.png
URL: https://thestanleycap.com/cdn/player_cards/20242025/beck-malenstyn-8479359.png
URL: https://thestanleycap.com/cdn/player_cards/20232024/beck-malenstyn-8479359.png
About Player Cards
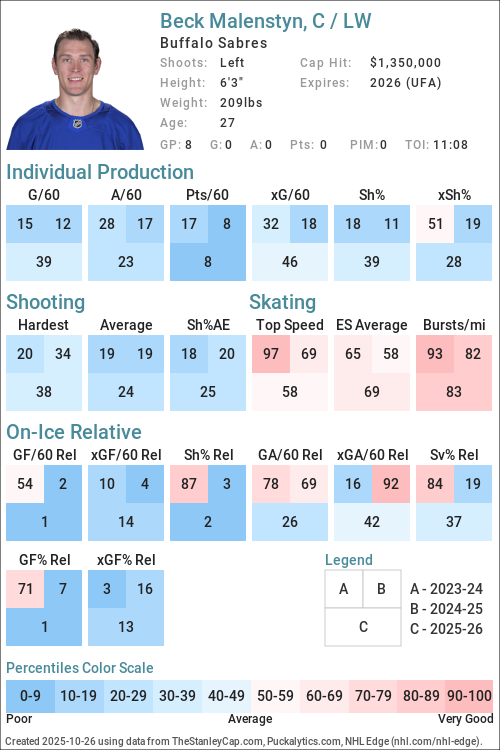
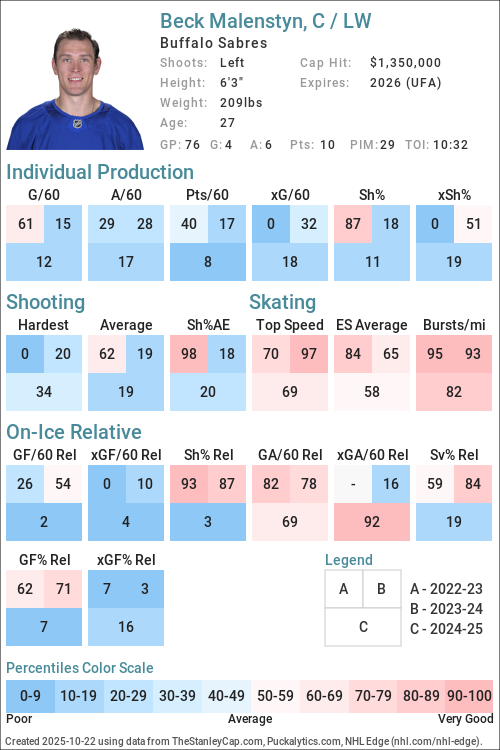
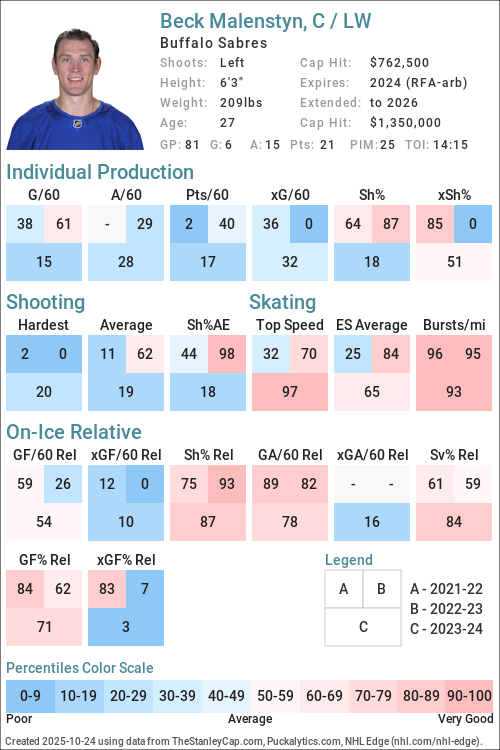
Player cards present an infographic of a players performance using a series of Player Archetypes developed for Puckalytics.com and TheStanleyCap.com. The boxes in the rink image show the archetype ratings for the season specified in the card while the graphs to the right show the five-year trends for those archetypes.
Except for Faceoffs, the values shown are the players z-score (standard deviation from the mean) for the specific metric used to calculate the archetype values. When calculating z-scores forwards were compared to forwards and defensemen were compared to defensemen. Positive values indicate the player is above average and shaded in blue, while negative values indicate the player is below average and shaded in pink. The five year trend charts show a range of -4.0 to 4.0.
The value shown for Faceoffs is the faceoff winning percentage rather than their z-score with winning percentages below 50 in pink shades and above 50 in blue shades.
All archetypes are 5v5 except 5v4 TOI, 4v5 TOI, Skating (even strength) and Faceoffs (all situations). Archetypes use regular season data only.
Archetypes Summary
- Sniper - Measures the to score above the expected goal rate.
- Rebound - Measures the percent of a players shot attempts that come from rebounds (forwards only).
- 5v4 TOI - Powerplay ice time, calculated as the percentage of his teams 5v4 ice time that the player was on the ice for.
- Shooter - Measures whether a players points come from shots (goals or assists on rebounds from his shots).
- Producer - Measures a players ability to produce goals and assists, adjusted for quality of teammates.
- Playmaker - Measures whether a players points come from passes.
- Drive - Measures a players ability to drive puck possession and generate shot attempts for his team.
- Rush - Measures the percent of a players shot attempts that come from rush plays
- Possession - An indicator of a players ability to improve his teams puck possession game.
- Faceoffs - Faceoff Winning Percentage (min. 75 faceoffs taken).
- 5v5 TOI - The percentage of his teams 5v5 TOI that the player was on the ice for.
- Suppress - Measures a players ability to suppress opponent puck possession and shot attempts against.
- Skating - An indicator of a players skating ability, or speed bursts above 20mph per mile skated.
- Defend - An indicator of a players ability to suppress shot quality against.
- 4v5 TOI - Penalty Kill ice time, calculated as the percentage of his teams 4v5 ice time that the player was on the ice for.
Data Sources
- Salary data is from TheStanleyCap.com
- Skating data is from NHL Edge
- Other statistics are from Puckalytics.com and derived from data from NHL.com
Terms of Use
You are free to use include player cards in written articles, share on social media, or on other public websites under the following conditions:
- You credit TheStanleyCap.com as the source and provide a link back to TheStanleyCap.com or this player page.
- You do not mass copy/duplicate/publish dozens or hundreds of player cards. A few, or a handful for a written article is fine. Be reasonable. Fair use rules apply.
- If you are a high-traffic website you must download and host the image(s) on your site rather than overload TheStanleyCap servers with traffic.
Note: Player cards will update daily throughout the season so if you want to include snapshot then you must download the image.
If you have any questions, send an e-mail to the e-mail address at the top of this page.
Read Introducing Player Archetypes on HockeyAnalysis.com for more details on archetype calculations.
Core Archetypes
| Season | Team(s) | GP | TOI | Producer | Playmaker | Shooter | Sniper | Rebound | Rush | Skating | Defend |
|---|---|---|---|---|---|---|---|---|---|---|---|
| 2019-20 | WSH | 3 | - | - | - | -2.43 | -2.06 | -1.80 | - | -1.63 | |
| 2021-22 | WSH | 12 | -1.97 | -1.69 | -0.83 | -0.02 | -2.34 | -2.04 | 2.29 | 0.24 | |
| 2022-23 | WSH | 9 | -0.30 | -0.43 | -0.08 | 1.92 | -2.29 | -1.90 | 1.97 | 0.18 | |
| 2023-24 | WSH | 81 | -1.06 | -0.85 | -0.78 | -0.85 | -0.27 | -0.70 | 1.92 | 0.97 | |
| 2024-25 | BUF | 76 | -1.21 | -1.16 | -0.63 | -0.53 | -0.84 | -0.28 | 0.93 | -0.76 | |
| 2025-26 | BUF | 81 | -1.52 | -1.45 | -0.68 | -0.98 | 1.30 | 0.27 | 2.11 | 0.16 |
Situational and Secondary Archetypes
| Season | Team(s) | GP | TOI | 5v5 TOI | 5v4 TOI | 4v5 TOI | Possession | Drive | Suppress | Faceoffs |
|---|---|---|---|---|---|---|---|---|---|---|
| 2019-20 | WSH | 3 | -2.60 | -2.08 | -0.24 | -1.19 | 0.24 | -2.97 | - | |
| 2021-22 | WSH | 12 | -2.50 | -1.97 | -0.78 | 0.67 | -1.35 | 3.14 | - | |
| 2022-23 | WSH | 9 | -1.51 | -1.88 | -1.73 | 0.12 | -1.78 | 3.97 | - | |
| 2023-24 | WSH | 81 | -0.62 | -1.84 | 2.11 | -1.95 | -1.37 | -1.17 | - | |
| 2024-25 | BUF | 76 | -1.94 | -1.96 | 0.16 | -0.86 | -1.73 | 1.27 | - | |
| 2025-26 | BUF | 81 | -1.68 | -1.85 | 0.73 | -0.82 | -1.36 | 0.62 | - |
5v5 Individual Stats
| Season | Team(s) | GP | TOI | G/60 | A/60 | Pts/60 | xG/60 | GAE/60 | Sh% | xSh% | Sh%AE | %SA Rush | %SA Reb. |
|---|---|---|---|---|---|---|---|---|---|---|---|---|---|
| 2019-20 | WSH | 3 | 23:02 | 0.00 | 0.00 | 0.00 | 0.92 | -0.92 | 0.00 | 8.88 | -8.88 | 0.00 | 0.00 |
| 2021-22 | WSH | 12 | 99:08 | 0.61 | 0.00 | 0.61 | 0.61 | -0.01 | 11.11 | 11.27 | -0.16 | 0.00 | 0.00 |
| 2022-23 | WSH | 9 | 80:27 | 0.75 | 0.75 | 1.49 | 0.41 | 0.34 | 14.29 | 7.86 | 6.43 | 0.00 | 0.00 |
| 2023-24 | WSH | 81 | 906:28 | 0.40 | 0.73 | 1.13 | 0.58 | -0.18 | 6.74 | 9.88 | -3.13 | 2.40 | 7.20 |
| 2024-25 | BUF | 76 | 675:15 | 0.36 | 0.53 | 0.89 | 0.48 | -0.12 | 6.25 | 8.36 | -2.11 | 2.00 | 5.00 |
| 2025-26 | BUF | 81 | 743:03 | 0.40 | 0.40 | 0.81 | 0.65 | -0.25 | 7.69 | 12.41 | -4.72 | 3.06 | 12.24 |
5v5 On Ice Stats
| Season | Team(s) | GP | TOI | SAF/60 | GF/60 | xGF/60 | SAA/60 | GA/60 | xGA/60 | GF% | xGF% | xGF Rel | xGA Rel | xGF% Rel |
|---|---|---|---|---|---|---|---|---|---|---|---|---|---|---|
| 2019-20 | WSH | 3 | 23:02 | 41.68 | 0.00 | 1.82 | 52.10 | 2.60 | 3.14 | 0.00 | 36.66 | -0.70 | 0.29 | -10.24 |
| 2021-22 | WSH | 12 | 99:08 | 39.34 | 3.03 | 2.30 | 33.29 | 1.82 | 1.85 | 62.50 | 55.48 | -0.62 | -0.76 | 2.60 |
| 2022-23 | WSH | 9 | 80:27 | 29.09 | 2.24 | 1.43 | 40.27 | 1.49 | 2.42 | 60.00 | 37.11 | -1.10 | -0.97 | -5.66 |
| 2023-24 | WSH | 81 | 906:28 | 31.18 | 2.12 | 1.73 | 46.20 | 2.25 | 2.70 | 48.48 | 39.08 | -0.69 | 0.24 | -10.59 |
| 2024-25 | BUF | 76 | 675:15 | 33.50 | 1.51 | 1.73 | 38.39 | 2.58 | 2.27 | 36.96 | 43.30 | -0.72 | -0.38 | -4.77 |
| 2025-26 | BUF | 81 | 743:03 | 35.77 | 1.78 | 1.98 | 40.13 | 2.02 | 2.38 | 46.81 | 45.37 | -0.81 | -0.27 | -5.86 |
NHL Edge Stats
| Skating | Shooting | Zone Time | |||||||||||
|---|---|---|---|---|---|---|---|---|---|---|---|---|---|
| Season | GP | Top Speed | Bursts>20/mi | Avg. Speed | Top Speed | Avg. Speed | %Long Range | %Mid Range | %High Danger | ES DZ% | ES NZ% | ES OZ% | |
| This table is for Basic and Premium subscribers only. To view please login to and/or subscribe to one of our subscription plans. | |||||||||||||
Legend
| Percentile 0-25 | Percentile 25-50 | Percentile 50-75 | Percentile 75-100 |
5v5 Lines
| Season | Teammate | Teammate | Team | TOI | GF/60 | GA/60 | GF% | xGF/60 | xGA/60 | xGF% | xGF Rel | xGA Rel | xGF% Rel |
|---|
Glossary
| Type | Statistic | Definition |
|---|---|---|
| Individual | G/60 | Goals Against per 60 minutes. |
| Individual | A/60 | Assists per 60 minutes. |
| Individual | Pts/60 | Points per 60 minutes. |
| Individual | xG/60 | Expected Goals per 60 minutes. |
| Individual | GAE/60 | Goals Above Expected (G/60 - xG/60). |
| Individual | Sh% | Shooting Percentage. |
| Individual | xSh% | Expected Shooting Percentage. |
| Individual | Sh%AE | Shooting percentage above expected (Sh% - xSh%). |
| Individual | %SA Rush | Percentage of shot attempts determined to be on the rush. |
| Individual | %SA Reb. | Percentage of shot attempts determined to be from rebounds. |
| On Ice | SAF/60 | Shot Attempts For per 60 minutes. |
| On Ice | GF/60 | Goals For per 60 minutes. |
| On Ice | xGF/60 | Expected Goals For per 60 minutes. |
| On Ice | SAA/60 | Shot Attempts Against per 60 minutes (lower is better). |
| On Ice | GA/60 | Goals Against per 60 minutes (lower is better). |
| On Ice | xGA/60 | Expected Goals Against per 60 minutes (lower is better). |
| On Ice | GF% | Goals For Percentage = Goals For / (Goals For + Goals Against) |
| On Ice | xGF% | Expected Goals For Percentage = Expected Goals For / (Expected Goals For + Expected Goals Against) |
| On Ice | xGF Rel | xGF/60 when On Ice - xGF/60 when not On Ice. |
| On Ice | xGA Rel | xGA/60 when On Ice - xGA/60 when not On Ice (lower is better). |
| On Ice | xGF% Rel | xGF% when On Ice - xGF% when not On Ice. |
News and Opinions
-
Beck Malenstyn is confident the younger players can step up for the Sabres in 2026-27 at Sabres Noise (Tue Jul 14, 2026)
-
Beck Malenstyn explains 'huge motivator' in re-signing with the Buffalo Sabres at Sabres Noise (Wed Jul 8, 2026)
-
Sabres re-sign left wing Beck Malenstyn to six-year deal at Sabres Space (Tue Jun 30, 2026)
-
Sabres sign Beck Malenstyn to six-year contract at Sabres Space (Tue Jun 30, 2026)
-
Sabres’ Beck Malenstyn gets 6-year contract update at Sabres Space (Tue Jun 30, 2026)
-
Buffalo Sabres sign Beck Malenstyn to 6-year contract at Sabres Space (Tue Jun 30, 2026)
-
Sabres sign Beck Malenstyn to six-year contract at Buffalo Hockey Beat (Mon Jun 29, 2026)
-
Sabres re-sign checking-line forward Beck Malenstyn to 6-year, $17.5 million contract before free agency at Yahoo Sports NHL (Mon Jun 29, 2026)
-
Sabres re-sign checking-line forward Beck Malenstyn to 6-year, $17.5 million contract before free agency at NBC Sports (Mon Jun 29, 2026)
-
Sabres ink Malenstyn to new long-term deal at Die by the Blade (Mon Jun 29, 2026)
-
Sabres re-sign checking-line forward Malenstyn to 6-year, $17.5 million contract before free agency at Yahoo Sports NHL (Mon Jun 29, 2026)
-
NHL Rumors: Florida Panthers, Buffalo Sabres, and the Top 50 NHL Free Agents at NHL Rumors (Mon Jun 29, 2026)
-
How Beck Malenstyn’s surprising 6-year extension impacts Sabres’ free agency plans at Sabres Noise (Mon Jun 29, 2026)
-
5 free agents the Rangers should keep an eye on after landing Pavel Dorofeyev at Blue Line Station (Sun Jun 28, 2026)
-
UFA Beck Malenstyn calls hometown Canucks an ‘interesting’ option, but prioritizes Buffalo return at Canucks Army (Sun Jun 21, 2026)
-
Beck Malenstyn names Buffalo Sabres as his top priority in free agency at Sabres Noise (Sat Jun 20, 2026)
-
Minnesota Wild just made it much harder for the Sabres to keep Beck Malenstyn at Sabres Noise (Tue Jun 9, 2026)
-
Five UFA Forward Targets For Blackhawks This Offseason at Chicago Hockey Now (Thu Jun 4, 2026)
-
Buffalo Sabres face Beck Malenstyn quandary ahead of 2026 NHL free agency at Sabres Noise (Wed Jun 3, 2026)
-
The hidden gem free agent the Maple Leafs need to sign at Editor in Leaf (Wed Jun 3, 2026)
-
Whistle costs Beck Malenstyn, Sabres go-ahead goal: ‘A chaotic sequence’ at Buffalo Hockey Beat (Tue May 19, 2026)
-
Arber Xhekaj sends Beck Malenstyn a clear message after hit on Jakub Dobes at Habs Fanatics (Tue May 12, 2026)
-
Canadiens face Game 4 warning as Sabres expected to target Jakub Dobes again after Malenstyn incident at Habs Fanatics (Tue May 12, 2026)
-
Beck Malenstyn fined maximum by NHL Player Safety after running over Canadiens goaltender Jakub Dobes in his crease at Russian Machine Never Breaks (Mon May 11, 2026)
-
Xhekaj And Malenstyn Fined, Expect More Bad Blood at Yahoo Sports NHL (Mon May 11, 2026)
-
Sabres right wing Beck Malenstyn is kept in stitches for Game 3 at Montreal at Sabres Space (Mon May 11, 2026)
-
Sabres notes: Buffalo changes lineup by inserting Sam Carrick; Beck Malenstyn keeps playing after cut at Sabres Space (Mon May 11, 2026)
-
Beck Malenstyn fonce délibérément sur Jakub Dobeš et ne reçoit que deux minutes at HABSolument Fan (Sun May 10, 2026)
-
Sabres notes: Buffalo changes lineup by inserting Sam Carrick; Beck Malenstyn keeps playing after cut at Buffalo Hockey Beat (Sun May 10, 2026)
-
Sabres’ Beck Malenstyn continues killing penalty after skate hits hand at Sabres Space (Sat May 9, 2026)
-
Beck Malenstyn des Sabres quitte la patinoire avec la main en sang après un contact avec Demidov at HABSolument Fan (Fri May 8, 2026)
-
Sabres' Beck Malenstyn continues killing penalty after skate hits hand at Yahoo Sports NHL (Fri May 8, 2026)
-
Sabres’ Beck Malenstyn adding offense; Buffalo makes change on defense at Sabres Space (Tue Apr 7, 2026)
-
Sabres’ Beck Malenstyn adding offense; Buffalo makes change on defense at Buffalo Hockey Beat (Mon Apr 6, 2026)
-
Sabres Player Spotlight: Beck Malenstyn at The Hockey Writers (Sat Mar 14, 2026)
-
Beck Malenstyn sets NHL’s new all-time skating speed record against Capitals at Russian Machine Never Breaks (Fri Mar 13, 2026)
-
Buffalo Sabres' Beck Malenstyn sets unique NHL record at Sabres Noise (Fri Mar 13, 2026)
-
The Jaws of Defeat, Sharks Fall to Surging Sabres 6-3 at Die by the Blade (Wed Mar 11, 2026)
-
Beck Malenstyn delivers a clear message about the Buffalo Sabres' playoff chase at Sabres Noise (Fri Jan 23, 2026)
-
Beck Malenstyn praises 'all-consuming energy' from Buffalo Sabres fans at Sabres Noise (Wed Jan 14, 2026)
-
This Sabres player's impact goes far beyond the box score at Sabres Noise (Tue Dec 23, 2025)
-
NHL's Top 10 Plays Of November: Quick, McDavid And More Amaze at Yahoo Sports NHL (Tue Dec 2, 2025)
-
The 99th percentile skater who's giving the Buffalo Sabres an unexpected boost at Sabres Noise (Mon Dec 1, 2025)
-
‘Fearless’ Beck Malenstyn playing gritty game, showcasing offensive flair at Sabres Space (Wed Nov 26, 2025)
-
‘Fearless’ Beck Malenstyn playing gritty game, showcasing offensive flair at Buffalo Hockey Beat (Tue Nov 25, 2025)
-
Goal from this Buffalo Sabres was more than just one for the highlight reel at Sabres Noise (Mon Nov 24, 2025)
-
Beck Malenstyn’s spectacular goal helps Sabres beat East-leading Hurricanes 4-1 at Sabres Space (Mon Nov 24, 2025)
-
Beck Malenstyn scores goal of the year candidate against Hurricanes at Russian Machine Never Breaks (Mon Nov 24, 2025)
-
4 takeaways from the Buffalo Sabres unexpected win over the Carolina Hurricanes at Sabres Noise (Sun Nov 23, 2025)
-
Sabres 2025-26 Player Expectations: Fourth-Liner Malenstyn May Be Entering Final Season In Buffalo at Yahoo Sports NHL (Wed Sep 17, 2025)
-
Andrew Cristall has begun his summer training with Connor Bedard, Kent Johnson, Beck Malenstyn, and other NHL players at Russian Machine Never Breaks (Sat Jul 19, 2025)
-
Can Beck Malenstyn have a bounce back season for the Sabres? at Sabres Noise (Sun Jun 15, 2025)
Current Contract
Beck Malenstyn signed a $17,500,000 6-year contract with the Buffalo Sabres and General Manager Jarmo Kekalainen on June 29, 2026 with an AAV of $2,916,667. This contract will start in 2026-27 and end after the 2031-32 season. In the first season of the contract the cap hit was equivalent to 2.80% of the salary cap.
Standard Contract (UFA) ( ) (0 ratings)
Beck Malenstyn signed a $2,700,000 2-year contract with the Buffalo Sabres and General Manager Kevyn Adams on August 23, 2024 with an AAV of $1,350,000. This contract will start in 2024-25 and end after the 2025-26 season. In the first season of the contract the cap hit was equivalent to 1.53% of the salary cap.
Standard Contract (RFA) ( ) (0 ratings)
| Season | Age* | Clause | Cap Hit | AAV | Perf. Bonus | Sign. Bonus | Salary | Compensation | Minors Salary | Status | |
|---|---|---|---|---|---|---|---|---|---|---|---|
| 2024-25 | 26 | $1,350,000 | $1,350,000 | - | - | $1,350,000 | $1,350,000 | $1,350,000 | RFA-arb | ||
| 2025-26 | 27 | $1,350,000 | $1,350,000 | - | - | $1,350,000 | $1,350,000 | $1,350,000 | UFA | ||
| Total | - | - | $2,700,000 | $2,700,000 | $2,700,000 |
Beck Malenstyn signed a $1,525,000 2-year contract with the Washington Capitals and General Manager Brian MacLellan on June 20, 2022 with an AAV of $762,500. This contract will start in 2022-23 and end after the 2023-24 season. In the first season of the contract the cap hit was equivalent to 0.92% of the salary cap.
Standard Contract (RFA) ( ) (0 ratings)
| Season | Age* | Clause | Cap Hit | AAV | Perf. Bonus | Sign. Bonus | Salary | Compensation | Minors Salary | Status | |
|---|---|---|---|---|---|---|---|---|---|---|---|
| 2022-23 | 24 | $762,500 | $762,500 | - | - | $750,000 | $750,000 | $110,000 | RFA | ||
| 2023-24 | 25 | $762,500 | $762,500 | - | - | $775,000 | $775,000 | $775,000 | RFA-arb | ||
| Total | - | - | $1,525,000 | $1,525,000 | $885,000 |
Beck Malenstyn signed a $750,000 1-year contract with the Washington Capitals and General Manager Brian MacLellan on July 8, 2021 with an AAV of $750,000. This contract will start in 2021-22 and end after the 2021-22 season. In the first season of the contract the cap hit was equivalent to 0.92% of the salary cap.
Standard Contract (RFA) ( ) (0 ratings)
| Season | Age* | Clause | Cap Hit | AAV | Perf. Bonus | Sign. Bonus | Salary | Compensation | Minors Salary | Status | |
|---|---|---|---|---|---|---|---|---|---|---|---|
| 2021-22 | 23 | $750,000 | $750,000 | - | - | $750,000 | $750,000 | $90,000 | 10.2(c) | ||
| Total | - | - | $750,000 | $750,000 | $90,000 |
Beck Malenstyn signed a $2,290,000 3-year contract with the Washington Capitals and General Manager Brian MacLellan on April 10, 2017 with an AAV of $763,333. This contract will start in 2017-18 and end after the 2020-21 season. In the first season of the contract the cap hit was equivalent to 1.02% of the salary cap.
Entry Level Contract ( ) (0 ratings)
| Season | Age* | Clause | Cap Hit | AAV | Perf. Bonus | Sign. Bonus | Salary | Compensation | Minors Salary | Status | |
|---|---|---|---|---|---|---|---|---|---|---|---|
| 2017-18 | 19 | $763,333 | $800,000 | - | $80,000 | - | $80,000 | - | ELC | ||
| 2018-19 | 20 | $736,666 | $773,333 | $70,000 | $80,000 | $650,000 | $730,000 | $70,000 | ELC | ||
| 2019-20 | 21 | $736,666 | $773,333 | $20,000 | $80,000 | $700,000 | $780,000 | $70,000 | ELC | ||
| 2020-21 | 22 | $736,666 | $773,333 | $20,000 | - | $700,000 | $700,000 | $70,000 | ELC | ||
| Total | $110,000 | $240,000 | $2,050,000 | $2,290,000 | $210,000 |
Career Statistics
| Regular Season | Playoffs | |||||||||||||||||||
|---|---|---|---|---|---|---|---|---|---|---|---|---|---|---|---|---|---|---|---|---|
| Season | League | Team | GP | G | A | Pts | +/- | PIM | Shots | Sh% | TOI/G | GP | G | A | Pts | +/- | PIM | Shots | Sh% | TOI/G |
| 2011-12 | OMAHA | Okanagan Hockey Academy Btm Prep | 54 | 35 | 24 | 59 | 44 | |||||||||||||
| 2012-13 | OMAHA | Okanagan HA U15 Prep | 57 | 62 | 57 | 119 | 108 | |||||||||||||
| 2012-13 | CSSHL U17 | Okanagan HA Red U17 Prep | 9 | 3 | 3 | 6 | ||||||||||||||
| 2012-13 | U16 Cup | BCMML Sabres 1 | 4 | 1 | 2 | 3 | 2 | |||||||||||||
| 2013-14 | Minor-BC | Okan. HA Midget | 45 | 33 | 26 | 59 | 44 | |||||||||||||
| 2013-14 | WHL | Calgary | 5 | 0 | 3 | 3 | +4 | 4 | ||||||||||||
| 2013-14 | VIJHL | Campbell River | 2 | 0 | 2 | 2 | ||||||||||||||
| 2013-14 | CSSHL | Okanagan H.A. | 21 | 15 | 11 | 26 | 18 | 3 | 3 | 1 | 4 | 4 | ||||||||
| 2014-15 | WHL | Calgary | 51 | 8 | 4 | 12 | +1 | 25 | 34 | 2,350.0 | 11 | 1 | 1 | 2 | -3 | 4 | ||||
| 2015-16 | WJC-18 | Canada U18 | 7 | 1 | 2 | 3 | +2 | 4 | ||||||||||||
| 2015-16 | Hlinka Gretzky Cup | Canada U18 | 4 | 1 | 1 | 2 | +3 | 4 | ||||||||||||
| 2015-16 | U18-Dev | Team Red | 3 | 0 | 1 | 1 | ||||||||||||||
| 2015-16 | WHL | Calgary | 70 | 8 | 17 | 25 | 47 | 5 | 2 | 1 | 3 | -1 | 2 | |||||||
| 2016-17 | WHL | Calgary Hitmen | 70 | 32 | 24 | 56 | -13 | 60 | 4 | -7 | 2 | |||||||||
| 2017-18 | WHL | Calgary Hitmen | 4 | 0 | 3 | 3 | +2 | |||||||||||||
| 2017-18 | M-Cup | Swift Current Broncos | 3 | 1 | 1 | 2 | ||||||||||||||
| 2017-18 | WHL | Swift Current Broncos | 38 | 17 | 12 | 29 | +10 | 28 | 26 | 4 | 7 | 11 | -2 | 18 | ||||||
| 2018-19 | AHL | Hershey Bears | 74 | 7 | 9 | 16 | 66 | 9 | 2 | 2 | 6 | |||||||||
| 2019-20 | AHL | Hershey Bears | 46 | 7 | 8 | 15 | +5 | 20 | ||||||||||||
| 2019-20 | NHL | Washington Capitals | 3 | 0 | 0 | 0 | -1 | 4 | 0.0 | 9:16 | ||||||||||
| 2021-22 | NHL | Washington Capitals | 12 | 1 | 0 | 1 | +2 | 9 | 10 | 10.0 | 9:03 | |||||||||
| 2021-22 | AHL | Hershey Bears | 65 | 10 | 6 | 16 | -8 | 20 | 3 | 1 | 1 | -1 | ||||||||
| 2022-23 | NHL | Washington Capitals | 9 | 1 | 1 | 2 | 2 | 7 | 14.3 | 9:55 | ||||||||||
| 2022-23 | AHL | Hershey Bears | 40 | 6 | 4 | 10 | +1 | 23 | 20 | 4 | 4 | 8 | +2 | 12 | ||||||
| 2023-24 | NHL | Washington Capitals | 81 | 6 | 15 | 21 | -1 | 25 | 98 | 6.1 | 14:15 | 4 | -1 | 2 | 4 | 0.0 | 11:58 | |||
| 2024-25 | NHL | Buffalo Sabres | 76 | 4 | 6 | 10 | -16 | 29 | 67 | 6.0 | 10:32 | |||||||||
| 2025-26 | NHL | Buffalo Sabres | 81 | 7 | 7 | 14 | 38 | 72 | 9.7 | 11:15 | 13 | 1 | 2 | 3 | 8 | 8 | 12.5 | 10:30 | ||
| NHL Career | 262 | 19 | 29 | 48 | -16 | 103 | 258 | 7.4 | 11:48 | 17 | 1 | 2 | 3 | -1 | 10 | 12 | 8.3 | 10:51 | ||