
 Anthony Beauvillier
| Position | Right Wing / Left Wing | Current Team | Washington Capitals |
| Shoots | Left | Current Contract | 2 years ($2.8M CapHit) |
| Height | 5'11" | Expires | 2026-27 |
| Weight (lbs) | 181 | Expiry Age (Jun 30) | 30 |
| Age (DOB) | 29 (June 8, 1997) | Expiry Status | UFA |
| Drafted | 2015, Round 1, Overall 28 (NYI) |
| Date | Team | Transaction | |
|---|---|---|---|
| Jul 3, 2025 | Washington Capitals | Signed 2 years @ $2.750M AAV starting in 2025-26 | |
| Mar 7, 2025 | Washington Capitals | Acquired from Pittsburgh Penguins | |
| Mar 7, 2025 | Pittsburgh Penguins | Traded to Washington Capitals | |
| Jul 1, 2024 | Pittsburgh Penguins | Signed 1 year @ $1.250M AAV starting in 2024-25 | |
| Sep 1, 2021 | New York Islanders | Signed 3 years @ $4.150M AAV starting in 2021-22 | |
| Aug 28, 2019 | New York Islanders | Signed 2 years @ $2.100M AAV starting in 2019-20 | |
| Oct 23, 2015 | New York Islanders | Signed to an entry level contract. |
Player Card(s)
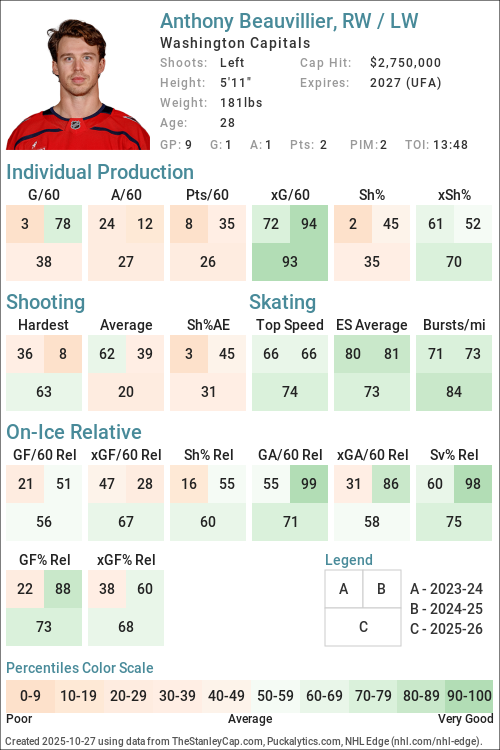
URL: https://thestanleycap.com/cdn/player_cards/20252026/anthony-beauvillier-8478463.png
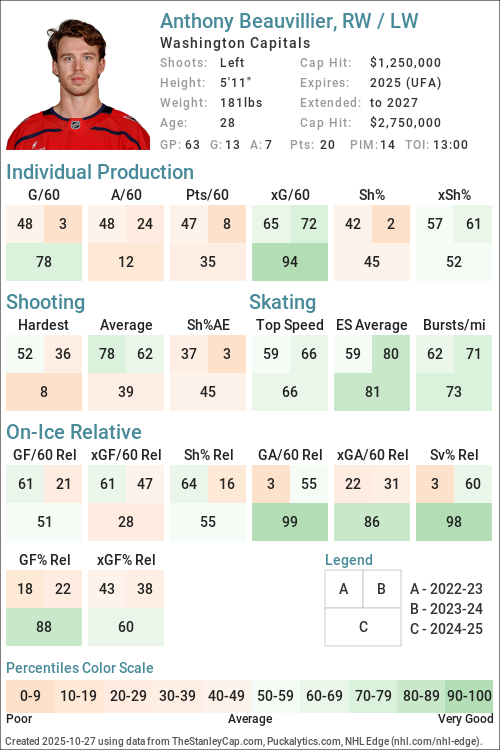
URL: https://thestanleycap.com/cdn/player_cards/20242025/anthony-beauvillier-8478463.png
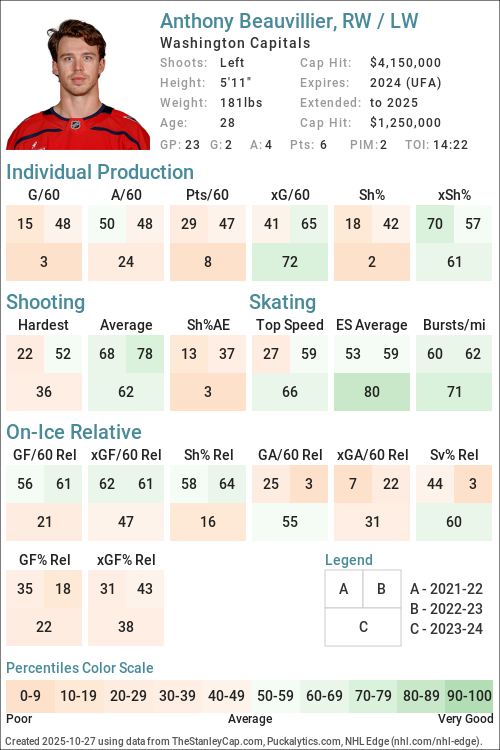
URL: https://thestanleycap.com/cdn/player_cards/20232024/anthony-beauvillier-8478463.png
About Player Cards
Player cards present an infographic of a players performance using a series of Player Archetypes developed for Puckalytics.com and TheStanleyCap.com. The boxes in the rink image show the archetype ratings for the season specified in the card while the graphs to the right show the five-year trends for those archetypes.
Except for Faceoffs, the values shown are the players z-score (standard deviation from the mean) for the specific metric used to calculate the archetype values. When calculating z-scores forwards were compared to forwards and defensemen were compared to defensemen. Positive values indicate the player is above average and shaded in blue, while negative values indicate the player is below average and shaded in pink. The five year trend charts show a range of -4.0 to 4.0.
The value shown for Faceoffs is the faceoff winning percentage rather than their z-score with winning percentages below 50 in pink shades and above 50 in blue shades.
All archetypes are 5v5 except 5v4 TOI, 4v5 TOI, Skating (even strength) and Faceoffs (all situations). Archetypes use regular season data only.
Archetypes Summary
- Sniper - Measures the to score above the expected goal rate.
- Rebound - Measures the percent of a players shot attempts that come from rebounds (forwards only).
- 5v4 TOI - Powerplay ice time, calculated as the percentage of his teams 5v4 ice time that the player was on the ice for.
- Shooter - Measures whether a players points come from shots (goals or assists on rebounds from his shots).
- Producer - Measures a players ability to produce goals and assists, adjusted for quality of teammates.
- Playmaker - Measures whether a players points come from passes.
- Drive - Measures a players ability to drive puck possession and generate shot attempts for his team.
- Rush - Measures the percent of a players shot attempts that come from rush plays
- Possession - An indicator of a players ability to improve his teams puck possession game.
- Faceoffs - Faceoff Winning Percentage (min. 75 faceoffs taken).
- 5v5 TOI - The percentage of his teams 5v5 TOI that the player was on the ice for.
- Suppress - Measures a players ability to suppress opponent puck possession and shot attempts against.
- Skating - An indicator of a players skating ability, or speed bursts above 20mph per mile skated.
- Defend - An indicator of a players ability to suppress shot quality against.
- 4v5 TOI - Penalty Kill ice time, calculated as the percentage of his teams 4v5 ice time that the player was on the ice for.
Data Sources
- Salary data is from TheStanleyCap.com
- Skating data is from NHL Edge
- Other statistics are from Puckalytics.com and derived from data from NHL.com
Terms of Use
You are free to use include player cards in written articles, share on social media, or on other public websites under the following conditions:
- You credit TheStanleyCap.com as the source and provide a link back to TheStanleyCap.com or this player page.
- You do not mass copy/duplicate/publish dozens or hundreds of player cards. A few, or a handful for a written article is fine. Be reasonable. Fair use rules apply.
- If you are a high-traffic website you must download and host the image(s) on your site rather than overload TheStanleyCap servers with traffic.
Note: Player cards will update daily throughout the season so if you want to include snapshot then you must download the image.
If you have any questions, send an e-mail to the e-mail address at the top of this page.
Read Introducing Player Archetypes on HockeyAnalysis.com for more details on archetype calculations.
Core Archetypes
| Season | Team(s) | GP | TOI | Producer | Playmaker | Shooter | Sniper | Rebound | Rush | Skating | Defend |
|---|---|---|---|---|---|---|---|---|---|---|---|
| 2016-17 | NYI | 66 | 0.23 | 0.01 | 0.01 | 0.54 | -1.55 | 0.78 | - | 0.84 | |
| 2017-18 | NYI | 71 | -0.03 | -0.93 | 1.27 | 1.50 | -0.01 | -0.23 | - | 0.45 | |
| 2018-19 | NYI | 81 | -0.53 | -1.26 | 1.07 | 0.27 | 0.69 | 2.27 | - | -1.44 | |
| 2019-20 | NYI | 68 | -0.12 | -0.09 | -0.22 | 0.46 | -0.53 | -0.00 | - | -1.80 | |
| 2020-21 | NYI | 47 | 0.67 | -0.05 | 0.76 | 0.21 | 0.11 | 0.74 | - | 0.42 | |
| 2021-22 | NYI | 74 | -0.75 | -0.31 | -0.90 | -1.47 | 0.32 | -0.61 | 0.05 | -0.14 | |
| 2022-23 | NYI, VAN | 82 | -0.41 | -0.34 | -0.35 | -0.43 | 0.06 | 0.11 | 0.15 | -1.80 | |
| 2023-24 | CHI, NSH, VAN | 60 | -1.36 | -0.73 | -1.18 | -1.76 | -0.71 | -1.15 | 0.46 | 0.22 | |
| 2024-25 | PIT, WSH | 81 | -0.66 | -1.26 | 0.71 | 0.11 | 0.57 | -0.20 | 0.55 | 2.14 | |
| 2025-26 | WSH | 82 | -1.17 | -1.43 | -0.02 | -0.44 | 0.64 | 0.26 | 0.45 | -0.27 |
Situational and Secondary Archetypes
| Season | Team(s) | GP | TOI | 5v5 TOI | 5v4 TOI | 4v5 TOI | Possession | Drive | Suppress | Faceoffs |
|---|---|---|---|---|---|---|---|---|---|---|
| 2016-17 | NYI | 66 | 0.02 | -1.53 | -1.95 | -0.93 | -0.52 | -1.16 | 41.4 | |
| 2017-18 | NYI | 71 | 0.04 | -1.12 | -0.75 | 0.73 | 1.59 | -1.20 | 43.4 | |
| 2018-19 | NYI | 81 | 0.06 | -0.25 | -1.97 | 0.53 | 0.63 | -0.10 | - | |
| 2019-20 | NYI | 68 | 0.82 | 0.12 | -0.90 | -0.09 | 0.12 | -0.40 | - | |
| 2020-21 | NYI | 47 | 0.55 | 0.02 | -1.48 | -0.53 | -0.08 | -0.90 | - | |
| 2021-22 | NYI | 74 | 0.81 | 0.03 | -1.30 | -0.51 | 0.12 | -1.36 | - | |
| 2022-23 | NYI, VAN | 82 | 0.73 | -0.10 | -1.54 | -0.16 | 0.27 | -0.74 | - | |
| 2023-24 | CHI, NSH, VAN | 60 | -0.12 | -0.79 | -2.01 | -0.59 | -0.24 | -0.79 | 51.3 | |
| 2024-25 | PIT, WSH | 81 | -0.24 | -1.81 | -1.77 | 0.16 | 0.02 | 0.20 | - | |
| 2025-26 | WSH | 82 | 0.88 | -1.37 | -0.31 | -0.12 | 0.61 | -1.04 | 50.6 |
5v5 Individual Stats
| Season | Team(s) | GP | TOI | G/60 | A/60 | Pts/60 | xG/60 | GAE/60 | Sh% | xSh% | Sh%AE | %SA Rush | %SA Reb. |
|---|---|---|---|---|---|---|---|---|---|---|---|---|---|
| 2016-17 | NYI | 66 | 810:40 | 0.67 | 1.04 | 1.70 | 0.54 | 0.12 | 9.78 | 7.99 | 1.79 | 5.65 | 1.61 |
| 2017-18 | NYI | 71 | 872:49 | 1.17 | 0.69 | 1.86 | 0.78 | 0.39 | 15.32 | 10.23 | 5.09 | 3.52 | 4.93 |
| 2018-19 | NYI | 81 | 999:04 | 0.96 | 0.48 | 1.44 | 0.90 | 0.06 | 12.80 | 12.04 | 0.76 | 8.70 | 6.83 |
| 2019-20 | NYI | 68 | 932:51 | 0.71 | 0.90 | 1.61 | 0.62 | 0.09 | 11.83 | 10.29 | 1.53 | 3.85 | 4.62 |
| 2020-21 | NYI | 47 | 632:32 | 0.95 | 1.14 | 2.09 | 0.87 | 0.08 | 11.63 | 10.66 | 0.97 | 5.31 | 6.19 |
| 2021-22 | NYI | 74 | 1032:22 | 0.41 | 0.93 | 1.34 | 0.74 | -0.33 | 6.67 | 12.05 | -5.39 | 2.82 | 7.04 |
| 2022-23 | VAN | 33 | 446:40 | 0.81 | 0.94 | 1.75 | 0.83 | -0.02 | 13.64 | 13.98 | -0.34 | 1.56 | 9.38 |
| 2022-23 | NYI | 49 | 644:11 | 0.56 | 0.93 | 1.49 | 0.80 | -0.24 | 6.90 | 9.88 | -2.98 | 5.41 | 6.31 |
| 2022-23 | NYI, VAN | 82 | 1090:51 | 0.66 | 0.94 | 1.60 | 0.81 | -0.15 | 9.16 | 11.26 | -2.10 | 4.00 | 7.43 |
| 2023-24 | VAN | 22 | 264:06 | 0.23 | 0.91 | 1.14 | 0.56 | -0.34 | 3.23 | 7.99 | -4.76 | 2.22 | 0.00 |
| 2023-24 | NSH | 15 | 165:45 | 0.00 | 0.72 | 0.72 | 0.75 | -0.75 | 0.00 | 7.63 | -7.63 | 0.00 | 12.50 |
| 2023-24 | CHI | 23 | 294:30 | 0.41 | 0.41 | 0.81 | 0.87 | -0.46 | 6.67 | 14.18 | -7.51 | 1.67 | 6.67 |
| 2023-24 | CHI, NSH, VAN | 60 | 724:21 | 0.25 | 0.66 | 0.91 | 0.73 | -0.48 | 3.41 | 9.99 | -6.58 | 1.46 | 5.84 |
| 2024-25 | WSH | 18 | 217:42 | 0.55 | 0.83 | 1.38 | 0.90 | -0.35 | 7.41 | 12.12 | -4.72 | 2.50 | 7.50 |
| 2024-25 | PIT | 63 | 758:00 | 0.95 | 0.40 | 1.35 | 0.82 | 0.13 | 10.91 | 9.38 | 1.53 | 2.01 | 9.40 |
| 2024-25 | PIT, WSH | 81 | 975:42 | 0.86 | 0.49 | 1.35 | 0.84 | 0.02 | 10.22 | 9.92 | 0.30 | 2.12 | 8.99 |
| 2025-26 | WSH | 82 | 1106:56 | 0.70 | 0.43 | 1.14 | 0.88 | -0.18 | 9.77 | 12.27 | -2.50 | 3.05 | 10.15 |
5v5 On Ice Stats
| Season | Team(s) | GP | TOI | SAF/60 | GF/60 | xGF/60 | SAA/60 | GA/60 | xGA/60 | GF% | xGF% | xGF Rel | xGA Rel | xGF% Rel |
|---|---|---|---|---|---|---|---|---|---|---|---|---|---|---|
| 2016-17 | NYI | 66 | 810:40 | 37.97 | 2.66 | 1.94 | 47.07 | 2.44 | 2.68 | 52.17 | 42.00 | -0.50 | 0.09 | -6.49 |
| 2017-18 | NYI | 71 | 872:49 | 46.40 | 3.23 | 2.70 | 48.74 | 3.02 | 2.72 | 51.65 | 49.82 | 0.48 | 0.14 | 3.59 |
| 2018-19 | NYI | 81 | 999:04 | 40.84 | 2.40 | 2.64 | 41.38 | 2.34 | 2.48 | 50.63 | 51.57 | 0.28 | 0.19 | 0.77 |
| 2019-20 | NYI | 68 | 932:51 | 38.53 | 2.51 | 2.29 | 44.96 | 3.09 | 2.53 | 44.83 | 47.47 | -0.10 | 0.08 | -1.90 |
| 2020-21 | NYI | 47 | 632:32 | 36.99 | 3.04 | 2.52 | 41.07 | 1.71 | 2.22 | 64.00 | 53.26 | 0.14 | 0.01 | 1.33 |
| 2021-22 | NYI | 74 | 1032:22 | 38.07 | 2.38 | 2.60 | 47.25 | 2.62 | 3.09 | 47.67 | 45.66 | 0.19 | 0.36 | -1.20 |
| 2022-23 | VAN | 33 | 446:40 | 36.27 | 2.69 | 2.45 | 40.97 | 3.22 | 2.50 | 45.45 | 49.52 | 0.11 | 0.07 | 0.42 |
| 2022-23 | NYI | 49 | 644:11 | 44.15 | 2.70 | 2.87 | 46.29 | 2.98 | 2.88 | 47.54 | 49.90 | 0.20 | 0.15 | 0.46 |
| 2022-23 | NYI, VAN | 82 | 1090:51 | 40.92 | 2.70 | 2.70 | 44.11 | 3.08 | 2.72 | 46.67 | 49.76 | 0.16 | 0.12 | 0.44 |
| 2023-24 | VAN | 22 | 264:06 | 39.08 | 2.27 | 2.26 | 41.35 | 0.68 | 2.36 | 76.92 | 48.93 | -0.15 | -0.15 | -0.09 |
| 2023-24 | NSH | 15 | 165:45 | 44.16 | 1.81 | 2.56 | 43.44 | 3.62 | 2.18 | 33.33 | 53.99 | -0.60 | -0.00 | -5.11 |
| 2023-24 | CHI | 23 | 294:30 | 36.67 | 1.43 | 2.24 | 50.12 | 3.26 | 2.87 | 30.43 | 43.82 | 0.39 | 0.09 | 3.87 |
| 2023-24 | CHI, NSH, VAN | 60 | 724:21 | 39.26 | 1.82 | 2.32 | 45.39 | 2.40 | 2.53 | 43.14 | 47.87 | -0.06 | -0.00 | -0.65 |
| 2024-25 | WSH | 18 | 217:42 | 42.44 | 2.48 | 2.29 | 38.31 | 1.65 | 1.98 | 60.00 | 53.59 | -0.47 | -0.70 | 2.90 |
| 2024-25 | PIT | 63 | 758:00 | 41.87 | 2.37 | 2.27 | 41.24 | 2.53 | 2.33 | 48.39 | 49.27 | -0.28 | -0.25 | -0.45 |
| 2024-25 | PIT, WSH | 81 | 975:42 | 42.00 | 2.40 | 2.27 | 40.59 | 2.34 | 2.25 | 50.65 | 50.18 | -0.33 | -0.35 | 0.23 |
| 2025-26 | WSH | 82 | 1106:56 | 43.04 | 2.44 | 2.78 | 42.88 | 2.49 | 2.81 | 49.45 | 49.76 | 0.08 | 0.16 | -0.80 |
NHL Edge Stats
| Skating | Shooting | Zone Time | |||||||||||
|---|---|---|---|---|---|---|---|---|---|---|---|---|---|
| Season | GP | Top Speed | Bursts>20/mi | Avg. Speed | Top Speed | Avg. Speed | %Long Range | %Mid Range | %High Danger | ES DZ% | ES NZ% | ES OZ% | |
| This table is for Basic and Premium subscribers only. To view please login to and/or subscribe to one of our subscription plans. | |||||||||||||
Legend
| Percentile 0-25 | Percentile 25-50 | Percentile 50-75 | Percentile 75-100 |
5v5 Lines
| Season | Teammate | Teammate | Team | TOI | GF/60 | GA/60 | GF% | xGF/60 | xGA/60 | xGF% | xGF Rel | xGA Rel | xGF% Rel |
|---|
Glossary
| Type | Statistic | Definition |
|---|---|---|
| Individual | G/60 | Goals Against per 60 minutes. |
| Individual | A/60 | Assists per 60 minutes. |
| Individual | Pts/60 | Points per 60 minutes. |
| Individual | xG/60 | Expected Goals per 60 minutes. |
| Individual | GAE/60 | Goals Above Expected (G/60 - xG/60). |
| Individual | Sh% | Shooting Percentage. |
| Individual | xSh% | Expected Shooting Percentage. |
| Individual | Sh%AE | Shooting percentage above expected (Sh% - xSh%). |
| Individual | %SA Rush | Percentage of shot attempts determined to be on the rush. |
| Individual | %SA Reb. | Percentage of shot attempts determined to be from rebounds. |
| On Ice | SAF/60 | Shot Attempts For per 60 minutes. |
| On Ice | GF/60 | Goals For per 60 minutes. |
| On Ice | xGF/60 | Expected Goals For per 60 minutes. |
| On Ice | SAA/60 | Shot Attempts Against per 60 minutes (lower is better). |
| On Ice | GA/60 | Goals Against per 60 minutes (lower is better). |
| On Ice | xGA/60 | Expected Goals Against per 60 minutes (lower is better). |
| On Ice | GF% | Goals For Percentage = Goals For / (Goals For + Goals Against) |
| On Ice | xGF% | Expected Goals For Percentage = Expected Goals For / (Expected Goals For + Expected Goals Against) |
| On Ice | xGF Rel | xGF/60 when On Ice - xGF/60 when not On Ice. |
| On Ice | xGA Rel | xGA/60 when On Ice - xGA/60 when not On Ice (lower is better). |
| On Ice | xGF% Rel | xGF% when On Ice - xGF% when not On Ice. |
News and Opinions
-
Anthony Beauvillier: 2025-26 season review at Russian Machine Never Breaks (Sun May 24, 2026)
-
Logan Thompson and Anthony Beauvillier attend Nationals-Braves game, get sneak peek at Alex Ovechkin ‘first pitch’ bobblehead at Russian Machine Never Breaks (Thu Apr 23, 2026)
-
Anthony Beauvillier gives stick to fan wearing Islanders jersey at Capitals-Flyers game: ‘Only here for Beau’ at Russian Machine Never Breaks (Wed Feb 4, 2026)
-
Live updates: Washington Capitals vs Philadelphia Flyers at Xfinity Mobile Arena at Russian Machine Never Breaks (Tue Feb 3, 2026)
-
Former NY Islanders Anthony Beauvillier seems to have finally found a home in DC at Eyes on Isles (Tue Feb 3, 2026)
-
Alex Ovechkin sings ‘we want you baby’ to Anthony Beauvillier ahead of Penguins game: ‘There’s too many teams that don’t want me’ at Russian Machine Never Breaks (Fri Nov 7, 2025)
-
Alex Ovechkin registers 1,625th career point with primary assist on Anthony Beauvillier’s game-winning goal at Russian Machine Never Breaks (Mon Oct 13, 2025)
-
NYR/WSH 10/12 Review: Ryan Lindgren’s Big Brother Robs and Shuts Out Blueshirts; Rangers Still Looking For First Home Goal This Season, No Slow Start Yet For Mika – But Where’s NDArtemi? Tough To Grade Sully’s Squad’s First Test; “Same Old Rangers” Creep In – But The Kids Look Good Too, Soucy Placed on IR; Robertson Embraces “Next Man Up,” M$GN & More at Blue Collar Blue Shirts (Mon Oct 13, 2025)
Current Contract
Anthony Beauvillier signed a $5,500,000 2-year contract with the Washington Capitals and General Manager Chris Patrick on July 3, 2025 with an AAV of $2,750,000. This contract will start in 2025-26 and end after the 2026-27 season. In the first season of the contract the cap hit was equivalent to 2.88% of the salary cap.
Standard Contract (UFA) ( ) (0 ratings)
Anthony Beauvillier signed a $1,250,000 1-year contract with the Pittsburgh Penguins and General Manager Kyle Dubas on July 1, 2024 with an AAV of $1,250,000. This contract will start in 2024-25 and end after the 2024-25 season. In the first season of the contract the cap hit was equivalent to 1.42% of the salary cap.
Standard Contract (UFA) ( ) (0 ratings)
| Season | Age* | Clause | Cap Hit | AAV | Perf. Bonus | Sign. Bonus | Salary | Compensation | Minors Salary | Status | |
|---|---|---|---|---|---|---|---|---|---|---|---|
| 2024-25 | 27 | $1,250,000 | $1,250,000 | - | $250,000 | $1,000,000 | $1,250,000 | $1,250,000 | UFA | ||
| Total | - | $250,000 | $1,000,000 | $1,250,000 | $1,250,000 |
Anthony Beauvillier signed a $12,450,000 3-year contract with the New York Islanders and General Manager Lou Lamoriello on September 1, 2021 with an AAV of $4,150,000. This contract will start in 2021-22 and end after the 2023-24 season. In the first season of the contract the cap hit was equivalent to 5.09% of the salary cap.
Standard Contract (RFA) ( ) (0 ratings)
| Season | Age* | Clause | Cap Hit | AAV | Perf. Bonus | Sign. Bonus | Salary | Compensation | Minors Salary | Status | |
|---|---|---|---|---|---|---|---|---|---|---|---|
| 2021-22 | 24 | $4,150,000 | $4,150,000 | - | - | $4,150,000 | $4,150,000 | $4,150,000 | RFA-arb | ||
| 2022-23 | 25 | $4,150,000 | $4,150,000 | - | - | $4,150,000 | $4,150,000 | $4,150,000 | RFA-arb | ||
| 2023-24 | 26 | $4,150,000 | $4,150,000 | - | - | $4,150,000 | $4,150,000 | $4,150,000 | UFA | ||
| Total | - | - | $12,450,000 | $12,450,000 | $12,450,000 |
Anthony Beauvillier signed a $4,200,000 2-year contract with the New York Islanders and General Manager Lou Lamoriello on August 28, 2019 with an AAV of $2,100,000. This contract will start in 2019-20 and end after the 2020-21 season. In the first season of the contract the cap hit was equivalent to 2.58% of the salary cap.
Standard Contract (RFA) ( ) (0 ratings)
| Season | Age* | Clause | Cap Hit | AAV | Perf. Bonus | Sign. Bonus | Salary | Compensation | Minors Salary | Status | |
|---|---|---|---|---|---|---|---|---|---|---|---|
| 2019-20 | 22 | $2,100,000 | $2,100,000 | - | - | $1,800,000 | $1,800,000 | $1,800,000 | RFA | ||
| 2020-21 | 23 | $2,100,000 | $2,100,000 | - | - | $2,400,000 | $2,400,000 | $2,400,000 | RFA-arb | ||
| Total | - | - | $4,200,000 | $4,200,000 | $4,200,000 |
Anthony Beauvillier signed a $2,775,000 3-year contract with the New York Islanders and General Manager Garth Snow on October 23, 2015 with an AAV of $925,000. This contract will start in 2015-16 and end after the 2018-19 season. In the first season of the contract the cap hit was equivalent to 1.30% of the salary cap.
Entry Level Contract ( ) (0 ratings)
| Season | Age* | Clause | Cap Hit | AAV | Perf. Bonus | Sign. Bonus | Salary | Compensation | Minors Salary | Status | |
|---|---|---|---|---|---|---|---|---|---|---|---|
| 2015-16 | 18 | $925,000 | $1,137,500 | - | $92,500 | - | $92,500 | - | ELC | ||
| 2016-17 | 19 | $894,167 | $1,106,667 | $212,500 | $92,500 | $832,500 | $925,000 | $70,000 | ELC | ||
| 2017-18 | 20 | $894,167 | $1,106,667 | $212,500 | $92,500 | $832,500 | $925,000 | $70,000 | ELC | ||
| 2018-19 | 21 | $894,167 | $1,106,667 | $212,500 | - | $832,500 | $832,500 | $70,000 | ELC | ||
| Total | $637,500 | $277,500 | $2,497,500 | $2,775,000 | $210,000 |
Career Statistics
| Regular Season | Playoffs | |||||||||||||||||||
|---|---|---|---|---|---|---|---|---|---|---|---|---|---|---|---|---|---|---|---|---|
| Season | League | Team | GP | G | A | Pts | +/- | PIM | Shots | Sh% | TOI/G | GP | G | A | Pts | +/- | PIM | Shots | Sh% | TOI/G |
| 2008-09 | QC Int PW | Richelieu Voyageurs | 2 | 0 | 0 | 0 | ||||||||||||||
| 2010-11 | RICBAA | Richelieu Éclaireurs Bantam AA | 34 | 29 | 25 | 54 | 44 | |||||||||||||
| 2011-12 | Minor-QC | Antoine-Girouard | 27 | 27 | 13 | 40 | 52 | |||||||||||||
| 2011-12 | QAAA | Antoine-Girouard | 9 | 1 | 1 | 2 | 4 | 1 | ||||||||||||
| 2012-13 | QAAA | Antoine-Girouard | 41 | 39 | 25 | 64 | 22 | 13 | 5 | 10 | 15 | 24 | ||||||||
| 2013-14 | QMJHL | Shawinigan | 64 | 9 | 24 | 33 | -27 | 26 | 178 | 510.0 | 4 | -3 | 8 | 10 | 0.0 | |||||
| 2014-15 | QMJHL | Shawinigan | 67 | 42 | 52 | 94 | +16 | 72 | 337 | 1,250.0 | 7 | 2 | 5 | 7 | +1 | 14 | 42 | 480.0 | ||
| 2015-16 | WJC-20 | Canada U20 | 5 | 1 | 0 | 1 | 2 | |||||||||||||
| 2015-16 | QMJHL | Shawinigan | 47 | 40 | 39 | 79 | +21 | 57 | 21 | 15 | 15 | 30 | +12 | 16 | ||||||
| 2016-17 | NHL | New York Islanders | 66 | 9 | 15 | 24 | +1 | 10 | 101 | 8.9 | 13:01 | |||||||||
| 2017-18 | NHL | New York Islanders | 71 | 21 | 15 | 36 | +2 | 16 | 132 | 15.9 | 14:32 | |||||||||
| 2017-18 | WC | Canada | 9 | 2 | 1 | 3 | +4 | 10 | ||||||||||||
| 2017-18 | AHL | Bridgeport Islanders | 3 | 2 | 0 | 2 | +2 | |||||||||||||
| 2018-19 | NHL | New York Islanders | 81 | 18 | 10 | 28 | +1 | 8 | 156 | 11.5 | 14:39 | 8 | 1 | 1 | 2 | 15 | 6.7 | 11:24 | ||
| 2019-20 | NHL | New York Islanders | 68 | 18 | 21 | 39 | -11 | 15 | 132 | 13.6 | 17:16 | 22 | 9 | 5 | 14 | +6 | 10 | 67 | 13.4 | 18:33 |
| 2020-21 | NHL | New York Islanders | 47 | 15 | 13 | 28 | +15 | 12 | 109 | 13.8 | 16:24 | 19 | 5 | 8 | 13 | -1 | 4 | 53 | 9.4 | 17:41 |
| 2021-22 | NHL | New York Islanders | 75 | 12 | 22 | 34 | -10 | 12 | 154 | 7.8 | 16:50 | |||||||||
| 2022-23 | NHL | New York Islanders | 49 | 9 | 11 | 20 | -4 | 10 | 113 | 8.0 | 15:47 | |||||||||
| 2022-23 | NHL | Vancouver Canucks | 33 | 9 | 11 | 20 | -6 | 14 | 63 | 14.3 | 16:59 | |||||||||
| 2023-24 | NHL | Chicago Blackhawks | 23 | 2 | 4 | 6 | -10 | 2 | 36 | 5.6 | 14:22 | |||||||||
| 2023-24 | NHL | Vancouver Canucks | 22 | 2 | 6 | 8 | +8 | 4 | 37 | 5.4 | 13:39 | |||||||||
| 2023-24 | NHL | Nashville Predators | 15 | 1 | 2 | 3 | -6 | 2 | 32 | 3.1 | 12:17 | 6 | 1 | 1 | 2 | 2 | 9 | 11.1 | 13:01 | |
| 2024-25 | NHL | Pittsburgh Penguins | 63 | 13 | 7 | 20 | -1 | 14 | 120 | 10.8 | 13:00 | |||||||||
| 2024-25 | NHL | Washington Capitals | 18 | 2 | 3 | 5 | +3 | 29 | 6.9 | 12:25 | 10 | 2 | 4 | 6 | +1 | 2 | 21 | 9.5 | 13:03 | |
| 2025-26 | NHL | Washington Capitals | 82 | 15 | 13 | 28 | +7 | 30 | 155 | 9.7 | 15:48 | |||||||||
| NHL Career | 713 | 146 | 153 | 299 | -11 | 149 | 1369 | 10.7 | 15:06 | 65 | 18 | 19 | 37 | +6 | 18 | 165 | 10.9 | 16:03 | ||